Dogecoin: Small Move, Big Move, What Will You Do?All gains have been removed, most of them. Dogecoin hit yesterday the same level from 6-May. This level was the base that propelled prices to 0.26000. From this high point 11-May, we witnessed a correction lasting more than a month. Total drop amounts to 36.9% (-37%).
Size and duration
» From 6 to 11-May we have 5 days.
» From 7-April to 11-May we have 34 days (bullish).
» From 11-May to 17-June we have 37 days (bearish).
I am making the case that the correction is over. Follow me a little longer and you will be convinced. If you are not convinced by my analysis, you will be convinced when prices start to increase.
Drop vs rise
» The 7-April low was 0.12986.
» The 6-May and 17-June lows was around 0.16400.
While the drop is bigger than the rise, in time duration, the action did not produce new lows (a lower low). Instead, prices remain strong as a higher low.
The low 17-June (yesterday) is 26% higher compared to the low that was hit 7-April.
Now I will make my case stronger.
Past action
Dogecoin peaked 8-December 2024. After this peak, bearish action is really strong and every few weeks we see a new low. Total drop from top to bottom amounts to more than 73%. But here is the thing, the final low in 7-April is still higher compared to the low in early August 2024.
» What you are seeing now is a "small move," (1).
» What comes next is a "big move," (2).
Now you know what is coming to Dogecoin—the altcoins market—what will you do?
Namaste.
Dogeusdt

DOGE/USDTDogecoin is currently in a trading range and could enter a trend if it breaks the upper and lower lines. We'll have to wait and see what happens.

DOGE: A Reversal In Development?Im monitoring for something like this on DOGE with the plan to DCA as it takes SSL and comes into the range low and demand.
Looking a little weak here with signs on majors of weakness, i can see this going into the SSL and lower demand areas marked.
Still seeing this as a large range development and looking for a HTF bullish reversal to form in this region.
Although theres unmitigated demand in the discount below as marked around $0.11, i dont see this targeting that just yet and my main thesis and bias is this potential range and reversal region we are in here.
1D:
3D:
1W:
1M:

Dogecoin Weekly, Bullish Update —1,2,3,4,5 SequenceJust to make sure we have a little bit of everything, here we have Dogecoin sandwiched in-between EMA34 and MA200.
» XRP is trading above these two levels.
» ADA is trading below.
» ETH is trading above.
» BTC is mixed.
Seeing DOGE in-between can reveal a few things.
No drama, MA200 will hold.
MA200 sits at $0.13822.
Notice the drop between December 2024 and March 2025.
Big red candles; straight down.
Notice the more recent drop, between early May and early June.
Small candles and a curve is starting to show already.
What I am gathering from all these charts is that the retrace only has 1-2 weeks left. I say 1-3 weeks just to play it safe, but it seems to be almost over, the bearish action.
Look at this 1,2,3,4,5 sequence.
1) The last peak.
2) The main low.
3) Initial breakout.
4) Retrace and higher low.
5) The next peak.
We are currently at #4. This means that we are set to experience a new wave of growth, "the next peak."
Thanks a lot for your continued support.
Namaste.

This retrace was never weakness — it was refinementDOGE delivered the exact narrative I’ve come to expect from algorithmic flow on the low timeframes. This wasn’t about volatility. This was about cleanup.
The play:
After the initial spike, price formed a visible FVG and retraced into the 0.5–0.618 fib zone. That’s not random — that’s rebalancing. Not only did we see a fade into the midpoint, but volume increased into the dip, not out of it.
What this does is simple: it clears out early longs, taps deeper liquidity, and prepares for re-delivery — all while structure remains intact.
Expectation:
Two paths are mapped — both favoring upside:
Ideal scenario: sweep 0.618 or 0.786 (down to 0.1726) → quick rejection → rally back into the FVG and above
Conservative: hold above 0.1761 fib (0.5) and slowly grind into 0.1795
Final target remains the inefficiency fill near 0.1825
Risk profile:
Entry: 0.174–0.176 zone
Invalidation: below 0.169
TP1: 0.1795
TP2: 0.1825
I’m not interested in chasing. I’m interested in absorption. This is where smart entries are born — deep in discount, backed by displacement.
Final word:
“If you can’t see the intention behind the pullback, you’re not trading Smart Money — you’re reacting to it.”

doge coin targetsBased on the blocks formed and the trend of Dogecoin. The trend of Dogecoin in the coming days and possible targets are shown in the image. Follow me to be informed of new analyses.

DOGEUSDT 1D AnalysisDOGE ~ 1D Analysis
#DOGE Buy back gradually from here with a short term target of at least 15%+, Long term target $0.5

Dogecoin, How Far Down Can It Go? Support Confirmed!The retrace is on and Dogecoin is moving lower with a full red candle. The trading day just started and this is truly concerning. As soon as I saw what was happening, bearish momentum growing, I wondered, will the last low (7-April) break or hold?
That's the question I will try to answer.
Since we already looked at the candles and chart structure (lower highs), I looked at the RSI to try and find some clues. Sure, the RSI is already bearish and became really weak 5-June. This is a positive signal because we are looking for signs of a reversal.
Once the RSI becomes weak it immediately starts to turn and the change happens first on the RSI and later the price. This is how you end up with a bullish or bearish divergence on the chart.
For the 7-April low to break, the RSI would have to go into extreme levels, ultra-weak/oversold, but this isn't likely, which means that there is a good chance that the 7-April low will hold.
A support zone is already being tested now which is the 0.618-0.786 Fib. retracement in relation to the April-May wave. While this is a weak support because it is based on the short-term, it is still a support zone and lots of bearish ammunition will be consumed here.
The 7-April low was a peak in September 2024 and also a bigger range from July 2024 (resistance turned support). In October 2024 this level was broken and tested one last time as support before the last bullish wave Dogecoin produced leading to a multi-year high.
In November 2024 again this level was tested on a wick and held nicely.
All in all, this means that we are likely to end with a higher low because this is a very strong support zone. I made it red on the chart.
If the action does move lower, it should only do so briefly on a candle wick. If you are lucky enough to be around when this takes place, you can go all-in at this point and you will be sitting on a great position for the next bullish wave.
Namaste.

doge buy long term "🌟 Welcome to Golden Candle! 🌟
We're a team of 📈 passionate traders 📉 who love sharing our 🔍 technical analysis insights 🔎 with the TradingView community. 🌎
Our goal is to provide 💡 valuable perspectives 💡 on market trends and patterns, but 🚫 please note that our analyses are not intended as buy or sell recommendations. 🚫
Instead, they reflect our own 💭 personal attitudes and thoughts. 💭
Follow along and 📚 learn 📚 from our analyses! 📊💡"

Dogecoin Bearish But...Yes, Dogecoin is bearish now but this is only a short-term situation, it is the end of a long-term correction. Notice the chart, Dogecoin has been producing lower highs long-term, since December 2024.
Recently, there was a major low in April and then a recovery and after this recovery we have local lower highs. The current drop is the continuation of the retrace that started 11-May. This retrace should end soon, within weeks or just a few days.
As soon as the low settles, we can enter the market bullish again. If you trade spot, simply wait. Day traders can easily SHORT but the range is short, after a small drop cover and switch back to LONG. Experts only.
That's the scenario. We are very likely to get a higher low compared to 7-April. If too many leveraged positions are open though and the market wants to remove those, there can be a long wick that pierces support for the action to recover the next day.
So, the drop can be fast, can be small, can be hard, can be easy or it can be short, it doesn't matter, once it is over, Dogecoin will continue to grow.
Patience is key.
Thanks a lot for your continued support.
Namaste.

DOGEUSDT BINANCE:DOGEUSDT Price is ranging between 0.18200 and 0.18650 dollars after a sharp rise from 0.17000. A break above 0.186 triggers a buy, targeting 0.19450 and 0.19950 dollars. A break below 0.182 triggers a sell, with supports at 0.17650 and 0.17000 dollars.
Trigger Levels:
Buy Trigger: 0.186
Sell Trigger: 0.182
⚠️Contorl Risk management for trades.

Doge Double Trouble $0.22 or $0.17 NextTwofer Doge . 10-15% move either way likely based on how bitcoin does.
Breakout
0.224
Breakdown
0.172
Decided to throw this chart together based on my original idea of the end to end cloud touch that is working out well.

Everything Looks Fine Until You're Liquidated Ever felt like the market is calm and steady, then boom — everything crashes?
Everything seems fine … until one liquidation candle slaps you awake.
This analysis explores how the illusion of safety can destroy your capital — and how to use TradingView tools to stay ahead.
Hello✌
Spend 3 minutes ⏰ reading this educational material.
🎯 Analytical Insight on Dogecoin:
If Dogecoin fails to gain at least 30% in the next two weeks—while Bitcoin continues to rally—this divergence could signal a broader market weakness. When BTC outperforms and altcoins lag, it often reflects declining risk appetite and potential capital rotation out of speculative assets. A move toward the $0.25 target is key for confirming bullish continuation across the altcoin sector. 📉
Now , let's dive into the educational section,
🧠 The Illusion of Safety: Silent Capital Killers
The biggest risk in trading is when things “seem fine.” A quiet chart is often the calm before the liquidation storm. Don't get cozy.
📍 TradingView Tools That Could Save You 🛠️
When the market feels safe, that’s exactly when danger starts brewing.
This is where TradingView’s tools come into play as your best defense.
First up: Volume Profile V isible Range. It reveals exactly where big players entered and where liquidity is building up.
Right near these zones, you’ll often find fake breakouts and whale traps.
Next: Fixed Range Volume Profile — great for identifying volume clusters within specific price ranges. If volatility shrinks while nearing a high-volume zone, get ready: a shakeout may be coming.
Don't just use price alerts. Go deeper — set alerts for EMA crossovers, sudden RSI shifts, or breaks through low-volume areas . That’s where silent moves become violent moves.
One underrated gem: Long/Short Position Tool . Use it to simulate your liquidation points before you open a trade. It’s like pre-visualizing your own death — so you can avoid it.
These tools aren’t just fancy widgets. They’re how you read the silent signals of the market before it slaps.
🐍 Whales Hunt Your Comfort Zone
The market doesn’t wait for you to be ready. Whales wait until you feel safe. Then they hit, wiping retail traders to create room for entry.
🚩 Trades Without a Plan Are Liquidation Invitations
Opening a position without mapping your liquidation zone? That’s like flying blind into a hurricane. Always have Plan A — and a backup Plan B.
🔍 Quiet Crashes Begin With Fake Breakouts
The market won’t warn you. It teases with one green candle, maybe a soft pump... and then drops like a rock. That’s the trick.
🧮 Moving Averages: When Smooth Means Scary
When EMA 21 and 55 flatten out too much, it’s not peace — it’s buildup. Flat EMAs = warning. Don’t be fooled by “smooth” charts.
⚠️ Liquidation Data = Psychological Red Flag
Liquidation spikes on sites like Coinglass aren’t just stats — they’re signs of herd slaughter. Use them as sentiment analysis. It's not just what got liquidated — it's who and why.
🧪 Post-Liquidation Analysis: Recovery or Spiral?
After liquidation, many rush to “make it back.” That's when more destruction happens. You need a post-liquidation plan, not just a pre-trade strategy.
🔐 The Best Trades Are Sometimes Early Exits
Exiting a trade that looks “fine” is a pro move. When everything feels stable, the market may be prepping to flip the table.
🧊 Cold-Minded Trading Saves Accounts
Pros stay ready during calm markets. Amateurs dive in when it’s “finally safe.” That mindset difference defines survival.
🧭 Final Takeaway
If there’s one thing to remember from this analysis, it’s this:
Never trust the market. Trust your tools. Trust your strategy.
The market is never safe — it only pretends to be.
✨ Need a little love!
We put so much love and time into bringing you useful content & your support truly keeps us going. don’t be shy—drop a comment below. We’d love to hear from you! 💛
Big thanks,
Mad Whale 🐋
📜Please remember to do your own research before making any investment decisions. Also, don’t forget to check the disclaimer at the bottom of each post for more details.

DOGE | BULLISH Pattern | +100%DOGE is seemingly ready for more upside as we start to see a pattern resembling an inverse head and shoulders pattern:
✅Usually, the Inverse H&S plays out something like this:
📢But the pattern is not quite confirmed just yet. We'd need to see a close ABOVE the current resistance zone to validate the pattern:
If we can see that, it's likely that there can be BIG gains on DOGE. It will especially help if ETH makes more increases, showing that the general alt market is heading in the right direction.
____________________
BINANCE:DOGEUSDT

Doge(based on NEowave)like ETH wave E is ending and soon it will start a huge bullish wave.
wave E look likes a bow-tie diametrical and wave g is at the end which is the last chance to buy.

#DOGE/USDT#DOGE
The price is moving within a descending channel on the 1-hour frame and is expected to break and continue upward.
We have a trend to stabilize above the 100 moving average once again.
We have a downtrend on the RSI indicator, which supports the upward move by breaking it upward.
We have a support area at the lower limit of the channel at 0.1800, acting as strong support from which the price can rebound.
Entry price: 0.1838
First target: 0.1886
Second target: 0.1928
Third target: 0.1972

I positioned here — while others waited for confirmation.This was a textbook setup. Clean structure, high-probability narrative, and the kind of zone that doesn’t ask for your belief — it commands it.
Breakdown:
Price delivered a sharp move into a 1H OB confluence with an untouched 60min FVG sitting just below. That OB wasn’t noise — it was a true origin point, the last down candle before a major rally.
As price retraced, it swept short-term liquidity and tapped into that OB with precision. I watched volume spike on the drop — not retail fear, but Smart Money engineering the entry.
The 0.1795 zone wasn’t random. It was deliberate. A key equilibrium between displacement and rebalancing. And if this holds, the next logical draw is above 0.1860 — into the unmitigated FVG and resting buy-side liquidity.
Expectation:
From this 1H OB / FVG stack, I’m looking for:
Entry: ~0.1795
SL: Just under the 1.0 fib — under 0.1777
TP1: Mid FVG at 0.1831 (0.5)
TP2: Full inefficiency fill at 0.1887
I’m not forcing anything. If the market wants lower, there’s another FVG just below to absorb it — but structure still favors premium re-pricing.
Final note:
I don’t chase breakouts. I trap Smart Money setups, wait in silence — and strike when the chart gives me the story.
“The market doesn’t move by chance. It moves by design. And I design my trades the same way.”

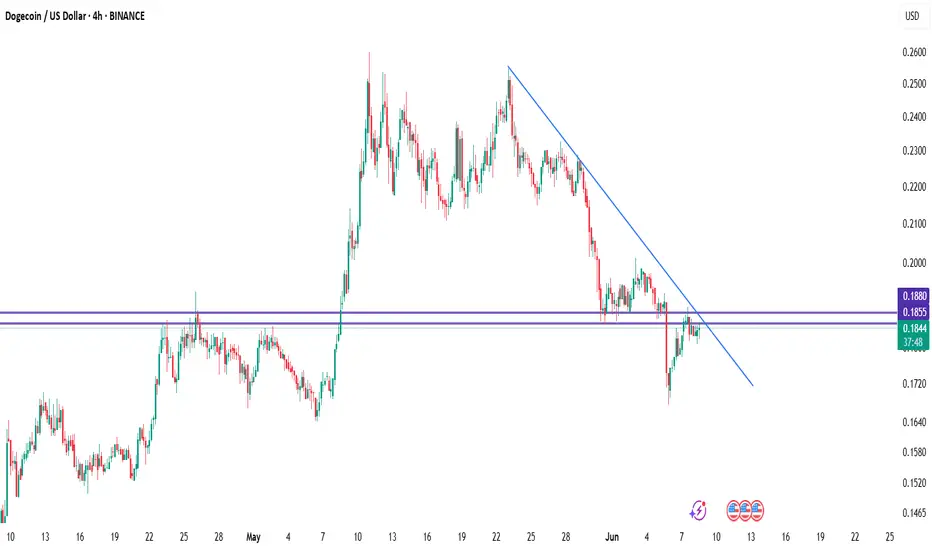
DogeusdtDOGE/USDT – 4H Chart Analysis
Dogecoin is currently testing a key resistance zone between $0.1855 and $0.1880, which aligns with the descending trendline from the May highs. Price action is showing early signs of bullish momentum, but a confirmed breakout above $0.1880 is needed to shift the market structure.
🔹 Bullish Scenario:
If DOGE breaks and closes above $0.1880 with volume, it could trigger a trend reversal. Immediate targets would be:
$0.1980
$0.2100
🔹 Bearish Scenario:
Failure to break resistance and a drop below $0.1810 would likely lead to further downside toward:
$0.1760
$0.1640
DOGE Short Setup in Play—Targeting $0.13258 and $0.08840The broader price structure of DOGEUSDT continues to reflect a clear downtrend, with price consistently printing lower highs and lower lows. This trend is well-respected, as shown by the descending blue trendline, which has acted as dynamic resistance since early 2025.
In late April to early May, DOGE saw a sharp rally, briefly breaking above the trendline. However, this move turned out to be a false breakout against the trend, highlighted on the chart with a label and visual marker. The breakout failed to sustain above resistance and quickly reversed, trapping bullish traders and reaffirming the bearish dominance. This type of price action often signals a bull trap, and in this case, the reversal was swift and aggressive.
The price has since declined and is currently trading around the $0.18258 region, hovering just below the local resistance and just above the initial support levels.
Key Levels Observed on the Chart
• Stop-Loss / Resistance Zone:
The red resistance area around $0.20930–$0.22643 marks a critical stop-loss zone for any short positions. This is the top boundary where the false breakout failed and where sellers previously regained control.
• Entry / Decision Zone:
Price is currently within a small neutral box (shown in light blue), indicating a potential short entry zone as price consolidates below resistance.
• Key Support Level 1 / Take Profit 1:
$0.13258 – This level has been labeled as the first major support and serves as the initial take-profit zone for short setups. Historically, this zone has held price during strong down moves, and it aligns well with past structure.
• Key Support Level 2 / Take Profit 2:
$0.08840 – The second support level is marked as a deeper profit target for continuation of the downtrend. This level is closer to multi-month lows and reflects potential bearish extension.
• Final Support Base:
$0.05000 – This level is the lowest green horizontal line on the chart, showing long-term structural support. If macro conditions worsen, this remains a plausible downside target.
Detrended Price Oscillator (DPO) Indicator
The DPO reading remains below zero at approximately –0.04, reinforcing the bearish momentum. The indicator does not show any bullish divergence, suggesting that there’s currently no sign of an upward reversal forming. The gradual downward slope of the DPO supports the probability of a continuation move to the downside.
Trade Setup (Short Bias)
• Entry Zone: $0.18258 – $0.18546 (current price range just under resistance)
• Stop-Loss: $0.20930 (above key resistance where breakout failed)
• Take Profit 1: $0.13258
• Take Profit 2: $0.08840
• Extended Bearish Target: $0.05000
Conclusion
DOGEUSDT continues to respect its long-term bearish structure, and the recent false breakout further validates the dominance of sellers. The failed attempt to reverse the trend above $0.20930 provides a well-defined stop for short setups, while the clean stair-step structure of support levels offers logical take-profit zones.
Unless DOGE manages to close above the $0.20930–$0.22643 resistance band with strong follow-through, the current bias remains bearish. Traders can monitor for short opportunities while protecting capital above the invalidation zone.

DOGEUSDT 1D Analysis DOGE ~ 1D Analysis
#DOGE Buy back gradually from here with a short term target of at least 15%+ from here.

DOGEUSDT 0.2550 TPWe are seeing a price rebound from strong support around the ~0.1900 level, which may signal the end of the correction. A potential double bottom formation is forming, which often indicates a trend reversal to the upside.
Additional arguments:
The WT_LB oscillator shows an oversold zone and initial upward curvature of signal lines – a typical buy signal.
After a strong downtrend, a consolidation phase has occurred, likely acting as an accumulation zone before a potential move upward.
The risk-to-reward ratio (R/R) is very favorable (around 1:5), supporting a long entry at the current market structure.
📌Technical signals and a strong R/R ratio support a bullish scenario, with a target around 0.252 and a stop-loss set near 0.185.

They see relief. I see rebalancing.BINANCE:DOGEUSDT.P isn't bullish — it's rebalancing. What we’re witnessing now is price doing what it always does after manipulation: return to efficiency before delivering its next displacement.
Here’s the setup:
Price tapped into the 4H discount zone — a structural STB
We’re now reacting from the 0.618 (0.1940) and pushing up toward the 4H OB at 0.20403
That OB is perfectly nested just above the 0.5 fib (0.20190), and below the 0.382 (0.20970) — prime for internal liquidity collection
If price fails to break structure above that 4H OB, the move is complete. This isn’t bullish continuation — it’s cleanup. From there, I’m watching closely for signs of rejection and displacement back toward the OB + BTS zone near 0.16884.
This is where real risk is priced in — and where Smart Money actually loads up.
Execution mindset:
Let price reach into 0.204–0.209
Watch for rejection — that’s the trigger
Downside target: 0.18299 → 0.16884
If we impulsively break 0.2097 and reclaim it, the bearish thesis is invalidated and I’ll re-evaluate
This isn’t trading a bounce. It’s reading the cleanup.
You want real entries, real invalidations, real structure? Check the profile description. The trades speak louder than the noise.

How to Spot the Perfect Dogecoin Buy Signal!Dogecoin (DOGE) is showing another major bullish signal!
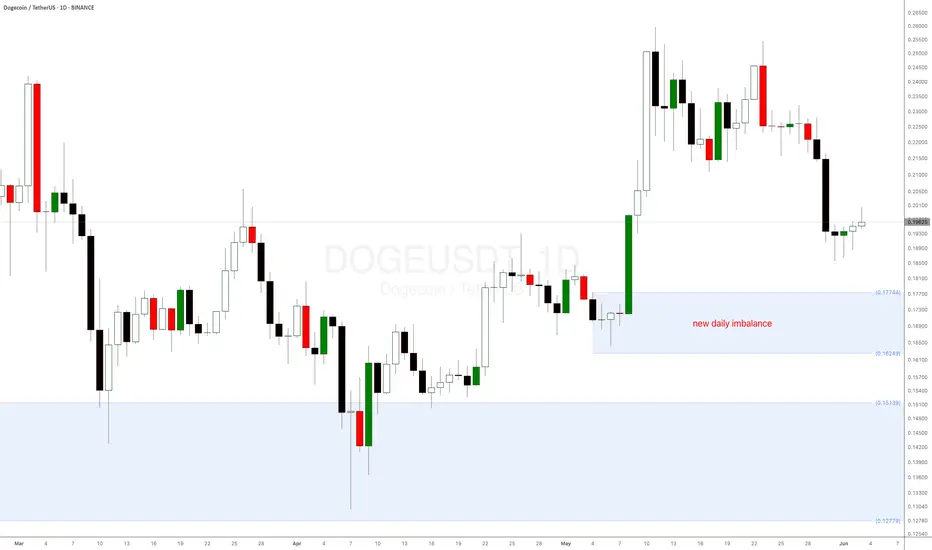
After bouncing from the key weekly demand level at $0.151 mentioned in a previous supply and demand crypto analysis, DOGE coin is now approaching a new daily demand imbalance at $0.18035—a level where buyers have historically stepped in aggressively.
Why This Matters:
Strong Reaction Expected: Similar imbalances on other altcoins have led to sharp upward moves.
Long-term weekly imbalance: The weekly demand level is playing out very well.
Dogecoin (DOGE), the world’s favourite meme cryptocurrency, is trying to reach a critical weekly demand level at $0.151—its strongest daily demand zone in a long time! This presents a prime buying opportunity, especially for crypto beginners looking to enter the market.
Check the previous DOGE analysis from a few weeks ago.