MUCH Doge Less WOWSame pattern, a trap and all falls ,, doooowwn! I try to speak less doodle speaks more
Dogeusdtanalysis

DOGE/USD – Supply Zone Rejection in Play! Is a Pullback ImminentDogecoin just tapped into a strong supply zone between $0.16624 – $0.16800 and showed immediate signs of rejection. Price action is slowing, and early sellers are stepping in—this could be the beginning of a short-term pullback.
---
Key Levels to Watch:
Resistance (Supply): $0.16624 – $0.16800
Support 1: $0.16227
Support 2: $0.15740
Demand Zone: $0.15600–$0.15750
---
Bearish Setup Alert:
Clean test of supply with rejection candle
Short-term bearish structure forming
Volume fading near the top—indicates buyer exhaustion
Next potential drop targets are $0.162 and $0.157
---
Scalper’s Setup:
Short Entry: Near $0.16650–$0.16750
TP1: $0.162
TP2: $0.15750
SL: Above $0.16850
Risk/Reward: 1:2+
---
What's Your Take?
Do you expect a bounce from support or deeper retracement to the demand zone?
Drop your thoughts below & like if you caught this move early!
#DOGE #Dogecoin #CryptoAnalysis #LuxAlgo #TechnicalAnalysis #Scalping #DayTrading #SupplyAndDemand #TradingView

Is DOGE About to Crash Hard From This Trap Zone? Read Before LONYello Paradisers — could this be the perfect bull trap setting up before a bigger drop? Our previous analyses warned about these kinds of setups, and once again, DOGEUSDT is flashing multiple signals that suggest a high-probability reversal could be just around the corner.
💎Currently, DOGEUSDT is trading right inside the golden Fibonacci retracement zone, a level that often acts as a powerful area of rejection. What makes this zone even more significant is the confluence of additional bearish indicators aligning at the same point. Both the 100 and 200 EMAs are present, reinforcing dynamic resistance, and there are clear Fair Value Gaps (FVGs) visible on both the 4H and Daily timeframes. On top of that, a bearish divergence has now formed, signaling early exhaustion in bullish momentum and further reinforcing the potential for a downside move.
💎When these elements align, the probability of a rejection increases substantially. However, we’re not jumping in blindly. If DOGEUSDT starts to bounce from here and shows weakness—such as stalling below resistance—then we’ll be closely watching for confirmation patterns like a double top or a head and shoulders. These would not only validate the bearish narrative but also offer significantly better risk-to-reward ratios for short setups.
💎That said, every setup has its invalidation. If price breaks and closes candle above our invalidation level, then the entire bearish scenario must be considered void. In that case, the best approach would be to stand aside and wait for a cleaner structure to form before taking any action. There’s no reason to force a position in uncertain conditions.
If you want to be consistently profitable, you need to be extremely patient and always wait only for the best, highest probability trading opportunities.
MyCryptoParadise
iFeel the success🌴

Dogecoin Daily Chart Analysis: A Fresh Start Ahead ?Hello friends, let's analyze Dogecoin, a cryptocurrency, from an Elliott Wave perspective. This study uses Elliott Wave theory and structures, involving multiple possibilities. The analysis focuses on one potential scenario and is for educational purposes only, not trading advice.
We're observing the daily chart, and it appears we're nearing the end of Wave II, a correction. The red cycle degree Wave I ended around 2024 December's peak. Currently, we're nearing the end of red Wave II, which consists of black ((W)), ((X)), and ((Y)) waves. Black ((W)) and ((X)) are complete, and black ((Y)) is nearing its end.
Within black ((Y)), we have Intermediate degree blue (W), (X), and (Y) waves. Blue (W) and (X) are complete, and blue (Y) is nearing its end. Inside blue (Y), red A and B are complete, and red C is nearing its end. Once red C completes, blue (Y) will end, Once blue (Y) completes, means black ((W)) will end that means higher degree cycle wave II in red will end.
If our view remains correct, the invalidation level for this Elliott Wave count is 0.04913. If this level holds and doesn't touch below it, we can expect a significant reversal to unfold wave III towards new highs. This is an educational analysis, and I hope you've learned something by observing the chart and its texture.
I am not Sebi registered analyst.
My studies are for educational purpose only.
Please Consult your financial advisor before trading or investing.
I am not responsible for any kinds of your profits and your losses.
Most investors treat trading as a hobby because they have a full-time job doing something else.
However, If you treat trading like a business, it will pay you like a business.
If you treat like a hobby, hobbies don't pay, they cost you...!
Hope this post is helpful to community
Thanks
RK💕
Disclaimer and Risk Warning.
The analysis and discussion provided on in.tradingview.com is intended for educational purposes only and should not be relied upon for trading decisions. RK_Charts is not an investment adviser and the information provided here should not be taken as professional investment advice. Before buying or selling any investments, securities, or precious metals, it is recommended that you conduct your own due diligence. RK_Charts does not share in your profits and will not take responsibility for any losses you may incur. So Please Consult your financial advisor before trading or investing.

"DogeCoin vs Tether" Crypto Market Heist Plan (Swing / Day)🌟Hi! Hola! Ola! Bonjour! Hallo! Marhaba!🌟
Dear Money Makers & Robbers, 🤑 💰💸✈️
Based on 🔥Thief Trading style technical and fundamental analysis🔥, here is our master plan to heist the DOGE/USDT "DogeCoin vs Tether" Crypto Market. Please adhere to the strategy I've outlined in the chart, which emphasizes long entry. Our aim is the high-risk Red Zone. Risky level, overbought market, consolidation, trend reversal, trap at the level where traders and bearish robbers are stronger. 🏆💸"Take profit and treat yourself, traders. You deserve it!💪🏆🎉
Entry 📈 : "The vault is wide open! Swipe the Bullish loot at any price - the heist is on!
however I advise to Place buy limit orders within a 15 or 30 minute timeframe most recent or swing, low or high level. I Highly recommended you to put alert in your chart.
Stop Loss 🛑:
Thief SL placed at the recent/swing low level Using the 2H timeframe (0.16000) Day trade basis.
SL is based on your risk of the trade, lot size and how many multiple orders you have to take.
🏴☠️Target 🎯: 0.22000 (or) Escape Before the Target
🧲Scalpers, take note 👀 : only scalp on the Long side. If you have a lot of money, you can go straight away; if not, you can join swing traders and carry out the robbery plan. Use trailing SL to safeguard your money 💰.
DOGE/USDT "DogeCoin vs Tether" Crypto Market Heist Plan (Swing / Day Trade) is currently experiencing a bullishness,., driven by several key factors.
📰🗞️Get & Read the Fundamental, Macro, COT Report, On Chain Analysis, Sentimental Outlook, Intermarket Analysis, Future trend targets.. go ahead to check 👉👉👉
⚠️Trading Alert : News Releases and Position Management 📰 🗞️ 🚫🚏
As a reminder, news releases can have a significant impact on market prices and volatility. To minimize potential losses and protect your running positions,
we recommend the following:
Avoid taking new trades during news releases
Use trailing stop-loss orders to protect your running positions and lock in profits
💖Supporting our robbery plan 💥Hit the Boost Button💥 will enable us to effortlessly make and steal money 💰💵. Boost the strength of our robbery team. Every day in this market make money with ease by using the Thief Trading Style.🏆💪🤝❤️🎉🚀
I'll see you soon with another heist plan, so stay tuned 🤑🐱👤🤗🤩

DODGE $ Target this month we got a breakout from our bearish channel , which indicate the first sign of reversal from the bottom .


DOGE/USD "The Doge Coin" Crypto Market Heist Plan🌟Hi! Hola! Ola! Bonjour! Hallo! Marhaba!🌟
Dear Money Makers & Thieves, 🤑 💰🐱👤🐱🏍
Based on 🔥Thief Trading style technical and fundamental analysis🔥, here is our master plan to heist the DOGE/USD "The Doge Coin" Crypto Market. Please adhere to the strategy I've outlined in the chart, which emphasizes short entry. Our aim is the high-risk Green Zone. Risky level, oversold market, consolidation, trend reversal, trap at the level where traders and bullish thieves are getting stronger. 🏆💸Book Profits Be wealthy and safe trade.💪🏆🎉
Entry 📈 : "The heist is on! Wait for the breakout (0.18100) then make your move - Bearish profits await!" however I advise placing Sell Stop Orders below the breakout MA.
📌I strongly advise you to set an alert on your chart so you can see when the breakout entry occurs.
Stop Loss 🛑: Thief SL placed at (0.21500) swing Trade Basis Using the 4H period, the recent / swing high or low level.
SL is based on your risk of the trade, lot size and how many multiple orders you have to take.
Target 🎯: 0.14000 (or) Escape Before the Target
🧲Scalpers, take note 👀 : only scalp on the Short side. If you have a lot of money, you can go straight away; if not, you can join swing traders and carry out the robbery plan. Use trailing SL to safeguard your money 💰.
📰🗞️Fundamental, Macro, On Chain Analysis, Sentimental Outlook:
DOGE/USD "The Doge Coin" Crypto Market is currently experiencing a Neutral trend in short term (there is a chance for trend reversal), driven by several key factors.
🟡Fundamental Analysis
- Current Price: $0.20214 (as of March 1, 2025)
- Market Capitalization: $29.97 billion
- Circulating Supply: 148.24 billion DOGE
- Total Supply: 148.25 billion DOGE
🟤Macro Economics
- The global economy is experiencing a slowdown, which may impact cryptocurrency markets.
- Interest rates and inflation rates are being closely watched by investors, as they can impact cryptocurrency prices.
⚪Global Market Analysis
- The cryptocurrency market is experiencing a downturn, with many major cryptocurrencies experiencing significant losses.
- The global market is experiencing a high level of volatility, making it challenging to predict future price movements.
🟠On-Chain Analysis
- Transaction Volume: The transaction volume for DOGE has been relatively stable over the past few weeks.
- Active Addresses: The number of active addresses on the Dogecoin network has been increasing steadily.
🔴Market Sentimental Analysis
- Fear and Greed Index: The Fear and Greed Index is currently indicating a neutral sentiment.
- Social Media Sentiment: Social media sentiment for DOGE is currently mixed, with some investors expressing optimism while others are expressing pessimism.
🟣Positioning
- Long/Short Ratio: The long/short ratio for DOGE is currently skewed towards long positions.
- Open Interest: Open interest for DOGE futures is currently relatively high.
🟢Next Trend Move
- Based on the current market data, it's difficult to predict the next trend move for DOGE/USD. However, some analysts are predicting a potential bullish reversal in the near future.
🔵Overall Summary Outlook
- The current market outlook for DOGE/USD is neutral, with some analysts predicting a potential bullish reversal in the near future.
- However, the global market is experiencing a high level of volatility, making it challenging to predict future price movements.
📌Keep in mind that these factors can change rapidly, and it's essential to stay up-to-date with market developments and adjust your analysis accordingly.
⚠️Trading Alert : News Releases and Position Management 📰 🗞️ 🚫🚏
As a reminder, news releases can have a significant impact on market prices and volatility. To minimize potential losses and protect your running positions,
we recommend the following:
Avoid taking new trades during news releases
Use trailing stop-loss orders to protect your running positions and lock in profits
💖Supporting our robbery plan 💥Hit the Boost Button💥 will enable us to effortlessly make and steal money 💰💵. Boost the strength of our robbery team. Every day in this market make money with ease by using the Thief Trading Style.🏆💪🤝❤️🎉🚀
I'll see you soon with another heist plan, so stay tuned 🤑🐱👤🤗🤩

#DOGEUSDT remains weak📉 SHORT BYBIT:DOGEUSDT.P from $0.23740
🛡 Stop Loss: $0.24040
⏱ 1H Timeframe
✅ Overview:
➡️ BYBIT:DOGEUSDT.P broke support and exited the rising wedge, signaling a bearish trend shift.
➡️ POC (Point of Control) at $0.25386 now acts as key resistance.
➡️ The price dropped sharply with increased volume, confirming strong selling pressure.
➡️ Liquidity has shifted lower, increasing the probability of continued downside movement.
⚡ Plan:
➡️ Enter short at $0.23740 after confirming downward momentum.
➡️ Stop-Loss set at $0.24040, above the nearest resistance level.
🎯 TP Targets:
💎 TP1: $0.23410
🔥 TP2: $0.23155
🚀 BYBIT:DOGEUSDT.P remains weak — expecting further decline toward key targets!

DOGEUSDT 4DDOGE ~ 4D Analysis
#DOGE Time frime 4D forms a bullish flag pattern. Buy gradually from this support block with a minimum target of 20%+.

Doge / USDT : retesting after breakout - Next big move ?DOGE/USDT: Retesting After Breakout – Next Big Move?
DOGE/USDT is at a crucial juncture 📈 as it successfully broke above key resistance and is now retesting the breakout zone 📊. This retest is a critical phase that could confirm the continuation of a strong bullish trend 🚀. If support holds, we may see another leg up soon. Keep a close eye 👀 on price action and volume for confirmation.
Key Insights:
1️⃣ Breakout & Retest: DOGE/USDT has cleared a significant resistance level and is now testing it as support. Holding above this zone could signal a strong bullish continuation.
2️⃣ Volume Confirmation: Watch for a surge in buying volume on the retest to confirm that bulls are stepping in 🔥.
3️⃣ Momentum Indicators: RSI and MACD are still trending positively ⚡, reinforcing the potential for further upside.
How to Confirm the Retest Success:
✅ Price holds above the previous resistance and establishes it as new support.
✅ A strong bounce from the retest zone with increasing volume confirms buying interest 📊.
✅ A bullish 4H or daily candle formation signals trend continuation 📍.
⚠️ Be cautious of failed retests that could lead to a deeper pullback or fakeouts.
Risk Management Strategies:
🔒 Use stop-loss orders to protect against unexpected reversals.
🎯 Manage position sizing to align with your risk tolerance and trading plan.
This analysis is for educational purposes only and not financial advice. Always DYOR before making any trading decisions 🔍.

DOGE/USD "Dogecoin vs US Dollar" Altcoin Market Heist Plan🌟Hi! Hola! Ola! Bonjour! Hallo!🌟
Dear Money Makers & Thieves, 🤑 💰🐱👤
Based on 🔥Thief Trading style technical and fundamental analysis🔥, here is our master plan to heist the DOGE/USD "Dogecoin vs US Dollar" Altcoin market. Please adhere to the strategy I've outlined in the chart, which emphasizes long entry. Our aim is the high-risk Red Zone. Risky level, overbought market, consolidation, trend reversal, trap at the level where traders and bearish robbers are stronger. 🏆💸Be wealthy and safe trade.💪🏆🎉
Entry 📈 : "The heist is on! Wait for the breakout (0.30000) then make your move - Bullish profits await!"
however I advise placing Buy Stop Orders above the breakout MA or Place Buy limit orders within a 15 or 30 minute timeframe. Entry from the most recent or closest low or high level should be in retest.
Stop Loss 🛑:
Thief SL placed at the recent / nearest low level Using the 4H timeframe (0.27000) swing trade basis.
SL is based on your risk of the trade, lot size and how many multiple orders you have to take.
Target 🎯:
1st Target - 0.36500 (or) Escape Before the Target
Final Target - 0.44000 (or) Escape Before the Target
Scalpers, take note 👀 : only scalp on the Long side. If you have a lot of money, you can go straight away; if not, you can join swing traders and carry out the robbery plan. Use trailing SL to safeguard your money 💰.
📰🗞️Fundamental, Macro, COT, Sentimental Outlook:
DOGE/USD "Dogecoin vs US Dollar" Altcoin market is currently experiencing a bullish trend,., driven by several key factors.
🎈 Fundamental Analysis: Bullish
- The fundamental analysis of DOGE/USD suggests a bullish trend.
- This means that the underlying factors that affect the price of Dogecoin, such as its blockchain technology, adoption rate, and community support, are all indicating a potential increase in price.
🎈 Macro Economics: Uncertain
- The macroeconomic outlook for DOGE/USD is uncertain.
- This means that global economic factors, such as inflation rates, interest rates, and geopolitical events, are not clearly indicating a bullish or bearish trend for Dogecoin.
🎈 COT Report: Not Available
- The Commitment of Traders (COT) report is not available for DOGE/USD.
- The COT report provides insights into the positions held by institutional traders, such as hedge funds and banks, and can be a useful tool for analyzing market sentiment.
🎈 Sentimental Market Analysis: Bullish
- The sentimental market analysis of DOGE/USD suggests a bullish trend.
- This means that the overall market sentiment, as indicated by factors such as social media sentiment, online searches, and trader surveys, is positive and indicating a potential increase in price.
🎈 Positioning: Institutional Traders Holding Long Positions
- Institutional traders, such as hedge funds and banks, are holding long positions in DOGE/USD.
- This means that these traders are betting on an increase in the price of Dogecoin and are holding positions that will benefit from a price increase.
🎈Overall Outlook: Bullish in the Short Term
- The overall outlook for DOGE/USD is bullish in the short term.
- This means that, based on the analysis of the above data points, the price of Dogecoin is expected to increase in the short term (next 30 days).
⚠️Trading Alert : News Releases and Position Management 📰 🗞️ 🚫🚏
As a reminder, news releases can have a significant impact on market prices and volatility. To minimize potential losses and protect your running positions,
we recommend the following:
Avoid taking new trades during news releases
Use trailing stop-loss orders to protect your running positions and lock in profits
📌Please note that this is a general analysis and not personalized investment advice. It's essential to consider your own risk tolerance and market analysis before making any investment decisions.
📌Keep in mind that these factors can change rapidly, and it's essential to stay up-to-date with market developments and adjust your analysis accordingly.
💖Supporting our robbery plan will enable us to effortlessly make and steal money 💰💵 Tell your friends, Colleagues and family to follow, like, and share. Boost the strength of our robbery team. Every day in this market make money with ease by using the Thief Trading Style.🏆💪🤝❤️🎉🚀
I'll see you soon with another heist plan, so stay tuned 🤑🐱👤🤗🤩

DOGE About to Explode or Another Trap?Yello, Paradisers! Is DOGEUSDT finally gearing up for a breakout, or is this just another fakeout before a deeper drop? Let’s break it down.
💎DOGEUSDT is currently forming a descending channel pattern, and things are starting to look interesting. The price has printed a bullish engulfing candle right on the supportive trendline, backed by bullish divergence and a key support zone—all strong signals that a bullish move could be on the horizon.
💎If we see further panic selling or a deeper retracement, DOGEUSDT is likely to bounce from the strong support zone. However, for confirmation, we need to see a bullish I-CHoCH, a W pattern, or an inverse head & shoulders forming on the lower timeframes before considering a bullish move.
💎On the flip side, if DOGEUSDT closes a candle below the strong support zone, our bullish outlook gets invalidated. In that case, it’s best to step back and wait for better price action to develop rather than forcing a trade.
🎖 The key to long-term profitability is patience and discipline. Don’t rush—wait for high-probability setups and stick to solid trading strategies. Trade smart, Paradisers!
MyCryptoParadise
iFeel the success🌴

Dogecoin at Key Support: Trend Analysis & Next Moves for DOGE👀 👉 In this video, we dive deep into Dogecoin (DOGE) paired with USDT, examining its trend, market structure, price action, key support and resistance levels, and the impact of liquidity on the markets. At the moment, DOGE is trading near a critical support level. With the bearish break in market structure, we explore potential ways to engage if the downtrend persists. Everything is covered in detail here. Please note, this is not financial advice.

Dogeusdt BullishDogecoin bullish outloock, we can identify strong bullish entry at 0.3180 level. If price breaks this zone than bears target will be 0.24 zone but hope this doesn't happen.

DOGE Analysis: Unpacking Liquidity & the Battle at Support👀 👉 In this video, we take an in-depth look at Dogecoin (DOGE) paired with USDT. We analyze the trend, market structure, price action, key support and resistance levels, and the role liquidity plays in the markets. Currently, DOGE is trading at a significant support level. On the daily timeframe, there's a case for higher highs and higher lows, while the weekly chart shows bearish pressure over the past week. The big question is: where does it go next? We unpack it all in this video. This is not financial advice.

DOGEUSDT 1DDOGE ~ 1D
#DOGE Buy gradually inside this bullish pattern,. it is only a matter of time that this resistance line is successfully broken. minimum target 15%++

DOGE Update - Market Structure, Key Levels & Trade Opportunities👀 👉 In this video, we analyze DOGE's recent market structure break, driven by strong momentum that hints at institutional interest. 📊 Discover crucial support and resistance zones, identify liquidity areas, and explore potential trade setups based on our findings. Whether you're a seasoned trader or just getting started, this analysis provides valuable insights to enhance your trading decisions. ⚠️ This content is for educational purposes only and does not constitute financial advice.

DOGE Rally: Key Levels, Liquidity Zones & Trade Opportunities👀💡 In this video, we take an in-depth look at DOGE. The analysis reveals that DOGE has broken market structure with significant momentum, suggesting strong institutional interest. We explore key support and resistance levels, identify areas of liquidity, and discuss potential trade opportunities. As always, this content is for educational purposes only and should not be considered financial advice. 🚀

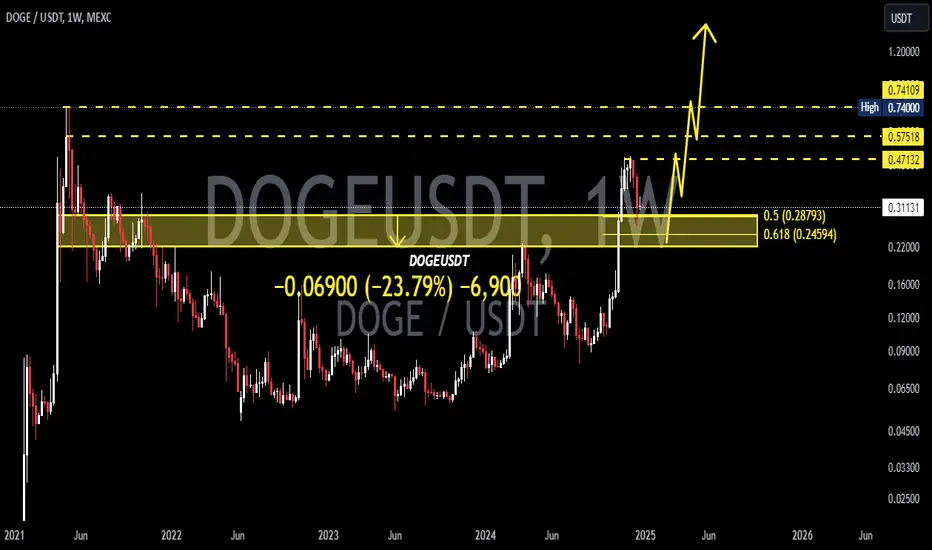
DOGEUSDT 1WDOGE Update ~ 1W
#DOGE So far it still maintains its Bullish structure,. This is wave 2 of the Eliot Wave pattern. Buy gradually within this support block with a minimum target of 20+
Dogecoin UpdateDogecoin is forming a descending channel nut still isn't a valid channel still waiting for the 3rd touch to form
what do you think this pair will form the 3rd touch and then give us a Double Bottom so we can be searching for a long to target a new High???
Share your thoughts with us
Follow us for more


Doge idea!"🌟 Welcome to Golden Candle! 🌟
We're a team of 📈 passionate traders 📉 who love sharing our 🔍 technical analysis insights 🔎 with the TradingView community. 🌎
Our goal is to provide 💡 valuable perspectives 💡 on market trends and patterns, but 🚫 please note that our analyses are not intended as buy or sell recommendations. 🚫
Instead, they reflect our own 💭 personal attitudes and thoughts. 💭
Follow along and 📚 learn 📚 from our analyses! 📊💡"
