DOGEUSD Long buy!DOGEUSD retested horizontal support
Then it broke the descending resistance at 1.22800
So now I think it will go up
To re-test the resistance above 0.17000
Dogeusdtanalysis

short position ; DOGEUSDTnow price ; 0.14220
EN: .13889-0.14200
TP1: 0.13848 (risk -low)
TP2:0.13752 (risk- low)
TP3:0.13617 (risk- high)
TP4:0.13485 (risk- high)
TP5:0.12861 (risk-very high)
TP6:0.11574 (risk-very high)
SL: 0.14515
Leverage: 3x cross
Deposit: 8-12%

DOGEUSDT UP Trend.1 #DOGEUSDT Looking for Buy trade setup as I mentioned in the Chart.!
Keep Supporting LIKE, COMMENT And FOLLOW.!
ThankYou.!

IM NOT A BIG FAN OF DOGE, SHORT? MAYBEI hope no one is offended, apart from the joke, Honestly DOGE is not one of my favorites,
so, there is an indication that in the near future there will be a spike in price increases on the DOGEUSDT coin. But, it is likely to retest area $0.16 - $0.18 area. If you ask me when close., $0.1 - $0.09. Lev: 5x
Any further detailed information leave it in a comment or send your message to my inbox

DOGEUSDT 1D: Possible LONGDOGEUSDT 1D: Possible LONG
On the daily chart, the price has already bounced several times from the 0.1500 level, which indicates a possible further increase to the 0.7500 level.

Take out the Dog- Lets see if TheDog can break is Downtrend. this bullrun was very bad for hodlers.
- i have some Doge but i just play with it as trader, i am not a fan of Elon, nor Vitalik ( "Genius" Should care "ETH Fees" before start to be interested in another project )
- That's the magic of Trading, buy Before others, sell before others. Wait and Repeat, never fomo.
------------------------------------------------------------------------------------------------
Trading Parts :
------------------------------------------------------------------------------------------------
Buy Zones :
- Now 0.22 ish ( a bit )
- Buy More ( around 0.25+ after a breakout )
- Rebuy Zone : 0.165 ( Full Buy )
------------------------------------------------------------------------------------------------
Tp1 : 0.295 ( Security TP)
Tp2 : 0.349
Tp3 : 0.449
------------------------------------------------------------------------------------------------
STOP : 0.149
------------------------------------------------------------------------------------------------
Don't be tricked by any projects and play like a robot !
Happy Tr4Ding !

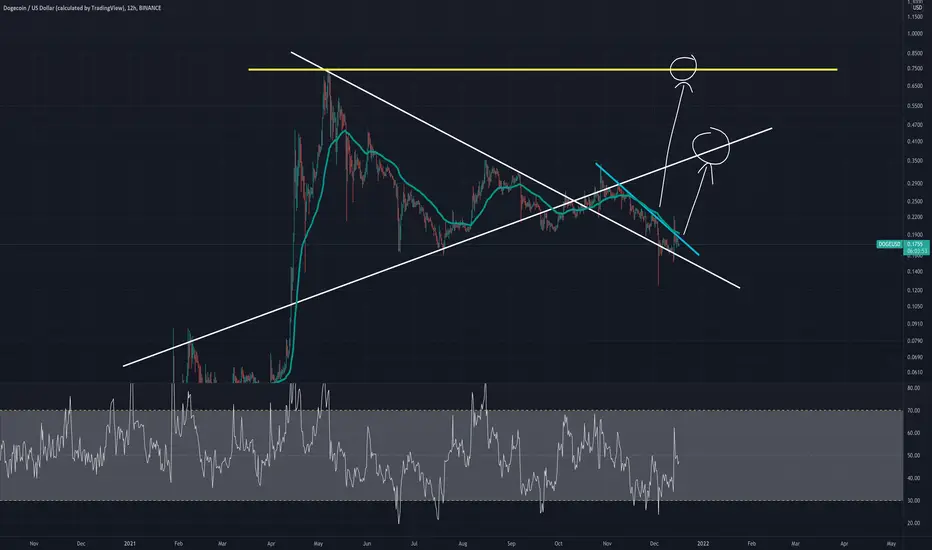
Dogecoin - Bullish For December & JanuaryThe two white lines have been acting as resistance and support at different times. The key price targets will be the upward trending white line (which has been acting as resistance in the short term) and the yellow line (the previous all time high for DOGE).
DOGE Is ready to take off BINANCE:DOGEUSDT
Since top in May this Fib is still relevant
We once again touch green line, fundamental price, every time when we touch or going under this line its a best time to buy coin
Last time in July we made a pump 117% when we bounced from fundamental price line
We several times got reject on downtrend line FIB so it means in next upside move we can see the break out with retest above.
Elon Musk yesterday post I think preparing us to big potential speculative move in DOGE price soon, so whales who accumulate Doge coins more than 177 days at the bottom can take a profits around 0.43/ 0.60 and 1.11$ price targets.
Follow the smart money.
on RSI Doge lay down at the bottom and on mood on the market we are in blue zone so every time this signal Show to us the best enter price for alt coin.
Hope you enjoyed the content I created, You can support with your likes and comments this idea so more people can watch!
✅ Disclaimer: Please be aware of the risks involved in trading. This idea was made for educational purposes only not for financial Investment Purposes.
✅ Don't forget sub and join my channels under this idea!

$DOGEUSDT #DOGE #DOGECOIN PT 49-69 and higher 💫💕🕊️ Dogecoin Price & Market Data
Dogecoin price today is $0.182072 with a 24-hour trading volume of $6,001,773,329. DOGE price is up 15.6% in the last 24 hours. It has a circulating supply of 130 Billion DOGE coins and a total supply of ∞. If you are looking to buy or sell Dogecoin, Binance is currently the most active exchange.
Dogecoin is a cryptocurrency that was created on December 6th, 2013 based on the popular "Doge" Internet meme and features a Shiba Inu on its logo.
The codebase of the project was a fork of Litecoin, in which most of the same features such hash hashing algorithm were inherited, with the only difference of branding and large inflationary supply.
Introduced as a "joke currency", Dogecoin quickly developed its own online community and reached a capitalization of US$60 million in January 2014. Compared with other cryptocurrencies, Dogecoin had a fast initial coin production schedule: 100 billion coins were in circulation by mid-2015, with an additional 5.256 billion coins every year thereafter. As of 30 June 2015, the 100 billionth Dogecoin had been mined.
Dogecoin was created by Billy Markus from Portland, Oregon and Jackson Palmer from Sydney, Australia. Both wanted to create a fun cryptocurrency that will appeal beyond the core Bitcoin audience. Dogecoin is primarily used as a tipping system on Reddit and Twitter where users tip each other for creating or sharing good content. The community is very active in organising fundraising activities for deserving causes.
The developers of Dogecoin haven’t made any major changes to the coin since 2015. This means that Dogecoin could get left behind and is why Shibas are leaving Dogecoin to join more advanced platforms like Ethereum. One of Dogecoin strengths is its relaxed and fun-loving community. However, this is also a weakness because other currencies are way more professional.
Dogecoin in 2021
Fast forward today in 2021, Dogecoin has grown so much and have gathered the mainstream attention. It has become a meme that is used by the likes of Tesla billionaire, Elon Musk and even more so spunned off even more meme coins into the market.
On May 8th, 2021 the cryptocurrency recorded an all-time-high market cap of nearly $90 billion and trading at a price of $0.70 per DOGE. That is nearly +141,000% increase since its inception in 2013.
Dogecoin followers have always been asking if Dogecoin would ever reach $1. It is hard to say where the price action will go, but high volatility seem to be mainstay as the utility of the cryptocurrency remains unclear being a meme coin.
Where to buy Dogecoin?
You may buy Dogecoin on centralized exchanges such as Binance, Crypto.com, Coinbase, Bitfinex, and more.

DOGECOIN IS ON THE LAST SUPPORT AREA.Dogecoin is on the last support area. We will see if the price will make reversal or will be more bearish.
I am still optimistic cause this is the last support area and previously price always reversal there.
Note: Only take position after confirmation and do your own research before take position.


DOGEUSDT , Impact to PRZHelloo everybody
According to the chart you can see the price was impacted to the PRZ and we expect the price can rise and go up to reach to the target
But the important thing is if the price can consolidation above of the support we expect the movement of price
And if another dump will happen, the other zone that support the price was shown on chart
Previous analysis :
If you have any question just ask us and send us messages
Good Luck
Abtin

DOGEUSDT AnalysisHello friends.
Please support my work by clicking the LIKE button(If you liked).Thank you!
Everything on the chart.
open pos: market and lower
target: 0.32 - 0.4 - 0.45
after first target reached move ur stop to breakeven
stop: ~0.18(depending of ur risk). ALWAYS follow ur RM .
risk/reward 1 to 5
risk is justified
Good luck everyone!
Follow me on TRADINGView, if you don't want to miss my next analysis or signals.
It's not financial advice.
Dont Forget, always make your own research before to trade my ideas!
Open to your questions or suggestions.

dogeusdt👑 ̲#F̲X̲o̲n̲e̲4̲a̲l̲l̲ 👑 VIP 🚀🚀
🟢 #DOGE - USDT 🔚BINANCE
💰 Buy now : 0.21
🔸TARGET 🎯
🔹 0.425
🔹0.53
🔹0.77
📝 RATIO: 10% Risk

DOGEUSDT , Its time to buyHello everybody
From a long time ago when we made breakwave the price only was in correction wave until the price cae to support zone that the begining of the breakwave and after that the price was supported and now we are in buy zone area because of the momentum of the wave , and we expect the price go up and reach to the resistance trendline zone and then it can be ready to break the trend line and reach to the new target
Dont forget use stop loss and attention to the money management
Good Luck
Abtin

DOGEUSDT , Do you think it can be cup & handle or not ???Hello everyone
What s up guys ?
Today we analysied one of the most popular coin in crypto society
After the price was supported in sensitive zone the price is making a pattern like cup and handle but in crypto market and with psychological view the market failed the pattern and with trend view of the movement we should go up until the second target but we should attention to money management and risk free our position in 1st target .
Doge jumped with news and tweet of Elon
PLEASE PLEASE PLEASE attention to money management and risk free your position
Good Luck
Abtin

DOGE/USDT 4HOUR UPDATEWelcome to this quick
DOGE/usdt analysis.
I have tried my best to bring the best possible outcome me in this chart.
Reason of trade :- doge/usdt triangle pattern
Entry:- cmp And buy the dip in green zone
Traget:- 35% to 40%
Stoploss:- $0.2211
Remember:-This is not a piece of financial advice. All investment made by me is under my own risk and I am held responsible for my own profit and losses. So, do your own research before investing in this trade.
Happy trading.
Sorry for my English it is not my native languages.
Do hit the like button if you like it and share your charts in the comments section.
Thank you...

DOGEUSDT long term outlookDOGEUSDT long term view. Where is DOGEUSDT cheap? it is cheap at the demand zone I have located on a weekly chart much lower. We could easily see a reaction from this area if price reaches there. It is a weekly/monthly demand zone that could easily give a 2:1 trade. It would be best to wait for a 4h shift in momentum if price comes down to that zone, as just buying has greater risk. I am not saying that DOGEUSDT will drop to here, it could make new highs, where I will be on a lower timeframe looking for buys.

DOGEUSDT 1H: Possible LONGDOGEUSDT 1H: Possible LONG
It is possible for the market to rise to the 0.3400 level after a rebound from the 0.2600 level.

DOGEUSDT - Possible scenarios according to the technical levels!DOGEUSDT - Possible scenarios according to the technical levels!!

DOGE LONG PLAYReasoning:
Ascending Pivot Point
MACD looks to want to cross above
Double Bottom forming
POC (point of control aka price where most volume is at) is at neckline of double bottom meaning they are expecting a move upwards
Stop Loss: below pivot level
Goodnight folks,
Stefan

Doge Repeating.Doge seems to be repeating what it did before the first big run up. The chart in blue is the movement of Doge from April in 2021.

#DOGEUSDT Massive Breakout, 245% + Potential Profit Ahead.Welcome to this quick Update, everyone.
If you are reading my updates for the first time do follow me to get more complex charts in a very simplified way.
I also post altcoin setups on Spot, Margin, and Futures.
DOGEUSDT broke out of the triangle pottern after 192 days of sideways accumulation.
Expecting the price to pump soon. You can see those circles I've drawn in which the 21MA breaks above 50D MA has been a good indicator of an upcoming pump in previous rallies.
Best Entry :- $.223 to $.266
Targets:
$.34
$.38
$.44
$.52
$.63
Stop loss:-
$0.18549
What's your thought on this?
Do hit the like button if you want me to post more of these setups and share your views in the comment section.
Thank you
#PEACE
