#DOGS/USDT – Launchpad or Breakdown?#DOGS
The price is moving within an ascending channel on the 1-hour frame, adhering well to it, and is poised to break it strongly upwards and retest it.
We have support from the lower boundary of the ascending channel, at 0.0001300.
We have a downtrend on the RSI indicator that is about to break and retest, supporting the upward trend.
There is a key support area (in green) at 0.0001330, which represents a strong basis for the upward trend.
Don't forget one simple thing: ease and capital.
When you reach the first target, save some money and then change your stop-loss order to an entry order.
For inquiries, please leave a comment.
We have a trend of stability above the moving average of 100.
Entry price: 0.0001424
First target: 0.0001456
Second target: 0.0001515
Third target: 0.0001570
Don't forget one simple thing: ease and capital.
When you reach the first target, save some money and then change your stop-loss order to an entry order.
For inquiries, please leave a comment.
Thank you.
Dogsanalysis

#DOGS/USDT#DOGS
The price is moving within a descending channel on the 1-hour frame, adhering well to it, and is poised to break it strongly upwards and retest it.
We have support from the lower boundary of the descending channel, at 0.0001432.
We have a downtrend on the RSI indicator that is about to break and retest, supporting the upward trend.
There is a key support area in green at 0.0001402, which represents a strong basis for the upward trend.
Don't forget one simple thing: ease and capital.
When you reach the first target, save some money and then change your stop-loss order to an entry order.
For inquiries, please leave a comment.
We have a trend of stability above the Moving Average 100.
Entry price: 0.0001460
First target: 0.0001538
Second target: 0.0001500
Third target: 0.0001581
Don't forget one simple thing: ease and capital.
When you reach the first target, save some money and then change your stop-loss order to an entry order.
For inquiries, please leave a comment.
Thank you.

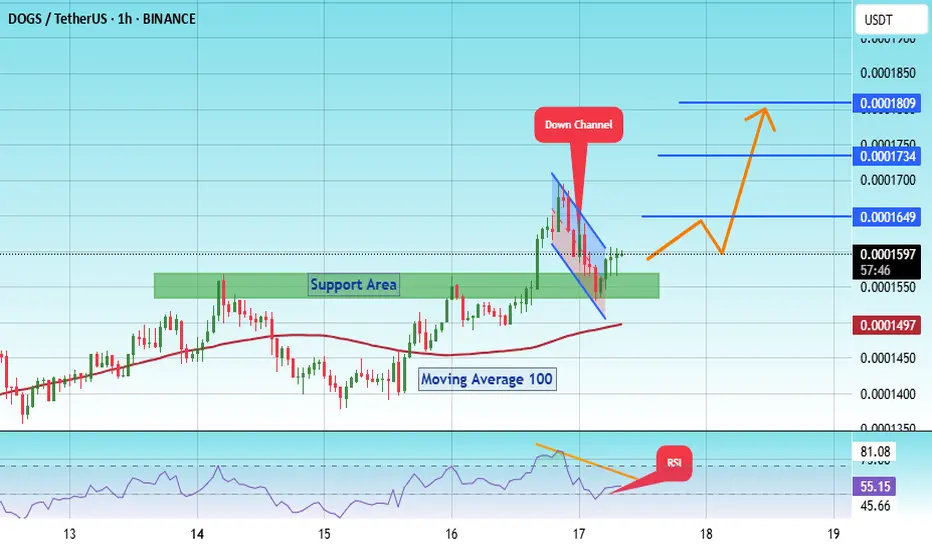
#DOGS/USDT#DOGS
The price is moving within a descending channel on the 1-hour frame, adhering well to it, and is poised to break it strongly upwards and retest it.
We have support from the lower boundary of the descending channel, at 0.0001485.
We have a downtrend on the RSI indicator that is about to break and retest, supporting the upward move.
There is a key support area in green at 0.0001450, which represents a strong basis for the upward move.
Don't forget one simple thing: ease and capital.
When you reach the first target, save some money and then change your stop-loss order to an entry order.
For inquiries, please leave a comment.
We have a trend of stability above the moving average of 100.
Entry price: 0.0001580
First target: 0.0001635
Second target: 0.0001690
Third target: 0.0001755
Don't forget one simple thing: ease and capital.
When you reach the first target, save some money and then change your stop-loss order to an entry order.
For inquiries, please leave a comment.
Thank you.
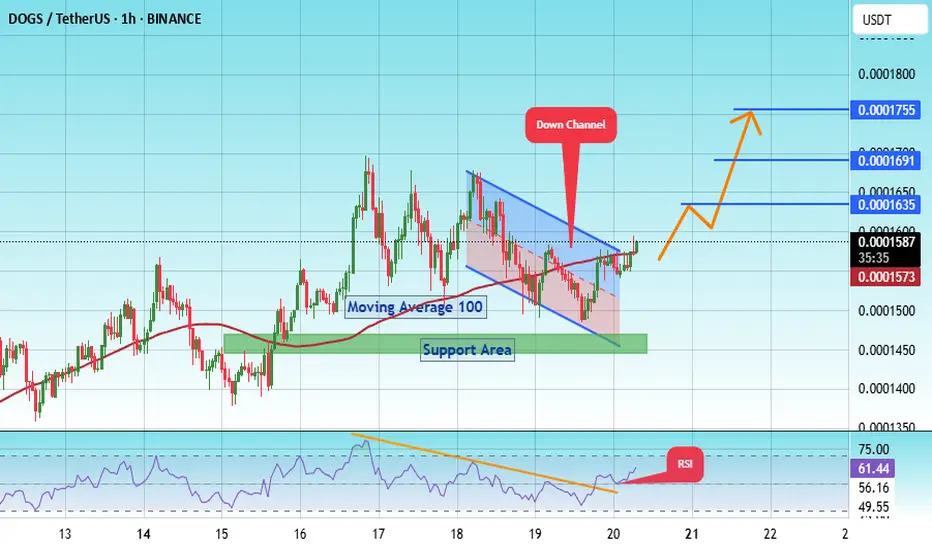
#DOGS/USDT – Launchpad or Breakdown?#DOGS
The price is moving within a descending channel on the 1-hour frame, adhering well to it, and is on its way to breaking it strongly upwards and retesting it.
We have a bounce from the lower boundary of the descending channel. This support is at 0.0001500.
We have a downtrend on the RSI indicator that is about to break and retest, supporting the upside.
There is a key support area in green at 0.0001544, which represents strong support as a basis for the upside.
Don't forget one simple thing: ease and capital.
When you reach the first target, save some money and then change your stop-loss order to an entry order.
For inquiries, please leave a comment.
We have a trend of stability above the moving average of 100.
Entry price: 0.0001600
First target: 0.0001650
Second target: 0.0001733
Third target: 0.0001800
Don't forget one simple thing: ease and capital.
When you reach the first target, save some money and then change your stop-loss order to an entry order.
For inquiries, please leave a comment.
Thank you.
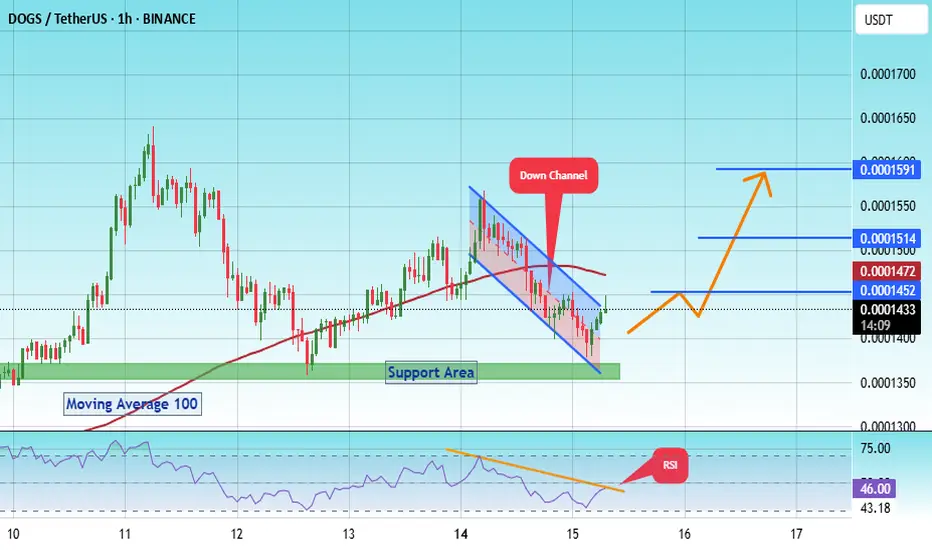
#DOGS/USDT – Launchpad or Breakdown?#DOGS
The price is moving within a descending channel on the 1-hour frame, adhering well to it, and is on its way to breaking it strongly upwards and retesting it.
We have a bounce from the lower boundary of the descending channel. This support is at 0.0001385.
We have a downtrend on the RSI indicator that is about to break and retest, supporting the upward trend.
There is a key support area in green at 0.0001362, which represents a strong basis for the upward trend.
Don't forget one simple thing: ease and capital.
When you reach the first target, save some money and then change your stop-loss order to an entry order.
For inquiries, please leave a comment.
We have a trend of stability above the Moving Average 100.
Entry price: 0.0001430
First target: 0.0001452
Second target: 0.0001514
Third target: 0.0001590
Don't forget one simple thing: ease and capital.
When you reach the first target, save some money and then change your stop-loss order to an entry order.
For inquiries, please leave a comment.
Thank you.
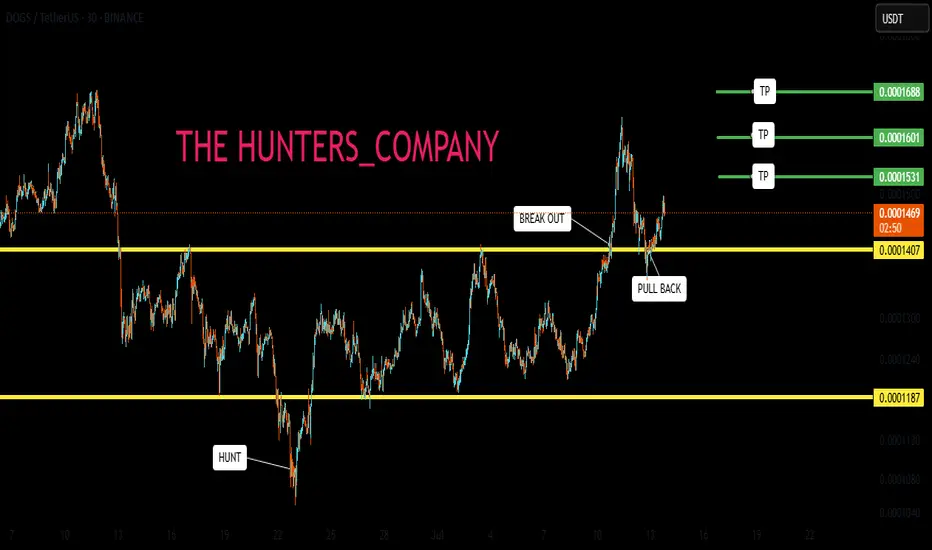
DOGS BUY !!!Hello friends🙌
📉Regarding the price drop, you can see that the price has been suffering for a while and even the resistance has broken, which is not a valid failure (80% of failures are fake in the range)
📈Now, with the successful failure we had and the moneyback that the price has made, we can expect the price to move to the specified targets. Note that for trading, be sure to observe capital management.
🔥Follow us for more signals🔥
*Trade safely with us*
Dogs:Where is the time and point of purchase?hello friends👋
We come to another analysis, this time a popular coin meme that you requested a lot🔥
Well, let me start with the pattern that we specified for you, which is a sign of a price drop, and you can see this happening...
Now, in the important support areas that we have specified for you, you can buy step by step, of course, with risk and capital management.💰
🔥Follow us for more signals🔥
*Trade safely with us*
#DOGS/USDT#DOGS
The price is moving within a descending channel on the 1-hour frame and is expected to break and continue upward.
We have a trend to stabilize above the 100 moving average once again.
We have a downtrend on the RSI indicator that supports the upward move with a breakout.
We have a support area at the lower boundary of the channel at 0.0001370, acting as strong support from which the price can rebound.
We have a major support area in green that pushed the price upward at 0.0001330.
Entry price: 0.0001380.
First target: 0.0001422.
Second target: 0.0001490.
Third target: 0.0001562.
To manage risk, don't forget stop loss and capital management.
When you reach the first target, save some profits and then change the stop order to an entry order.
For inquiries, please comment.
Thank you.

DOGS/USDT – Preparing to Break Out from Accumulation Zone!
DOGS/USDT is currently at a crucial technical point, offering an exciting setup for both short-term traders and long-term investors. After a prolonged downtrend since mid-2024, the price has now stabilized within a major demand zone, forming what appears to be a classic accumulation structure.
🔍 🔹 TECHNICAL STRUCTURE & PATTERN
Accumulation Zone (Base Area): Price has been consolidating between 0.00010 – 0.00018 USDT, retesting this range multiple times since February 2025.
Stable Volume During Sideways Movement: Indicates that selling pressure has weakened and smart money may be entering.
Bullish Impulse Arrow: Suggests potential for vertical breakout if resistance is broken with strong momentum.
Possible Double Bottom or Rounded Base Formation: Classic bullish reversal patterns indicating trend exhaustion.
✅ Bullish Scenario – Multi-X Potential on Breakout
If DOGS breaks and holds above 0.00023 USDT, this could mark the beginning of a major bullish reversal. Potential targets include:
1. 📍 0.00049155 USDT — Initial resistance, ideal for quick profit-taking.
2. 📍 0.00083986 USDT — Previous price floor turned into a new ceiling.
3. 📍 0.00116782 USDT — A key psychological level that may trigger FOMO buying.
4. 📍 0.00238542 USDT — Mid-term bullish target if trend accelerates.
5. 🚀 0.00867539 USDT — Long-term potential if breakout gains serious momentum.
🧠 Market Psychology Note: Smart money tends to accumulate when retail is uncertain. A breakout from this range can cause a momentum rally as retail joins the move, driving prices up exponentially.
❌ Bearish Scenario – Breakdown Risks
If the price fails to hold above 0.00010 USDT, we may see:
A rejection of the current bullish structure.
A drop toward 0.00007 or even 0.000045 USDT for deeper liquidity grabs.
A prolonged accumulation phase before any potential trend reversal resumes.
📌 Key Takeaway
> DOGS/USDT is at a pivotal point — either poised for a powerful breakout with multi-fold returns or headed for a deeper dip if support is lost. All eyes should be on the 0.00023 USDT resistance as the breakout trigger. A confirmed breakout with volume could present a high-reward trading opportunity.
#DOGSUSDT #CryptoBreakout #AltcoinSetup #ReversalZone #TechnicalAnalysis #CryptoSignals #GateIO #BreakoutTrading #DOGS #BullishSetup

#DOGS/USDT#DOGS
The price is moving within a descending channel on the 1-hour frame and is expected to break and continue upward.
We have a trend to stabilize above the 100 moving average once again.
We have a downtrend on the RSI indicator that supports the upward move with a breakout.
We have a support area at the lower limit of the channel at 0.0001230, acting as strong support from which the price can rebound.
Entry price: 0.0001261
First target: 0.0001286
Second target: 0.0001314
Third target: 0.0001352

#DOGS/USDT#DOGS
The price is moving within a descending channel on the 1-hour frame, adhering well to it, and is on its way to breaking it strongly upwards and retesting it.
We are seeing a bounce from the lower boundary of the descending channel. This support is at 0.0001311.
We have a downtrend on the RSI indicator that is about to break and retest, which supports the upward trend.
We are looking for stability above the 100 moving average.
Entry price: 0.0001337
First target: 0.0001367
Second target: 0.0001395
Third target: 0.0001432

#DOGS/USDT#DOGS
The price is moving within a descending channel on the 1-hour frame, adhering well to it, and is heading toward a strong breakout and retest.
We are experiencing a rebound from the lower boundary of the descending channel. This support is at 0.0001608.
We are experiencing a downtrend on the RSI indicator, which is about to break and retest, supporting the upward trend.
We are heading toward stability above the 100 moving average.
Entry price: 0.0001676
First target: 0.0001700
Second target: 0.0001732
Third target: 0.0001745

#DOGS/USDT#DOGS
The price is moving within a descending channel on the 1-hour frame, adhering well to it, and is heading for a strong breakout and retest.
We are experiencing a rebound from the lower boundary of the descending channel. This support is at 0.0001575.
We are experiencing a downtrend on the RSI indicator that is about to be broken and retested, supporting the upward trend.
We are in a trend of consolidation above the 100 moving average.
Entry price: 0.0001604
First target: 0.0001656
Second target: 0.0001656
Third target: 0.0001680

#DOGS/USDT#DOGS
The price is moving within a descending channel on the 1-hour frame and is expected to break and continue upward.
We have a trend to stabilize above the 100 moving average once again.
We have a downtrend on the RSI indicator that supports the upward move with a breakout.
We have a support area at the lower boundary of the channel at 0.0001400, acting as strong support from which the price can rebound.
Entry price: 0.0001412
First target: 0.0001465
Second target: 0.0001511
Third target: 0.0001570

#DOGS/USDT#DOGS
The price is moving within a descending channel on the 1-hour frame and is expected to break and continue upward.
We have a trend to stabilize above the 100 moving average once again.
We have a downtrend on the RSI indicator that supports the upward move with a breakout.
We have a support area at the lower limit of the channel at 0.0001922, acting as strong support from which the price can rebound.
Entry price: 0.0001994
First target: 0.0002055
Second target: 0.0002147
Third target: 0.0002255

DOGS : be carefulHello friends
As you can see, after the price growth we had, the price has fallen. Given the severity of the fall, we recommend that you buy in stages, manage your risk and capital, and move with it to the specified goals.
*Trade safely with us*

Critical Test for $DOGS – Launchpad or Breakdown?SEED_ALEXDRAYM_SHORTINTEREST1:DOGS Update
SEED_ALEXDRAYM_SHORTINTEREST1:DOGS is heading towards an important confluence support area resting precisely at the 0.382 Fib (~0.0000184), the rising trendline, and the 50EMA on the 12H chart.
This area has maintained support in the last rally and may again serve as the launchpad for another bullish run towards 0.000022–0.0000239.
A dip below this level, though, could change short-term bias.
Be on the watch for the reaction. 👀
#DOGS #cryptocurrency

#DOGS/USDT#DOGS
The price is moving within a descending channel on the 1-hour frame, adhering well to it, and is on its way to breaking it strongly upwards and retesting it.
We are seeing a bounce from the lower boundary of the descending channel. This support is at 0.0002267.
We have a downtrend on the RSI indicator that is about to break and retest, supporting the upward trend.
We are looking for stability above the 100 moving average.
Entry price: 0.0002323
First target: 0.0002400
Second target: 0.0002516
Third target: 0.0002620

#DOGS/USDT#DOGS
The price is moving within a descending channel on the 1-hour frame and is expected to continue lower.
We have a trend to stabilize below the 100 moving average once again.
We have a downtrend on the RSI indicator, supporting the upward move with a break above it.
We have a resistance area at the upper limit of the channel at 0.0001400.
Entry price: 0.000135
First target: 0.0001291
Second target: 0.0001220
Third target: 0.0001146

Breaking: $DOGS Gearing For A 60% Breakout Amidst Falling Wedge The price of the first dog-theme memecoin on Telegram ecosystem (TON) Dogs ( SEED_ALEXDRAYM_SHORTINTEREST1:DOGS ), is gearing up for a 60% breakout amidst breaking out of a bullish pennant.
Since listing, SEED_ALEXDRAYM_SHORTINTEREST1:DOGS has delivered a 230% gain and has seen a rapid plunge losing about 94% of market value. But present market metrics hints at an impending 64% surge as the memecoin on The Open Network (TON) is brewing with momentum.
With its RSI at 65, SEED_ALEXDRAYM_SHORTINTEREST1:DOGS is well ready to capitalize on the dip to make a comeback. Tokens on the TON ecosystem have been mute lately with the advent of the Telegram clicker games, so many tokens on TON blockchain has been created and have all falling down the drain with the exception of SEED_ALEXDRAYM_SHORTINTEREST1:DOGS , $HMSTR and ECONOMICS:CATI of which all were listed on top tier exchanges like Binance and Bybit.
A break above the $0.000178 resistant point will clear the coast for the 66% breakout. However, should SEED_ALEXDRAYM_SHORTINTEREST1:DOGS fade the move, the $0.000099 support lies in wait.
Since March high, SEED_ALEXDRAYM_SHORTINTEREST1:DOGS has loss about 49% of market value placing the asset on the cusp of a bullish reversal. SEED_ALEXDRAYM_SHORTINTEREST1:DOGS might just be the coin that will change the tide for the TON ecosystem.
DOGS Price Data
The SEED_ALEXDRAYM_SHORTINTEREST1:DOGS price today is $0.000143 USD with a 24-hour trading volume of $38,940,072 USD. SEED_ALEXDRAYM_SHORTINTEREST1:DOGS is up 0.73% in the last 24 hours. The current CoinMarketCap ranking is #402, with a market cap of $73,674,374 USD. It has a circulating supply of 516,750,000,000 DOGS coins and a max. supply of 550,000,000,000 DOGS coins.

#DOGS/USDT#DOGS
The price is moving within a descending channel on the 1-hour frame, adhering well to it, and is on its way to breaking it strongly upwards and retesting it.
We are seeing a bounce from the lower boundary of the descending channel. This support is at 0.0001010.
We have a downtrend on the RSI indicator that is about to break and retest, supporting the upward trend.
We are looking for stability above the 100 moving average.
Entry price: 0.0001032
First target: 0.0001057
Second target: 0.0001082
Third target: 0.0001117

DOGSUSDT 1DDOGS ~ 1D Analysis
#DOGS Buy after successfully penetrating this resistant line with a short -term target of at least 10%+ from here.

#DOGS/USDT#DOGS
The price is moving within a descending channel on the 1-hour frame, adhering well to it, and is on its way to breaking it strongly upwards and retesting it.
We are seeing a bounce from the lower boundary of the descending channel, this support at 0.0001080.
We have a downtrend on the RSI indicator that is about to break and retest, supporting the upward trend.
We are looking for stability above the 100 moving average.
Entry price: 0.0001147
First target: 0.0001167
Second target: 0.0001200
Third target: 0.0001250
