XAUUSD shortOverall Down_Trend. Doji Candle confirms Price Action for Sell. Push down from the Supply Zone. It will drop down to Demand and Support Zone. There I see possibilities to buy.
Doji

GBPUSD ShortNice little rising wedge forming with resistance around 1.28477, also candles are weakening at the top of the wedge.
Would wait to see if it breaks the resistance although I think it will.


Is it time to get SHORT...Is it time to get SHORT...
If we see a close below the structure level, it could be a good time to start thinking about ways to get short.

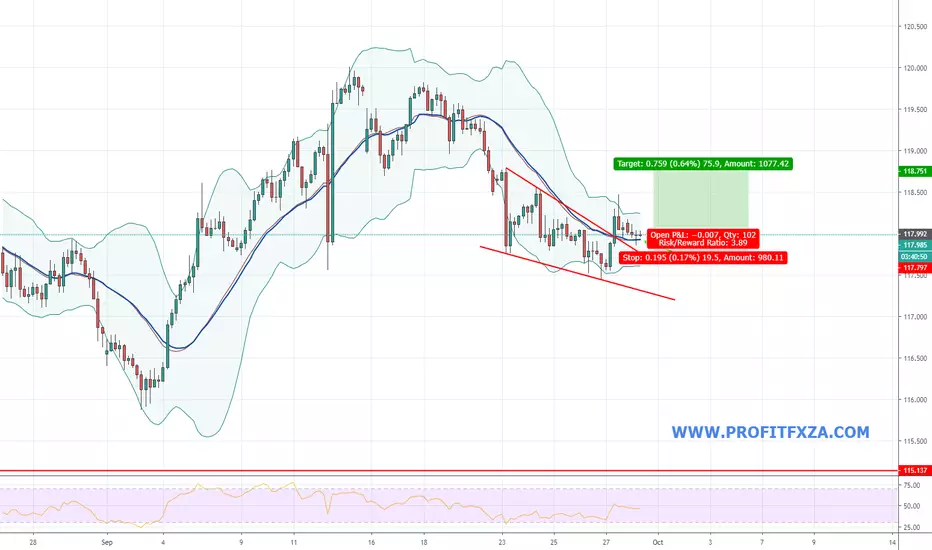
Going against the trend1. Falling wedge breakout
2. Pullback to moving average
3. Pullback to fibonacci levels
4. Doji - indecision signal from price action (so my bias is bullish after pullback)
Stops are best placed below the signal candle where the setup is deemed invalidated and targets should be at least 2x the risk.
Don't invest what you can't afford to lose. This is not investment advice. Subjective view/report of a financial product only.
You can learn price action trading at no cost. Join my mailing list to receive more information zc.vg
Join me in Forex Bootcamp for live updates using the link below.
DISCLAIMER
All information published within this website is purely for educational purposes and offers no guarantees. Profit Fx, Forex Bootcamp and any of its associates cannot be held responsible for any trades that you have executed in any way whatsoever. Please familiarize yourself with the relevant risks involved when trading forex, CFD’s and other products. Any trading is done solely at your own risk. Profit Fx, Forex Bootcamp and any of its associates are in no way employed by any broker or any other legal entity. All information published within this website does not constitute advice, but rather objective information about a financial product and analysis or report of a financial product.
BTCUSDT Pullback to Trendline
If you like the idea, please, hit the Like button and subscribe to the profile in order not to miss our updates.
The information given is never financial advice. Always do your own research.

SPY - Daily - Lonesome dojiI believe the market wants to go higher, and I have switched my bias to bullish ... for now. However, I think there will be some profit taking before the all-time high is broken for good, and convincingly.
There was a gap up to open the day. The market then shot up, then shot down, then finished undecided (doji). Typically, a gap, then a doji, means reversal. But in this crazy market who knows!?
I am thinking that we will see a small pullback for profit taking more than anything else. This was a good run-up after the consolidation break-out ... people are going to want to take their money while they're ahead. Notice the volume? It has been increasing for 4 days, and that could mean there's a little exhaustion here at the top. It's never a good thing for a market to overheat; a tiny pullback would be nice before it busts through the all-time highs.

Advanced trading Guide: Doji Candlestick AnalysisDoji Candlestick Analysis pattern is among the misunderstood candlestick patterns. There are four types of Doji candlesticks. Each has a different meaning and most advanced traders can figure them out. Most books written will teach Doji as a representation of indecision in the markets.
Looking at the length of Doji, you’ll be able to speculate the future market movement. In this post, you’ll learn how to read and analyze Doji candlestick pattern.
What is Doji?
Doji candlestick appears on the trading chart when the market opens and closes at the same price level. It simply means that the market is uncertain if the buyer or sellers are in control.
But there is a variety of Doji with various meaning on each. For now, let us know what usual Doji looks like:
Doji Candlestick Sample - FinanceBrokerage
Doji is a simple candlestick pattern. But it differs when taken into context. It provides the traders the sense of how the market will move. For instance, when spotting a Doji in an uptrend. This simply means that the market is in equilibrium (temporarily). Upon enough rest, the market will move higher on the path with least resistance. Observe the sample graphic below:
Sample Doji candlestick in an Uptrend - FinanceBrokerage
Avoid this usual mistake:
Majority of traders spot Doji Candlestick Analysis in an uptrend and decide to go reverse. That’s a really bad idea. Looking at the market, if a trend is going upward and been moving higher, why would it lose against a single pattern like Doji?
Different types of Doji candlesticks
Dragonfly Doji
In fact Dragonfly Doji rarely occurs in which the price closes on the exact position it opened. Preferably, there is variation in having a small body with a long wick in the bottom. The meaning will be the same. The important point is being familiar with what it means.
Dragonfly Doji usually appears if the opening and closing prices are at the same level with a long lower wick. Below is a sample of a bullish Doji:
Dragonfly Doji Sample - FinanceBrokerage
That shows that whenever the market opens, the sellers are going in and pushing the price lower. But it won’t take a long time before buyers take control of the market, pushing the price higher.
How to trade with Dragonfly Doji?
Support marks an area where possible buying may come in. Go long whenever the price comes to support area and creates a Dragonfly Doji. The exact scenario tells you that it rejected lower prices with a high possibility to reverse higher. Observe the sample chart below:
Dragonfly Doji in a range market Chart Sample - FinanceBrokerage
When it comes to trending market, the market would likely bounce off the moving average. But you may go long whenever the price pulls back toward a moving average forming a Dragonfly Doji. Observe the sample chart below.
Dragonfly Doji in a trending market Chart Sample - FinanceBrokerage
Gravestone Doji
Gravestone Doji appears whenever the open and close are in the same amount, but with a long upper wick. Below is an example of a Gravestone Doji:
Gravestone Sample - FinanceBrokerage
This type of Doji shows that when the market opens, buyers come and push the price higher. But it won’t take long until sellers gain control and push the price lower. The market finally closes with the same price it opened. This is a sign of weakness because sellers are in control.
How to trade with Gravestone Doji?
Resistance area marks the part where possible selling pressure could come. Go short when the price gets close to resistance forming a Gravestone Doji. The scenario simply shows that the market rejected higher price and could reverse lower. Observe the sample chart below.
Gravestone in Range Market Sample - FinanceBrokerageWhen it comes to a trending market, Gravestone Doji could make the market bounce off moving average. Go short whenever the price pulls back towards moving average forming a Gravestone Doji. Observe the sample chart below.
Gravestone in a Trending Market Chart Sample - FinanceBrokerage
Long Legged Doji
Long Legged Doji appears whenever the open and close are in the same price, but with a long upper wick and lower wick. Below is an example of a Long Legged Doji.
Long Legged Doji Sample - FinanceBrokerage
This Doji pattern shows that the market is uncertain upon a huge expansion in volatility. This pattern rarely occurs but if it appears, expect volatility to die out for some time before it picks up again.
There are two ways to trade in a Long Legged Doji. Let’s elaborate each.
After huge expansion in volatility, the market will need to take a break before it continues. For a while, the market will be in the range to gain orders before breaking out. That means you can go long on the lows of the Long-Legged Doji. Observe the sample chart below.
A Long-Legged Doji Sample on Chart - FinanceBrokerage
Long Legged Doji Short the Highs on the First Test Sample Chart - FinanceBrokerage
Based on the first sample above, whenever the price tests the high/lows a lot of times, it will likely break out. Look at the sample chart below.
Long Legged Doji Went Into a Range - FinanceBrokerage
Full illustrated article on Doji Candlestick Analysis

Doji signalA doii = indecision
Indecision on support = buy signal
The principal for this type of setup entails placing the stop a few pips below the doji. The profit target must be at least double the risk and the up side potential here is MUCH more than the provisional target.
Don't invest what you can't afford to lose. This is not investment advice. Subjective view/report of a financial product only.
You can learn price action trading at no cost. Join my mailing list to receive more information zc.vg
Join me in Forex Bootcamp for live updates using the link below.
DISCLAIMER
All information published within this website is purely for educational purposes and offers no guarantees. Profit Fx, Forex Bootcamp and any of its associates cannot be held responsible for any trades that you have executed in any way whatsoever. Please familiarize yourself with the relevant risks involved when trading forex, CFD’s and other products. Any trading is done solely at your own risk. Profit Fx, Forex Bootcamp and any of its associates are in no way employed by any broker or any other legal entity. All information published within this website does not constitute advice, but rather objective information about a financial product and analysis or report of a financial product.

Reversal candleWhen you see a candle at the bottom of a downtrend like the one pointed out here it can be a signal that a reversal is in the cards. Just thought I would show you all. You can also see the support is right under the reversal candle. Just something to watch.


Waiting for BUY SignalI m not sure about the shape is forming now. This is 1 hr chart and we are able to see it above 10K if this continues and we stay above green line things will br positive.
from 5 min to 1 hr chart all i see is doji candles. which means caution. uncertainty and indecision.
we think from nw it will go up.
all longs ready. now whales will pulll that down.
when lot of uncertainty just hold the breath and wait for right action.
i sold at 10300 but when i saw its growing to 10700 lot of greed came in. this is what whales want to do. Dont you worry we will make sure to take right entry before 600 MA golden cross and then sky rocketing the price. but this week we do not have room to grow to 15k. Have'nt said that , anything can happen because,, its BITCOIN. !!
but i am waiting to long on my buy signal.
follow me to know when is buy signal.
Thank you.

Bitcoin following a red Doji pathMade a bunch of trend lines over a week ago.. Just amazing how they continue to be trendy.
Bitcoin looks to be following the red side of the Doji path:

RUBI: possible reversal before earningsRUBI moved into overbought (MFI indicator) territory after a cup and handle formation. Will set a tight stop at the peak of the gravestone doji and look to sell before earnings. If this eventuates, it could form a larger cup and handle formation, something to keep an eye on after earnings is released.

Nail reversals for high leverage tradesCOINBASE:BTCUSD
.. .. Tic by Tic Bitcoin Scalper
A groups of technical indicators to find entries & exits at exact reversal points..
The Mighty Doji along with decoding the visual data allows this...
( If only my TA & frame of mind could be up to the challenge! )
What else does one do after getting supremely REKT by the Corn
A pursuit of perfect scalps..
-new 2 charting and TA
Be kind and charitable with your feedback and reputation points.. :)
btc donate - Help a soul get back in the game
13zGwmtKRLxdSHDcVakWCMj6fbP1seFsF
//

BTC Road to 20k - V4: Trend reversal on the daily?
The red trendline is a key level, if we drop below 11k, most likely will see lower lows for the next few weeks.
Most recent doji showing indecision, could lead into a reversal or more down trend. Watch the 1,2,3,4 hr charts for hints for the next daily.
If the next daily candle printed is green, put on your moonboots - 13k and beyond.
This is not investment advice. Counter trading me is a good strategy :D

forexTrdr USDCAD- 170 PIPS PROFIT EXPLOSION ABOUT TO REPEAT?Afternoon traders,
After a big number on US Non farm payroll data surprised the market on Friday and threw the market into doubt over whether the US central bank, the fed, will cut rates at the next meeting giving the US dollar a bounce in strength into the weekend against market expectations. We are looking at a long setup in USD versus Canadian dollar with the pair slowing and bouncing off February's low resistance levels as highlighted in our trading view chart.
We have also highlighted how oversold the pair are on stochastic and rsi indicators with. We have highlighted on the Stochastics the last time the pair hit this level and resulted in a 172 pip move higher. We are therefore targeting a move to low to mid 1.32 area and at the same time place a stop loss just under the recent lows skewing the risk reward in our favor on a 3.8 basis . We recently had a doji form on daily candles suggesting we have reached a near term low as selling volume matched off against buying volume which generally points to a change in direction nearterm.
Follow us on tradingview under forexTrdr to get our sample ideas free and immediately - its free to setup a profile and the charting tools and software is easier to use than Meta trader and most broker platforms.
Good luck trading
from the Team at forexTrdr

GBPCAD 4H reversalGBPCAD doji and 4h diagonal support signals possible reversal and bullish continuation of this hour.


Another example of a doji (support and resistance)So the price crashed into the uptrend line on my chart and a doji formed at the end of an uptrend. When a doji forms like that during an uptrend it can signal a reversal. Keep your eye on candles like that. Also notice that if you would have sold at the doji and watched it drop it bounced right off the 50 MA. That tells you a lot. Understanding support and resistance is a huge part of being a successful trader

AUD/CAD LONGWe hit the resistance, now its pretty clear that we will hit the block i drew in, its an "doji" candle time zone, as I call it, at that time the market was indecisive, now as we hit equilibrium we can see that its now decisive, with an clear long position.

Doji dropLook what happened after this doji candle appeared. Keep an eye on candles like this especially on an uptrend because they can signal a reversal.

EURAUD Massive daily resistance and rejectionNow EURAUD is a pair I have come to build some what of a love hate relationship with over the past 6 months. Previously taking shorts at a similar level in January before being annihilated by the flash crash. Luckily I did re enter and caught a lovely 500+ pips. Anyway that's besides the point, currently we are back at this huge resistance zone, where we saw daily pinbars back to back. This along with a few other confluences prompted me to enter short position, but hey what do you know we get a lovely news release pushing us up and through the zone leaving a slight fake out. On the 18th June we then saw buyers continuing up before plummeting back down engulfing 3-4 days of previous price action! At the time of writing we have just seen another pinbar printed and left on the daily with a Doji body. This again, along with other confluences has prompted further short entries for myself!
