Doji

XBTUSD Falling Wedge Outbreak, Doji with High Volume - BTC BackThe pull back of yesterday could be over!
We see a huge Doji candle with a high volume which indicates a reversal. This Doji formed at 50% fibonacci level --> Bounce off this support level.
Additionaly we broke thru the down trend line of the falling wedge. This gives us also a signal to go long.
RSI stopped going down and shows us a consolidation. DMI shows gives us the same signal.
If we break thru the double bottom neckline on 30min Chart at 8900 we should expect a continuation of the uptrend for short term which will tell us if the up trend on 4h has enough power to go further.
Here the 30min Chart:

FEYE doji quick retraceThis could be the start of a pullback to retest resistance (possible neckline of inverse head and shoulders). Good volume on doji indicates resistance and pressure to the downside. This is a short term play only (see long term idea for FEYE below)

XRPUSD looking really bearish for shortOn the Daily candle you can see a doji what tells me that it will go down.
Also you can see the a flag, if it breaks to the downside it will fall and reject in one of the downside areas.
And a double top

Iota makes little correction before new highs.Iota successfully hit 1.99 resistance and it is giving a reversal signal. Doji candle has been formed , RSI shows overbougt and Macd MA-s are crossing, so we have good signal to short on correction now. reversal for buy point is at 1.80 level, because it is already Fibo Zone and there is strong support Line, for this time RSI and MACD will be in a good position too. next target price is 1) 2.14 and 2) 2.31 according to Fibo.

Bitcoin Analysis It is fairly simple, volume moves (and predicts) price action. The current rally shows the following:
Starting on the 11th, the C.M.F. (green), A.D.X. (yellow), and C.M.F. osc. (peach) showed volume coinciding with the price rally, however yesterday we began to show a decline in overall buying power.
We have hit the daily Kijun-sen (Base Line in pink) and continue to linger there, in the past we have wicked above it and still reversed. The Senkou (bottom of the cloud) sits right above the base line that acts as additional resistance. If volume matched the recent increase of price then I would not be worried about either. Also the Stoch and R.S.I can be viewed.
Below that is a expanded view of our volume indicators on the hourly. (Note I changed the C.M.F. inputs to 50 to give me a more detailed look)
The 12 hour shows exhaustion on the T.D. sequential. This T.D. indicator I have showing is a modified version (better) that Tone Vays created. (www.tradingview.com) However there is no other sell signals on any time frames as of this writing from the T.D. sequential.
Below is the short/longs comparison on Bitfinex, longs are fairly heavy and can act as fuel for my short position. It does appear the rest of the market is starting to realize what I have been watching and adjusted their position as longs have decreased and shorts increased (slightly) in the last 12 hours (too late).
Conclusion
Multiple time frames show the Bollinger Bands capped, crypto generally doesn't care about the B.B., but it is something to take note of. Volume is not holding on the buy side, in order for us to continue a rally past the daily Kijun-sen and into the cloud we would need to see a large increase in buy power. In my opinion this is a perfect storm for another reversal, the 50 day moving average is one spot to watch for a bounce and potentially close any bearish positions, I will be monitoring volume there (as always). Below that we have the daily Tenkan-sen (Conversion Line in orange) that acts as support. As a note there is other potential bounce points to watch on smaller time frames, in this idea I am sticking to a larger view of things.
I have been filling short positions and setting my stop loss just above the cloud Senkou leading span on the daily ($9,250) in case volume increases and I am not monitoring it.
Slap a like and follow on this for me, even if you disagree. That way when I am wrong everyone can see in trending ideas.

BTC 4HRChikou crossing price
Kijun at bottom of current candle
Kumo twisted
DI squeezing
RSI high. Price could hit buy zone at bottom of channel


Storm 4HRPrice has been accumulating as shown by the dojis
RSI has room to slightly fall more
DIs are indicating bullish fluctuations
Trend is strong
Chikou crossed price - trending up
Senkou span A&B indicate more potential ranging


NFLX ShortAfter a couple of indecision candles, break of Friday's low should take this lower. Notes on chart.

Bitcoin reversal imminent (Buy opportunity) -50 week moving-average is showing support (6600)
-4hr candle higher low in the falling wedge (blue).
-TD sequential is indicating reversal at a daily 9
-RSI in oversold area.
I expect the price to test the top of the wedge at around (7400) if price can break these levels I expect Bitcoin to bounce up further towards the linear uptrend line (yellow) at (7800) and the longer term downtrending line at (8200).

Bitcoin in BeartownWatch for
- Volume bullish or bearish
- Stochastic to continue uptrend
- DI+ and DI- to crossover
- Price to break upside of wedges into the Ichimoku Kumo
- Senkou Span A & B to twist.
- Chikou Span to vertically crossover price

Potential Long opportunity for EurGbp?The EurGbp has been moving sideways since September 2017 and price is boucing between 0.8720 and 0.8967 key levels.
A long tailed Doji or I would considered it as a Pin bar was formed on last Thursday, rejecting the price from the 0.8720 key support. The Pin was followed by another bullish candlestick, which complete the classic "Morning Star" pattern.
My position :
Entry : 0.8738
SL : 0.8643
TP : 0.8881
*** This information is NOT a recommendation to buy or sell. It is to be used for educational purposes ONLY. ***
*** I will accept no responsibility for any losses you may incur. Do not invest more than you can afford to lose. ***

EURGBP Daily doji confirmationLong ledged dailiy doji + dailiy confirmation let me think EURGBP will be bullish


BITCOIN: TIME TO SURGEHere’s a daily BTC chart. As you can see, i draw two big boxes, a red one and a green one. They represent where the direction towards which BTC should go and should NOT go in order to have a bullish/bearish market. In other words, the moment BTC breaks the red box, we can be sure that we are in a BULLISH market, if it goes below the green box, we are still in a BEARISH one.
All the sideways movements inside the two boxes cannot tell us in which market we are. Even strong bullish signals could just be FAKE.
Today BTC is forming a DRAGONFLY DOJI/HAMMER, both are strong bullish signals. But, of course, we need a confirmation in the next 1-2 candles.
The blue line is a convergence line, and the green lines are possible targets in case of an uptrend.
Generally, BB, CCI and RSI pattern can confirm that an uptrend CAN happen. In this case, we will see a crossing in the MACD pattern.
Trade with your brain
Brainsignals Team

SPY Breaks above triangle, suggests continuation higher!After Friday's strong session, SPY has broken above its triangle which suggests a continuation higher towards $286 high's from early Feb. This rally has been on relatively low volume so caution is necessary. Today's Doji candle is concerning but weekly charts look strong. Use options to take bullish bets in this type of markets where options are cheap and you can limit your risk with Call Debit Spreads. Example: SPY April 20 278/289 Call Vertical @ $386. See this trade here: app.optionsplay.com
What's your next OptionsPlay?

EURCHF 4h shortLL/LH and doji candle appeared in the day time frame. Couldn't break out the middle dot line resistance.

hammer time -- must confirm bullish reversalyou probably heard someone else say this, but
HAMMER TIME
bullish reversal upcoming, must confirm

Bitcoin chart is bearish?According to candlestick charting criteria, we could determine a few signs of bearish implication (reversal patterns):
1. Hanging man candlestick (could be interpreted as dragonfly doji)
2. Shooting star
3. Double top as a strong reversal pattern (blue dotted line)
And an additional bearish sign:
4. A decrease in price volume
These are enough signs for pattern reversal but, bear in mind, candlestick charting technique cannot say how long will reversal trend lasting.
Finally, this is not financial advice. Remember to always do your research before investing.

Bullish Long-legged doji MonthlyLong-legged doji is a candle with long upper and lower shadows and a small real body. The pattern shows that there is an indecision between the buyers and the sellers, and that the market is approaching transition period.
Long positions can be taken in case of Bullish Long Legged Doji, once high of the candle is exceeded.
Shorts can be initiated once the low of the candle is broken, in case of Bearish Long Legged Doji.
Bullish:
Bullish Long Legged Doji has very long shadows on both the ends. The patterns shows indecision of buyers and sellers. It is a bullish reversal pattern. In this pattern, market is in a bearish mood and is in downtrend. Then, a Long Legged Doji appears, which gaps in the current trend.
This pattern requires confirmation by way of opposite move to the prior trend on next day.
Bearish:
Bearish Long Legged Doji has very long shadows on both the ends. The pattern shows indecision of buyers and sellers. It is a bearish reversal pattern. In this, market is in a bullish mood and is in uptrend. Then, a Long Logged Doji appears, which gaps in the current trend.

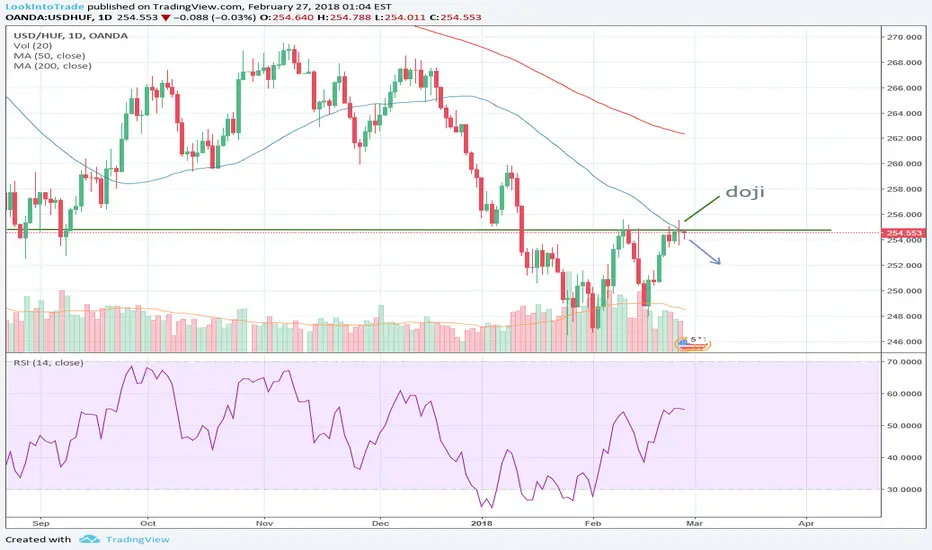
USDHUF: bearishSell USDHUF. Touching resistance as well as SMA50. In addition, doji formed yesterday.