Doji

EURAUD BUY-SETUPBuy EURAUD
Reasons to buy:
- Support-zone at 1.44/1.45
- Double-bottom forming
- Lowtest-Doji
- Bullish macd-divergence
Exit points:
1.48
1.51

EUR/GBP | 12 August 2016 | - Previous structure high big turning point after brexit
- Market printing a clear range between brexit high and low @0.83289
- Bullish rally from 0.83
- Price stalling on all timeframes especially the daily printing indecision / strong wick rejection at this level which we'll be using for our entry signal
- Entry at the low
- Stops above the most recent high


Just Dial - Breaking out Down Trendline on Daily Chart (BUY)The price action has reached to the bottom and now we have noticed a breakout from a prevailing downward trendline which indicates a positive sentiment emerging in the price action. I have also noticed a MACD crossover and also RSI getting out from oversold areas. This also indicates positive sentiments. On weekly and Monthly chart I noticed a double bottom and doji formation, that signals a trend change.
It is trading at good risk reward and it is wise to take positions on current levels.
Target 1 : 600
Target 2 : 630
Stoploss : 540

Fist's Wave Trend - StochRSI - Harami KillerJust a combination of indies. The faster moving StochRSI can be used a trigger signal for Wave Trend confirmation of Price Action. Interesting to play with settings on different time frames - as always, whatever works for you. Can probably be helpful for binaries from 1M upwards.

Fist's Harami Killer v.2 with EMA6/100Just a tweak on the orginal with clearer bull/bear harami arrows. No suggestion on how you should trade it - it's just an indicator, not a strategy ! For 1m and 2m binaries, it's quite good at picking out next candle, but most with trend . Anyways, nothing to write home about. Trade smart.

Fist's Harami Killer with EMA6 by the Fist of KhanSimple harami and doji indicator adapted from Repo32 Candlestick Identifier - a great piece of work and awesome respect to the originator. This script only shows harami and doji for use with Heiken Ashi in above/below comparison to traditional candlestick chart.
It leaves a clean chart without too many distractions so you can concentrate on price action.
A useful indicator for trading next candle/s in direction of trend off doji or harami. Use Shiva Krishnan's EMA6 method for additonal confirmation.
Publishing at 15M but works well on shorter time-frames.
Please do not just follow the dojis and haramis - general price action needs to be taken into consideration, of course. And please test your own strategy.

Maruti - Doji with Bearish Divergence (Sell)I have observed three doji candlesticks, that denotes consolidation or distribution, where previous buyers book profit or distribute their shares. It is at the level of selling or resistance. I believe it is a good time to short it now at minimum risk size and also at this point where Nifty is also looking bearish.
Further 3 points noted:
1. Doji formation with bearish divergence
2. Shrinking of volume levels with increasing prices, signals trend change, for this one, a bearish signal.
3. Double Top with bearish divergence.
Above points make me think that it is a good sell, with a stoploss of 4238 (1.28%) and target of 3922 (6%)

AUD/USD / Shoulder, Head, Shoulder Pattern + Doji candleAUD/USD , Daily Chart. RSI (9,close), EMA (21, RSI).
Risk Reward Ratio: 4.83.
Shoulder, Head, Shoulder Pattern + Doji candle.
If price break the neckline can continue a strong bearish progression.
Doji candle confirm the pattern.

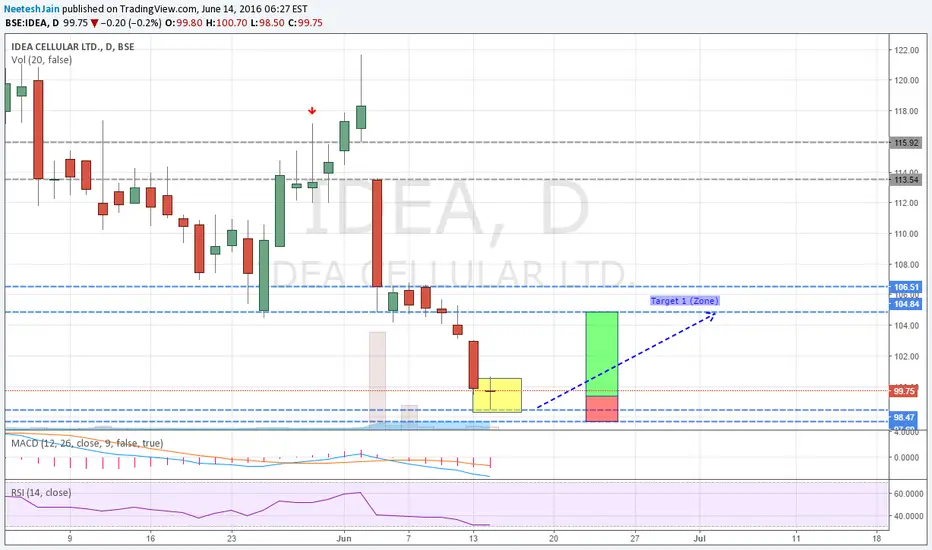
IDEA - Connecting DOJI Signals a BUY DOJI formation at the previous support signals a buy for now.
Target 1: 104.50
SL: 97.70
Risk Reward= 1:4
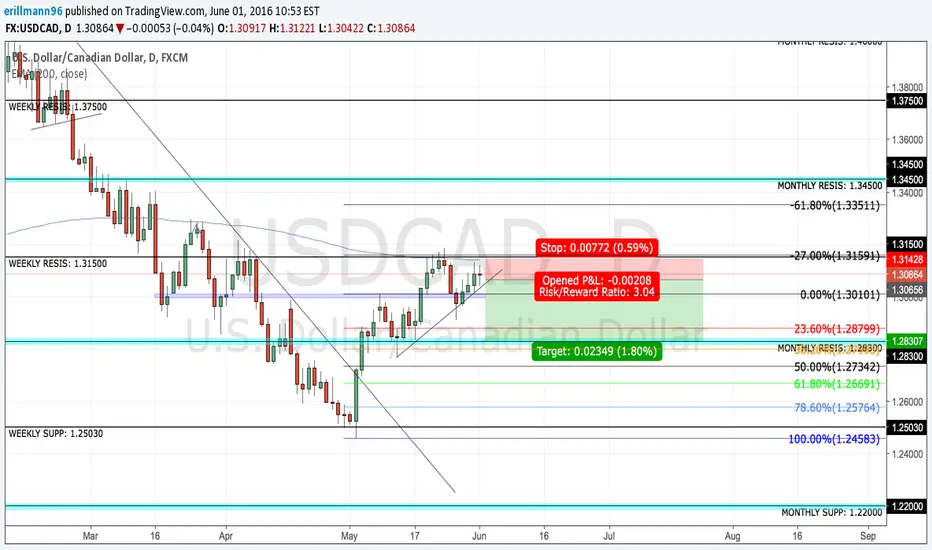
USDCAD BIAS SHORTUSDCAD FULFILLED -27.27% FIB LAST WEEK
1.31000 AREA SEEMS TO BE ACTING AS STRONG DAILY RESISTANCE ALONG WITH THE 200EMA
DXY SHOWING SEVERE DIVERGENCE TO THE DOWNSIDE
LOOK TO SELL UPON A PHASE LINE BREAK SHOWN
3:1 RISK REWARD TO KEY LEVELS 1.28300 AND 38.2% FIB
HAVE A NICE DAY
Its A head and Shoulder if you graph the chart on a Daily BasisThe chart draw a head and shoulder pattern after inverted Head and Shoulder last February to April. Waiting for good News on GBP tomorrow. Since this is overbought, it needs to be breath around -15% to -50% (a nice entry for uptrend). beware of FED Announcement because this are main things that GBP become bearish. BREXIT is a bullish trend for this. Happy Trading.
Notes: Sell on Good News and Buy on Negative news
Buy on Rumors.
If undecided. set your position every 4 hours.
As a Derivative representative, I can't guarantee on your possible losses/gains in position.

Short OpportunityAlright, what we have here is a classic long candle and doji pattern inside a bear flag. This pattern indicates that buying power is diminished and a gap down tomorrow could signal a shorting opportunity with stop loss above the flag.


USDZAR - 1D - Basic structure trade folling recent directionUSDZAR as been correcting this year and is potentially goin down to the upward weekly trendline. Im now looking for a basic structure trade inside the 4H trend that developed due to the correction. Pinbar and doji showing rejection inside the the expected area and risk reward is pretty nice.

Sniper Trade Before Non Farm news releaseThis bearish gartley pattern talks by himself .The Rsi is overbought and have a divergence condition,the strong bearish trend and the doji candle in D chart is enough to get involve in this particular trade but leave just before the nonfarm news release just in case .


Doji (star) in 21 exponencial moving average AUD USDThis pair is in a good and long trend in D1 time. But, in Monthly it is making a doji while touch the 21 mme. In the Weekly time the pair is kind of losing forces and it is a little far from average. Besides the trend of D1 graph, i want to sell. A made some lines and figures trying to show this "reversion" in the D1 (but according to the long term Monthly graph).
If the prices in Monthly graph go upper the average, then the trend is lost in monthly and the sell is lost too. But i trust the Monthly trend. LOL


