Dollar Falls as Traders Price In Two 2025 Rate Cuts on Weak JobsDollar Falls as Traders Price In Two 2025 Rate Cuts on Weak Jobs Data
Introduction
In a significant turn of events for the global currency markets, the U.S. dollar has taken a sharp tumble as traders brace for a more dovish Federal Reserve. A weaker-than-expected U.S. employment report for July 2025 has prompted market participants to price in two interest-rate cuts by the Fed before the end of the year. This shift in monetary policy expectations comes during a time of heightened global uncertainty, much of it triggered by President Donald Trump's aggressive trade policies, which have already disrupted the $7.5 trillion-a-day foreign exchange market.
The Bloomberg Dollar Spot Index, a key gauge of the dollar’s strength against major currencies, plunged as much as 1%—marking its worst single-day performance since April 21, 2025. The greenback’s decline was mirrored by strong gains in rival currencies, with the Japanese yen appreciating 2.2% and the euro climbing more than 1% against the dollar.
This article delves into the recent developments surrounding the U.S. dollar, the implications of weak jobs data, the Federal Reserve’s likely response, and how Trump’s trade policies are shaping the broader economic landscape.
________________________________________
Weak Jobs Data Sparks Policy Shift
The July 2025 employment report came in well below expectations. Non-farm payrolls growth fell short, and revisions for May and June showed fewer jobs were added than previously reported. These figures suggest that the U.S. labor market is cooling more rapidly than anticipated, raising concerns about the sustainability of the post-pandemic economic recovery.
According to Helen Given, a foreign exchange trader at Monex Inc., “It’s now clear that the U.S. labor market is cooling fairly sharply. There’s a good chance that Trump’s crusade against Chair Powell ratchets up further in the coming days, and there could be further losses for the dollar to come as a result.”
The disappointing employment data has led traders to adjust their expectations for U.S. monetary policy. Futures markets are now pricing in two 25-basis-point rate cuts by the end of 2025, a stark reversal from the earlier outlook that suggested the Fed would remain on hold or even consider tightening if inflation remained sticky.
________________________________________
The Federal Reserve’s Dilemma
The Federal Reserve now finds itself in a precarious position. On one hand, inflation has moderated in recent months, giving the central bank more room to maneuver. On the other hand, a weakening labor market could indicate a broader slowdown that might require immediate action to prevent a recession.
Fed Chair Jerome Powell has come under increasing political pressure from President Trump, who has publicly criticized the Fed for keeping rates too high. Trump argues that rate cuts are necessary to support U.S. exporters and counteract the negative effects of his own tariffs and trade restrictions.
Historically, the Fed has maintained its independence from political influence, but in an election year, the pressure to act can become intense. If the Fed moves to cut rates, it will be seen as responding to both economic data and political dynamics—a delicate balancing act.
________________________________________
The Global Currency Market Reacts
The ripple effects of the dollar’s decline are being felt across the globe. The $7.5 trillion-a-day foreign exchange market, already under strain from geopolitical uncertainty and shifting central bank policies, has seen increased volatility in recent weeks.
The Japanese yen, often viewed as a safe-haven currency, surged 2.2% against the dollar following the release of the jobs data. Meanwhile, the euro gained over 1%, reflecting investor sentiment that the greenback’s era of dominance may be waning—at least for now.
Emerging market currencies also found some relief, as a weaker dollar generally eases pressure on countries with large dollar-denominated debts. However, the overall picture remains complex, as trade tensions and capital flow volatility continue to weigh on risk sentiment.
________________________________________
Trump’s Trade Policies: A Double-Edged Sword
President Trump’s trade strategies have been a central feature of his second term in office. From imposing tariffs on Chinese imports to renegotiating trade agreements with the European Union and Canada, Trump has sought to reshape the global trading system in favor of American manufacturers.
Yet these policies have produced mixed results. While some sectors have benefited from protectionist measures, others—particularly those reliant on global supply chains—have suffered from rising costs and retaliatory tariffs. The uncertainty generated by these policies has also dampened business investment, slowed global trade, and disrupted financial markets.
“The dollar had tumbled this year as Trump’s aggressive trade policies rocked the $7.5 trillion-a-day currency market, weighing on global growth outlook,” Bloomberg reported.
Investors are increasingly concerned that continued trade friction, combined with growing political pressure on the Fed, could lead to policy missteps that undermine the U.S. economy and erode confidence in the dollar.
________________________________________
Market Implications
The dollar’s recent decline has far-reaching implications for various asset classes:
1. Equities
U.S. equities have shown mixed reactions. While lower interest rates are typically supportive of stock prices, the underlying reason—economic weakness—has investors on edge. Sectors such as technology and consumer discretionary are expected to benefit from cheaper borrowing costs, but cyclical sectors may struggle if growth slows further.
2. Bonds
Treasury yields have fallen sharply as traders anticipate rate cuts. The 10-year yield dropped below 3.8%, its lowest level in months. The yield curve has also flattened, a potential warning sign of slowing economic momentum.
3. Commodities
A weaker dollar typically supports commodity prices, as most are priced in dollars. Gold, oil, and industrial metals all saw gains in the wake of the jobs report. However, demand-side concerns stemming from a global slowdown could limit the upside.
4. Emerging Markets
For emerging markets, a softer dollar offers both relief and risk. On the positive side, it reduces debt servicing costs and can attract capital flows. On the negative side, if the dollar’s weakness reflects a broader global slowdown, risk appetite could remain subdued.
________________________________________
Looking Ahead: What to Watch
As markets digest the latest economic data and policy signals, several key developments will be closely monitored:
1. Upcoming Fed Meetings
The Federal Open Market Committee (FOMC) will meet again in September. Markets will be keenly watching for any changes in tone or new forward guidance. A rate cut in September now appears increasingly likely, especially if subsequent data confirms a labor market slowdown.
2. Inflation Trends
While inflation has moderated, it remains a key concern for policymakers. If inflation rebounds unexpectedly, it could complicate the Fed’s ability to cut rates without stoking price pressures.
3. Geopolitical Risks
Trade tensions, particularly with China and the EU, remain unresolved. Any escalation could further destabilize markets and weigh on the dollar. Additionally, developments in the Middle East, Eastern Europe, and Southeast Asia could add to the uncertainty.
4. U.S. Presidential Politics
With the 2026 presidential election campaign already underway, Trump’s rhetoric and policy decisions will continue to influence market sentiment. His ongoing criticism of the Fed could erode confidence in U.S. institutions, particularly if it leads to perceived politicization of monetary policy.
________________________________________
Conclusion
The sharp fall in the U.S. dollar following weak July jobs data marks a pivotal moment in 2025’s economic narrative. With traders now pricing in two Federal Reserve rate cuts by year-end, the stakes have never been higher for policymakers, investors, and political leaders.
While a softer dollar can provide some temporary relief to exporters and boost inflation expectations, it also reflects deeper concerns about the strength of the U.S. economy and the unintended consequences of aggressive trade policies. President Trump’s confrontational approach to global trade, combined with mounting pressure on the Fed, is creating a complex and potentially volatile environment for markets.
As the year progresses, all eyes will be on the Federal Reserve’s response, the resilience of the U.S. labor market, and the evolving political landscape. In a world where headlines can move markets in seconds, clarity, stability, and sound policy have never been more critical.
________________________________________
Disclaimer: This article is for informational purposes only and does not constitute financial or investment advice.
Dollar
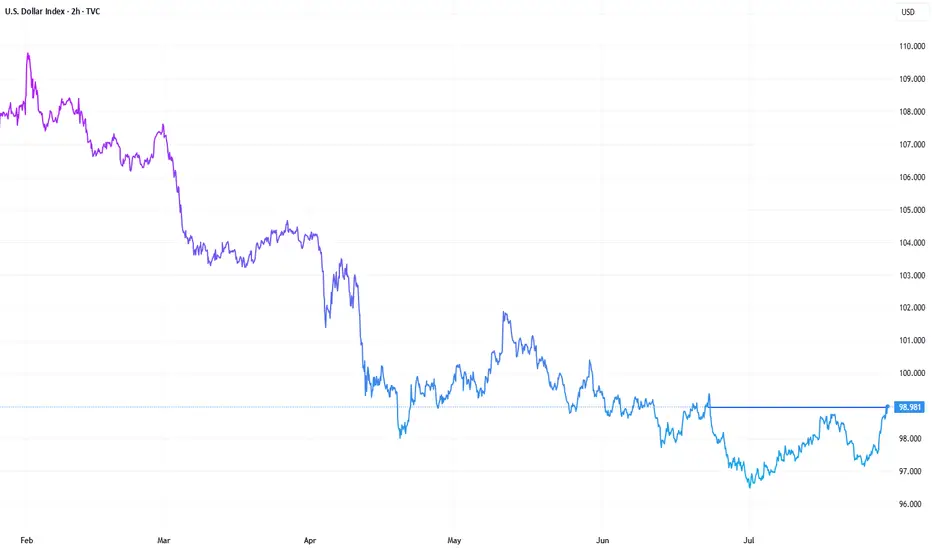
What now for the dollar after a poor NFP report?It is difficult not to link the bad US data to the impact of tariffs. Indeed, it certainly looks that way, especially given that the slowdown in jobs started in early Q2 when reciprocal tariffs were announced. Companies expecting margins to be squeezed by higher duties probably thought twice about hiring workers in order to keep costs down. So, the US labour market has been losing steam fast, undoubtedly due to tariff concerns. Unless the data surprises on the upside soon, the Fed may have no choice but to cut—and cut again. Against this backdrop, the recovery in the dollar is going to a long bumpy road.
We noted the area around 100.00 to be resistance in the previous update, and that level has held, thanks to the weak jobs report (and ISM survey that was released later). The DXY was testing potential support around 98.95 at the time of writing. Will it be able to bounce there? Break that on a closing basis and next week could bring more technical dollar selling.
By Fawad Razaqzada, market analyst with FOREX.com
Close out the Week STRONGLooks like price has found its bottom and is ready to push from here. We are looking for a strong forceful break out from this zone so we can go for the higher levels. Everything looks right from here and value keeps shifting up. I know we should get a solid entry but waiting for it to line up with time.

Dollar Index (DXY): Will It Rise More?!
Dollar Index is on its way to 100.4 resistance.
A breakout of a major supply cluster on a daily after FED meeting
yesterday indicates a strong bullish pressure.
I think that growth will continue soon.
❤️Please, support my work with like, thank you!❤️

USDZAR Bullish ideaAs we can see this is our USDZAR quarterly shift idea were we are anticipating price to rally to the upside toward our draw on liquidity objectives. We had a weekly volume imbalance and monthly mean threshold order block show us support after we took out major liquidity points. We also showed more support on our daily FVG and a market shift taking place after a displacement. We are anticipating a rally for USDZAR and will be looking to see how price plays out.
USDZAR is an exotic pair that is part of the emerging markets and emerging markets/exotic pairs can usually lead ahead of major forex pair or lag between major forex pairs so this can also help us with our intermarket analysis of forex pairs when determining our dollar strength against other basket currencies.

You've Already Lost: The Bitcoin Delusion of FOMO and False HopeLet’s get one thing straight: if you’re staring at Bitcoin, squinting past the red flags, and convincing yourself it’s not a Ponzi scheme because of that one shiny feature that screams “legit,” you’re not investing—you’re auditioning for the role of “next victim.” And if your motivation is the fear of missing out (FOMO) or the fantasy of getting rich quick, well... congratulations. You’ve already lost.
The 99%: Red Flags Waving Like It’s a Parade
Let’s talk about the indicators—the ones that make Bitcoin look suspiciously like a Ponzi scheme. No, it’s not technically one, but the resemblance is uncanny:
- No intrinsic value: Bitcoin isn’t backed by assets, cash flow, or a government. It’s worth what the next person is willing to pay. That’s not investing. That’s speculative hot potato.
- Early adopters profit from new entrants: The people who got in early? They’re cashing out while newcomers buy in at inflated prices. That’s the classic Ponzi dynamic: old money out, new money in.
- Hype over utility: Bitcoin’s actual use as a currency is minimal. It’s slow, expensive to transact, and volatile. But hey, who needs functionality when you’ve got memes and moon emojis?
- Opaque influencers: From anonymous creators (hello, Satoshi) to crypto bros promising Lambos, the ecosystem thrives on charisma, not accountability.
- Scam magnet: Bitcoin has been the currency of choice for over 1,700 Ponzi schemes and scams, according to a University of New Mexico study cs.unm.edu . That’s not a coincidence. That’s a pattern.
The 1%: The “But It’s Decentralized!” Defense
Ah yes, the one redeeming quality that Bitcoin evangelists cling to like a life raft: decentralization. No central authority! No government control! It’s the financial revolution!
Except… decentralization doesn’t magically make something a good investment. It just means no one’s in charge when things go wrong. And when the market crashes (again), you can’t call customer service. You can tweet into the void, though.
FOMO: The Real Engine Behind the Madness
Let’s be honest. Most people aren’t buying Bitcoin because they believe in the tech. They’re buying because they saw someone on TikTok turn $500 into a Tesla. FOMO is the fuel, and social media is the match.
Bitcoin’s meteoric rises are often driven by hype cycles, not fundamentals. Tesla buys in? Price spikes. El Salvador adopts it? Price spikes. Your cousin’s dog walker says it’s going to $1 million? Price spikes. Then it crashes. Rinse, repeat.
This isn’t investing. It’s gambling with a tech-savvy twist.
The Punchline: You’ve Already Lost
If you’re ignoring the overwhelming signs of speculative mania and clinging to the one feature that makes you feel better about your decision, you’re not ahead of the curve—you’re the mark. And if your motivation is “I don’t want to miss out,” you already have. You’ve missed out on rational thinking, due diligence, and the ability to distinguish between innovation and illusion.
Bitcoin might not be a Ponzi scheme in the legal sense. But if it walks like one, talks like one, and makes early adopters rich at the expense of latecomers… maybe it’s time to stop pretending it’s something else.
INDEX:BTCUSD NYSE:CRCL NASDAQ:HOOD TVC:DXY NASDAQ:MSTR TVC:SILVER TVC:GOLD NASDAQ:TSLA NASDAQ:COIN NASDAQ:MARA

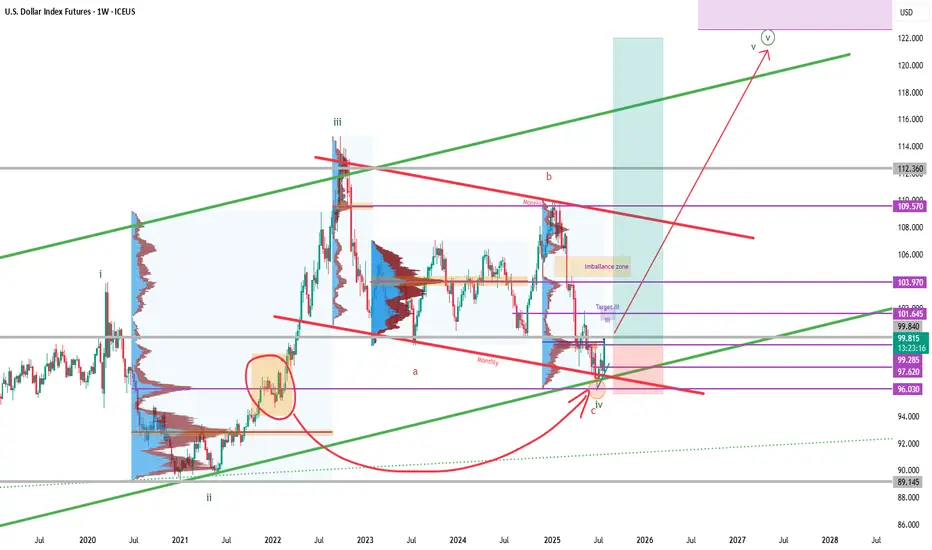
DXY - Dollar Index - Potenzial New Long phase
As we see in the chart .. in 2022 december we had a big volume accumulation before the october 2022 top to 112
After that we had a rebound and a laterality from sep. 22 to july 25.
In this moment we touche this volume and from my point of view we completed an ABC pattern.
Probably we have completed the pattern with a final Impulsive wave C and in this moment we start the final LONG wave 5
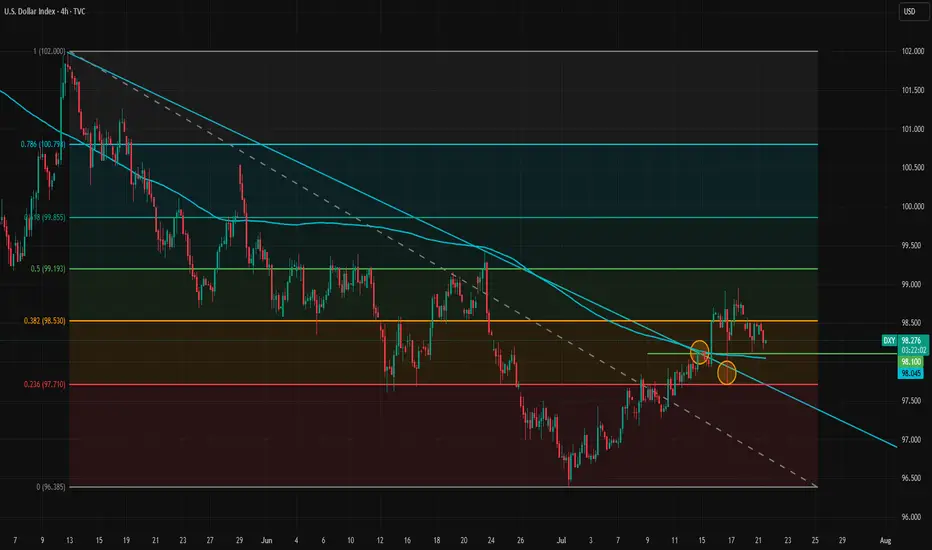
Fundamentals Support Dollar’s Potential Trend ReversalThe dollar appears to be reversing its direction on the 4-hour timeframe. The trendline has been broken and retested twice, but the dollar has held above it, signaling a potential shift in momentum.
Despite intense pressure from the White House on the Federal Reserve, the data is likely to prevent the Fed from cutting rates at the upcoming meeting and possibly at the one after that. A potential rate cut in September will largely depend on incoming inflation and labor market data.
The inflation impact of tariffs became more visible in the latest CPI report, but the effect is still relatively modest. This aligns with our theory that tariff-driven inflation will build gradually and persist over a longer period, rather than cause an immediate spike.
Meanwhile, the labor market has not shown clear signs of rapid weakening, so there is no strong case for a rate cut from that side either. The Financial Conditions Index also indicates that monetary policy remains on the accommodative side. Bloomberg financial conditions index is at highest level since March.
As markets increasingly recognize that no rate cuts are likely in the near term, and with the August 1 tariff deadline approaching amid potential rising risks of trade tensions between the U.S. and the EU, the dollar may gain further support. The U.S.–EU bond market spread also does not favor a stronger euro at the moment, adding to the dollar's upside potential.
In the short term, 98.10 and 98.53 are immediate support and resistance levels. If the dollar breaks above 98.53 again, upward momentum may strengthen and open the path toward the 100 level.
WE GOT THE SWEEP ON GOLD!!!!THIS is the move I was waiting for! we got the full sweep on levels. looking for price to flip back to bullish pressure from here. Now we just wait for the entry to show as we move into the Asian Killzone.

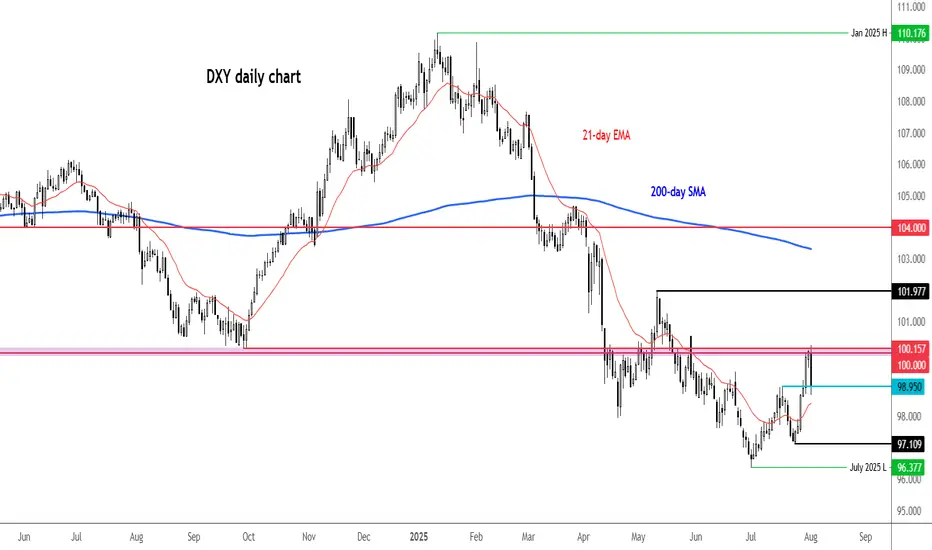
DXY with interest rates With interest rates remaining steady, the U.S. Dollar is currently moving in a bullish direction.
As shown in the chart, it seems likely that price will break the previous high and form a bullish Quasimodo (QM) pattern. The price may then reach the 50% Fibonacci level.
After that, we should wait and observe the market's reaction.
If price gets rejected from the 103 zone — especially if accompanied by a rate cut or bearish price action — we could see a sharp decline toward the 95 area.
This 95 zone also aligns with a key weekly Fibonacci support level on the Dollar Index.
As long as the Federal Reserve maintains its hawkish stance, the U.S. Dollar may continue its upward momentum. However, the 103–104 zone — which aligns with the 50% Fibonacci retracement and a significant supply area — could serve as a strong resistance.
If price gets rejected from this area and we simultaneously see signs of a rate cut or weakening U.S. economic data, a trend reversal and corrective phase could begin. In that case, lower targets around 95 or even 93 could become likely in the medium term.
good luck

USDJPY Setup: Prime Buy Zone with a Clear Target!Good morning my friends,
I've prepared a fresh USDJPY analysis just for you.
Currently, the most logical buy zone sits at 147.170. If price reaches this level and performs a retest, it’s likely to target the 149.185 level.
I'll personally be entering at 147.170 and waiting for my target: 149.000.
This setup is based on the 4-hour timeframe, so it may take some time to reach the target.
Every single like you give is a major source of motivation for me to keep sharing these analyses.
Thanks so much to everyone supporting with a like!

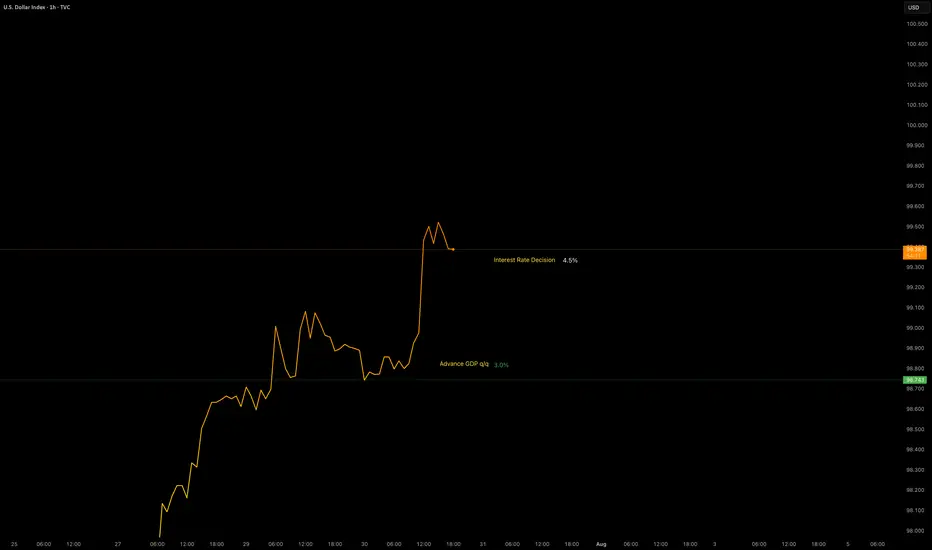
Data Release - Interest Rate DecisionJul 30 2025: Interest Rate Decision (4.5%)
Rates remain unchanged as expected.
OANDA:XAUUSD remains bearish with the help of GDP data.
TVC:DXY remains bullish with the help of GDP data. No major changes in either pairs.
Volatility is increased.
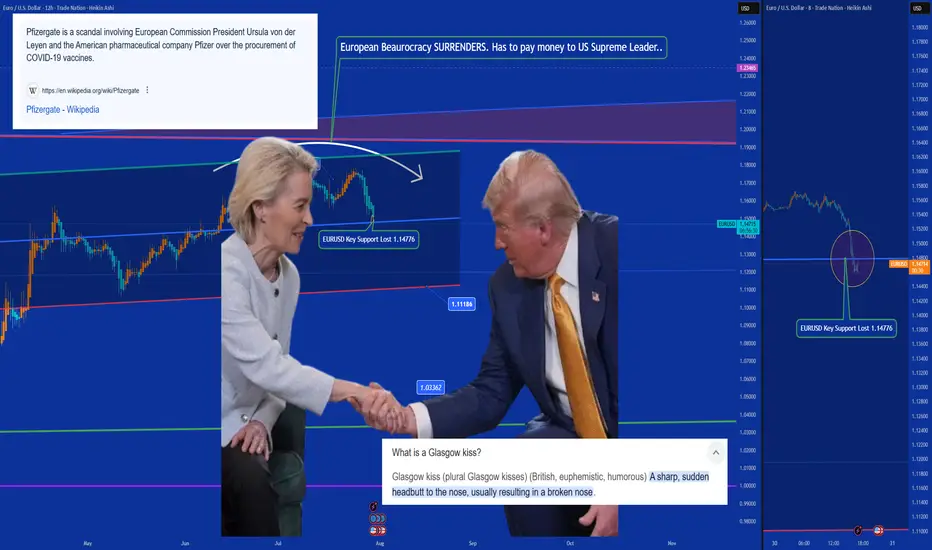
Ursulization = Bureaucracy > Democracy (a.k.a. The Glasgow Kiss)🤝💥 Ursulization – Bureaucracy Replaces Democracy (a.k.a. The Glasgow Kiss) 🇺🇸🇪🇺
📍Background:
The media spun it as a "15% tariff agreement"…
But in reality, this wasn’t diplomacy — it was a disguised capitulation.
And the stage? None other than Scotland, ancestral ground of Donald J. Trump.
So when Ursula von der Leyen came seeking a gentle diplomatic handshake…
What she received instead was the infamous Glasgow Kiss — sudden, sharp, and unmissable.
💥 What’s a Glasgow Kiss?
A British slang term for a violent headbutt to the face —
No grace. No warning. Just raw force.
💬 The Real Story:
Ursula von der Leyen — unelected, unaccountable —
signed off on $1.4 trillion in U.S.-bound capital flows:
💸 $750B to buy American energy
🛠 $600B in U.S. infrastructure, defense & industry
All to sidestep 50% tariffs the Trump team had ready to roll.
But here's the kicker:
She wasn’t acting on behalf of European citizens.
She was speaking for the bureaucracy, not the people.
🔥 Welcome to Ursulization:
Where democracy is sidelined by unelected power.
Where negotiations happen in silence.
Where scandals like PfizerGate get buried while the euro breaks down.
📉 EUR/USD just lost key support at 1.14776 —
The chart shows t he cost of surrender.
💉 PfizerGate Reminder:
Ursula already faced heat for secretive vaccine contracts with Pfizer.
Now, she’s handing over Europe’s industrial backbone —
To Trump. In Scotland. With no public mandate.
📌 Conclusion:
Trump didn’t compromise — he collided.
Europe didn’t resist — it surrendered.
This wasn’t diplomacy.
It was a Glasgow Kiss — a collision between legitimacy and bureaucratic power.
👑 One elected by the people (Trump). One not elected at all (Woke agenda style Ursula).
💰 One walks away with trillions (Trump). The other, with silence (Ursula 'Von der Pfizinen never electenen'').
One Love,
The FXPROFESSOR 💙
ps. Till we can bring Democracy and Europe back.
Disclosure: I am happy to be part of the Trade Nation's Influencer program and receive a monthly fee for using their TradingView charts in my analysis. Awesome broker, where the trader really comes first! 🌟🤝📈
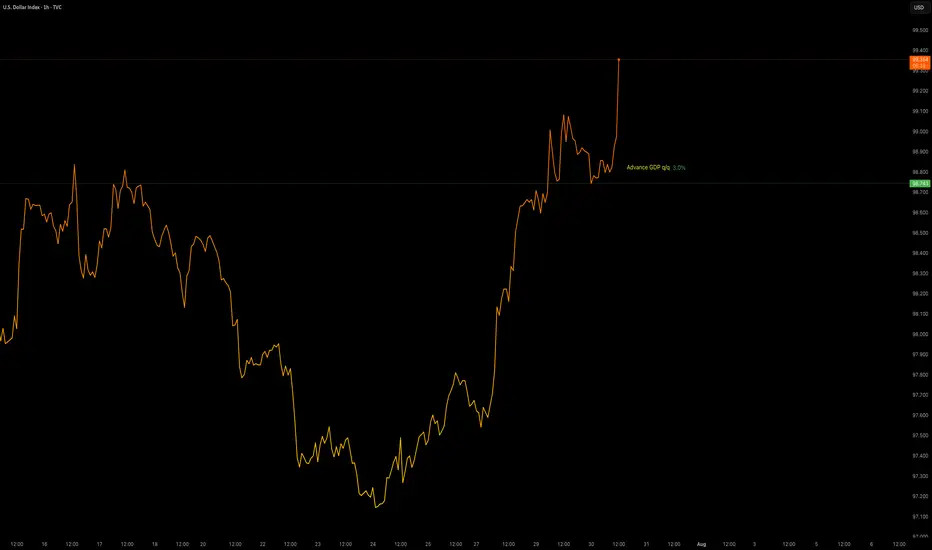
Data Release - Advance GDP q/q (3.0%)Jul 30 2025: ADVANCE GDP q/q (3.0%)
OANDA:XAUUSD sees some downside pressure with positive GDP data.
TVC:DXY gaining strength.
Volatility is increased. This data will be used with Interest Rate Decision later in the day to provide a XAUUSD insight.
Gold Contract Rolled!Now that the contract rolled We might get a bit more movement. Yesterday was nothing but a giant flag. I want to see price go sweep levels before turning full on bullish. We must keep in mind that we are at the end of the month as well. so price can end up stalling till next week. but tomorrow there is a lot of News pending. So that can really shake things up.

The euro extends sharp losses following the US-EU tariff deal
The euro weakened sharply against the dollar amid views that the US-EU tariff deal favors the US. European leaders voiced mixed reactions. Germany’s Chancellor Merz welcomed the agreement as a safeguard against economic damage, while Hungary’s PM Orbán criticized it as a one-sided win for the US. Meanwhile, the IMF raised its eurozone growth forecast from 0.8% to 1.0% in its July outlook, citing the lower-than-expected tariff levels as supportive of the region’s economy.
EURUSD broke below the ascending trendline and briefly tested the support at 1.1520. EMA21 has death-crossed EMA78, indicating the potential extension of bearish momentum.
If EURUSD fails to hold above the support at 1.1520, the price could decline further toward 1.1450. Conversely, if EURUSD breaches above the resistance at 1.1590, the price may gain upward momentum toward 1.1640.

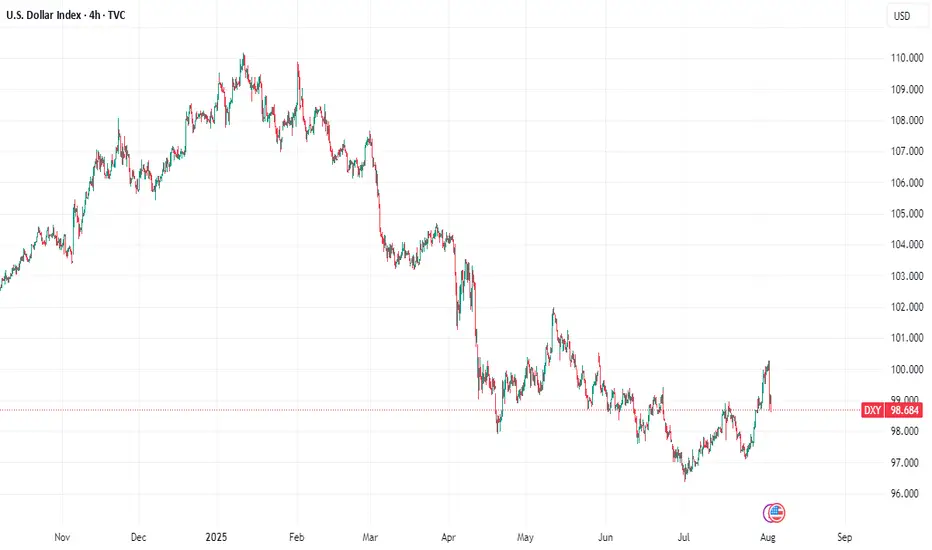
US Dollar Index: Down YTD, But at a 5-Week HighThe U.S. dollar plays a leading role in the performance of U.S. stocks versus international stocks. The greenback endured its worst first-half performance since 1973, helping ex-U.S. equities post massive absolute and relative gains through June. But could the narrative be shifting? And what might it mean for investors?
The U.S. Dollar Index (DXY) sits at a five-week high ahead of the July Federal Reserve interest rate decision and the key July jobs report to be released on August 1. Up four sessions in a row, the dollar appears poised to post its best month since last December (in fact, the DXY's first positive month of 2025). If it’s the start of a protracted recovery, then the “U.S. exceptionalism” trade could be back in vogue over the second half, resulting in the same old story of U.S. over international in the stock market.
Should You Still Sell Your USD for EUR? A 2025 PerspectiveWith currency markets in constant flux, the decision to hold USD or convert to EUR carries major financial implications for investors, expatriates, businesses, and frequent travelers. As of July 29, 2025, the USD/EUR exchange rate is around 0.86–0.87, with $1 buying roughly €0.86. Is now the right time to sell your US dollars for euros? Here’s a balanced look at the latest data and forecasts.
Current Market Context: Dollar Weakness and Euro Stabilization
USD Slide in 2025: The US dollar has experienced its steepest decline in over three years, falling nearly 10% year-to-date. This sustained weakness is attributed to policy volatility, capital flowing out of the US, and narrowing interest rate differentials.
Key Exchange Rate: Recent rates hover between 0.85 and 0.87, representing moderate stability following a period of volatility.
Euro’s Resilience: While the euro has had its own struggles, from slower economic growth to political uncertainty in Germany and France, analysts forecast no major sustained fall for the euro through 2025.
2025 Forecasts: USD/EUR Direction—What Do the Experts Say?
Year-End 2025 Outlook: Major banks and forecasting firms expect the EUR/USD rate could climb even higher by year-end, meaning the euro could gain modestly versus the dollar if current trends continue.
Factors to Watch:
Fed Rate Cuts: Potential US rate cuts in Q3–Q4 remain a key driver for further USD weakness.
Trade & Tariff Uncertainty: Ongoing US tariff announcements and global trade tensions add volatility but also support safe haven flows to the dollar.
Eurozone Politics: Any resolution of political uncertainty in Europe could buoy the euro.
Most Important One: Fed's Money Printer...
Strategic Considerations: Should You Sell Now?
Locking in Current Rates: If you need euros to make payments, pay salaries, or make investments in the short term, converting a portion now could reduce your exposure to further USD downside.
If You Can Wait: Analysts see some chance for USD recovery in late Q3 or early 2026, but this is contingent on US policy stability and Fed decisions.
Averaging In: For larger transfers, consider splitting your transaction over time (also called dollar-cost averaging), which can help mitigate volatility.
Bottom Line
If you have an immediate need for euros, current rates present a reasonable opportunity. The dollar’s weakness throughout 2025 is well documented, but much of the pessimism may already be priced in. If you’re flexible with timing, monitor central bank policy signals throughout Q3/Q4, a more dovish Fed or unexpected eurozone stability could push rates further in your favor, but event risks remain elevated. Ultimately, a phased or hedged approach may offer both protection and potential upside
*not investment advice*
#forex #fx #dollar #usd #euro #eur #economy #trade #tariff #trading #indicator

US05Y Bullish ideaWe can see we had rejection after taking out our sell side liquidity and balancing our daily fair value gap. We are still showing strength in the bond market as well with the dollar index. Our DOL is to the upside in the form of buyside liquidity and our daily volume imbalance at 4.073%.
* Fundamentals: We are having a rise in inflation and a stronger interest rate of the dollar against most of the major basket currency pairs, which in the longer term should potentially see us get a stronger dollar and an increase in our bond yields.

Will DXY Get Supported With Fresh US-EU Trade Agreement?Macro approach:
- The US dollar index has traded mixed since last week, pressured by lingering trade uncertainty and cautious market sentiment ahead of major economic events.
- Dovish Fed expectations and subdued US inflation continued to weigh on the greenback, while news of a fresh US-EU trade agreement and upcoming talks with China contributed to two-way price action.
- Economic data reflected a resilient labor market but flagged moderating US growth, with investors closely watching forthcoming GDP figures and the Fed's policy stance.
- The US dollar index may remain range-bound as markets await catalysts, including the Fed meeting, the 2Q GDP release, and key labor market data.
Technical approach:
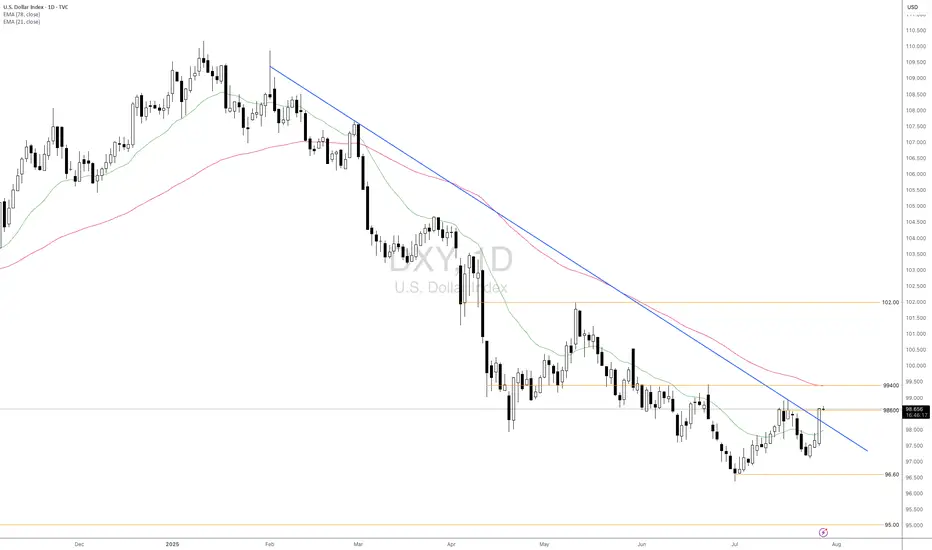
- DXY surged and closed above the descending trendline and the resistance at around 98600, indicating an early signal of a shift in the market trend.
- If DXY maintains above 98600, it may retest the following resistance at 99400, confluence with EMA78.
- On the contrary, closing below the descending trendline and EMA21 may prompt a retest of the swing low at 96.60.
Analysis by: Dat Tong, Senior Financial Markets Strategist at Exness
Has gold Bottomed Out? Will the Bullishness continue from here?Looking for the bullish activity to continue from here but need to see a sweep and reject of the Previous daily Low before I want to get active. This would give confirmation that the price want to continue with this bullishness.

DXY: USD Flexes Muscle - Pairs SlideFriday, July 25, 2025
The foreign exchange markets are experiencing a pronounced USD bullish session this morning, with the US Dollar Index (DXY) showing robust gains of +0.35% while simultaneously pressuring all major currency pairs into negative territory. The Japanese Yen (JPY) is bearing the brunt of this dollar strength, currently registering losses between -0.4% to -0.66% across JPY pairs. This market behavior suggests traders should pay particularly close attention to DXY dynamics, as its movements will likely dictate price action across all major currency pairs in today's session.
Technical Perspective: DXY at Critical Inflection Point
A detailed examination of the Dollar Index reveals several compelling technical factors that market participants should consider:
1. Weekly Demand Zone Reaction
- The DXY has demonstrated a strong rejection from a significant weekly demand area
- The subsequent bullish spike indicates potential continuation of upward momentum
- This price action suggests institutional buyers are defending this key level
2. Commitment of Traders (COT) Report Insights
Non-commercial traders (typically hedge funds and speculators) have increased their positions from a bottom level not seen since June 2021 meanwhile the Commercial traders (often corporations hedging FX exposure) show opposing extreme positioning. This stark divergence between trader categories often precedes significant market moves
3. Seasonal Patterns Favor USD Strength
- Historical seasonal analysis indicates the current period typically supports dollar appreciation
- The combination of technical and seasonal factors creates a potentially powerful bullish setup
✅ Please share your thoughts about DXY in the comments section below and HIT LIKE if you appreciate my analysis. Don't forget to FOLLOW ME; you will help us a lot with this small contribution.

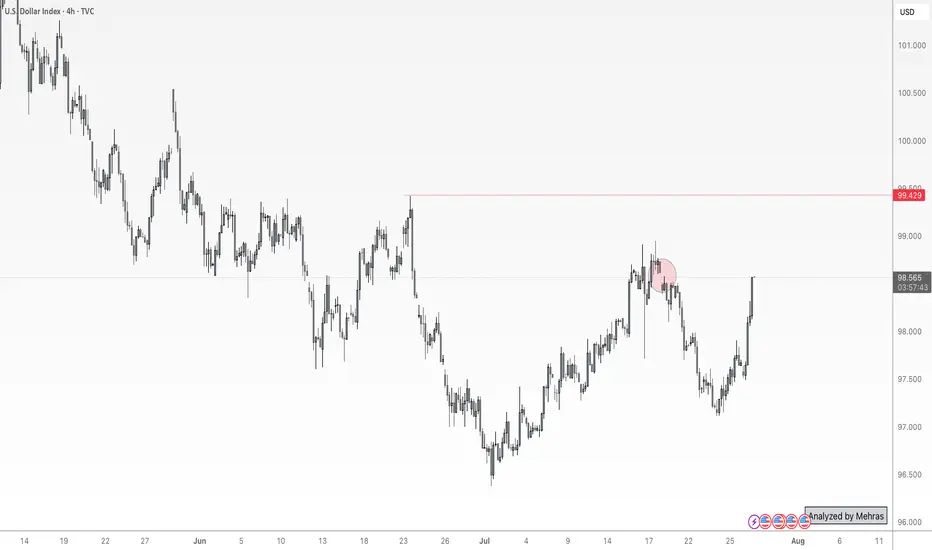
DXY at Its Most Critical Level of 2025 — Will the 100 Bank LevelThe Dollar Index (DXY), just like several other majors, is approaching a very important level. We’re now near the 100 mark, which is not only a psychological level — but also a key institutional (bank) level.
There’s also a gap zone left behind that price is about to fill. I believe the index will stay in a range over the next 1–2 days as it waits for critical data later this week — especially Wednesday’s announcements and Friday’s NFP report, which could set the tone for what’s next.
Based on current market sentiment, Trump’s remarks, Powell’s upcoming speech, and broader macro factors, I believe DXY has the potential to break above 100 and move toward 102–104, if that level is broken cleanly.
Let’s also not forget — price bounced from a monthly demand block near 96, and we’re seeing weak support across majors like EUR and Gold. That adds confluence for potential dollar strength.
📌 What do you think — is dollar strength just around the corner?
🔁 This analysis will be updated whenever necessary.
Disclaimer: This is not financial advice. Just my personal opinion.