Dollar Currency Index, The places for Sell!I show you the best Sell places. I choose to sell it because the global trend is bearish.
The best pattern to enter the position will be a huge candle. If the price will approach slowly it will be better to wait and watch.
Push like if you think this is a useful idea!
Before to trade my ideas make your own analysis.
Thanks for your support!
Dollar-index

USDJPY H4 - Short SetupUSDJPY H4 - Nice Double top in sight, rejections of 106.300 would be ideal, two heavy monthly key levels and a week, local H4 resistance, should see a reaction at 106.300 price for hopefully this bearish USD downside continuation after a recent relief rally.

DXY H4 - Short SetupDXY H4 - Another week of USD weakness. Clear downtrend seen here on dollar index, other pairs such as USDJPY, USDCHF following very similar suit.

DXY Bearish View by ThinkingAntsOk🔸 4H CHART EXPLANATION:
.
.
🔸Price bounced at the Resistance Zone.
.
🔸After that it broke the Trendline of the Corrective move.
.
🔸Now it is facing the Previous low, so, we are waiting for a brekout of this level to confirm the view.
.
🔸 Will look for a lower timeframe bearish setup.
🔸 DAILY CHART ANALYSIS:

SPX500/USD (July 5)On the lower time frames we have broken an ascending channel and price also rejected and formed a double top. Price has huge potential to the downside: the beginning of the lower time frame channel, the longer wider ascending channel support, and the beginning of the whole structure.


GBPUSD - 2 High probability areas to SHORT2 high probability areas of interest to SHORT. Will wait to see how price reacts around those levels and then jump in.

💵 Dolla Dolla Bills Y'all. (DXY)😯 The almighty usd is at a critical point of Resistance as it compresses for a major move.
The green triangle is your zone of compression. I analyzed this chart not too long ago and spoke about how this Resistance level would be a strong level. We continue to fight as the monthly and 2 month start to compress and shift red with the ema dots indicator below. Once the support or resistance on the triangle breaks that will show you the next multi year cycle of where the dollar wants to go. Breaking down would result on a lower low and a lower high on the major view of dxy.
It almost resembles the same patter from 1986 to the early 2000s, a massive cup pattern.
A breakout to the upside would be extremely bullish.
Major long term support is the green arrow on the bottom of the long term downward channel that we are currently in. Keep on printing that mooolahh 🤔
Hope this helps! Have an awesome trading week! 🥳
🥇MLT | MAJOR LEAGUE TRADER

DXY to rise later this weekDXY technically is sitting on the critical support level and it seems to be gaining power from it to climb towards the resistance level. It is currently at the oversold position in terms of several indicators.
FED's decision on interest rate will be decisive for the path of the US dollar index.
Note: Interest rate seems to be staying constant.

U.S Dollar Index (DXY) Bearish View by ThinkingAntsOk🔸 4H CHART EXPLANATION:
.
.
🔸 Price is moving on a range.
.
🔸 At this moment, it is facing the Ascending Trendline of the consolidation.
.
🔸 If it is broken, then it has potential to reach the Support Zone.
.
🔸 Will look for a lower timeframe bearish setup once the direction is confirmed.
🔸 DAILY CHART ANALYSIS:

Bullish piercings at yearly openRed line is 2019 close (2020 open).
Considering we are above Kumo cloud both on daily and monthly plus having 2 bullish piercing patterns on daily - price should keep rising.
Price is also making higher lows on daily.
Also observe - price formed massive diamond bottom bullish reversal pattern on daily since Dec 2019.
It means dollar will strengthen as USDCHF is correlation "clone" of dollar index (DXY).
For educational purposes only.

USDOLLAR's EMAs Reverse on Daily timeFurther to our previous article , FXCM's USD index, USDOLLAR, has reversed its technical makeup. The EMAs are looking to turn negative (green ellipse). If the EMAs develop angle and separation to the downside the green 5-day EMA will be below the orange 13-day EMA, and the orange 13-day EMA will be below the black 34-day EMA. This will be a testament to the Fed's unlimited QE policy, which is looking to devalue the greenback. As long as the USDOLLAR continues to churn sideways the EMAs will continue to whipsaw. We will watch the situation for a trend to develop; this which will make price action clearer.

Dollar Index hits support (cf. EURUSD)Dollar hit Monthly Pivot, trend-line support and May R3 reversal level (May top value zone - now support)
Price is likely to reverse here and since dollar broke May roof it will proceed to May R5 (I marked the target).
For educational purposes.

Dollar rally coming...Fractal pattern from 1990s in play again. Though this pattern seems to be of bigger scale, so the move might be bigger.
We should see a vertical rally for several weeks to the last swing high with continuation.

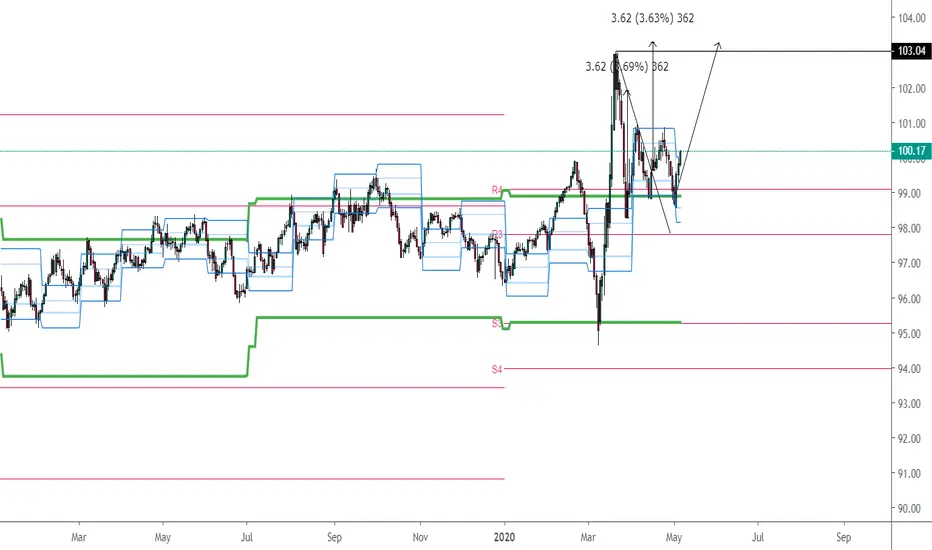
Dollar set to break 2016 highDollar is set to break 2016 high.
This I can conclude from multiple confluence: halfyearly A-pivot breakout, Wolfe projection, dragon pattern projection, DeMark gap breakout, DeMark breakout projection confluence, Camarilla monthly R4 roof breakout, false test of the last LL and Woodies pivot projection´s confluence with 2016 high.
DeMark breakout projection coincides with last Month Woodie R1.
Wolfe projection gives us the speed of the move - by May 19 price should reach Wolfe projection.
Woodies R4 tells us from dragon will draw its tail (as it was with yields and bonds in March - their collapses stopped at Woodies R4).
Dollar will stop at Dragon´s 0.61 FIB (usually price ranges here) - before Quarterly A-Pivot (usually price stalls before this pivot ) breakout.
Because Dollar is set for a rapid move up, there is likelihood gold might fall - usually they are negatively correlated (though recently they trended up together).
Most markets will go red, everything that is pegged to dollar including crude oil. We are likely to see rapid falls in SP500 , EUR, GBP (GBP is gonna fall faster than EUR - see my EURGBP analysis), NZD (rising wedge bearish continuation pattern) and BTCUSD (Bitcoin reached its ultimate daily Kumo cloud resistance area from where we are likely will see a drop).

DXY AnalysisPotential triple top forming on the dollar index. If we see a rejection from this third top then we will see some dollar weakness across the board.

Dollar index: dragon patternI have been posting this gap breakout earlier but now, after adding half yearly opening range and A up pivot breakout, things become more clear.
Dragon pattern. Dragon head, 2 humps and now a long tail started to form. It will go up to the target and will draw waving dragon's tail-end there.
Look up for dragon pattern on google to understand.
For educational purposes.
Dollar might flyAfter applying half yearly ACD to Dollar Index a breakout becomes clearly visible..
In cases of of A pivot breakout on half yearly ACD , moves are often massive.
Triangle or pennant continuation pattern is visible at the A-pivot breakout level.
Price is likely to move the size of a pennant pole at least.

DXY - Gold negative correlationJohn Murphy in his classic on "Intermarket Analysis" writes on the dollar gold negative correlation.
Here we compared DXY - Gold correlation on daily chart in regard towards 200 day average.
If you will take closer look, you will see that in case of divergences forming, it is dollar index that usually fails.
If gold breaks resistance (being in sharp uptrend towards 2011 highs) and we do observe some sort of bullish cup and handle continuation pattern - dollar is likely to fall.
By DeMark criteria, bullish breakout on gold looks better than the one on dollar index.
On correlation cofficient, we are also observing ever decreasing divergence trend towards 200 day average.
At any case one of two should fail in uptrend:)

Dollar Index AnalysisDouble top pattern on the dollar index. A breakout from the neckline would suggest downside and some dollar weakness across the board. Alternatively, we could be witnessing a fake-out. On the daily time frame, there are multiple confluences around the next support level including a 200day MA, key fib level while also being at a key psychological level. Either way, we will look for confirmations to confirm the future direction rather than being predictive it is best to become reactive to market information.

Dollar IndexDollar Index correlates with US 10 yrs bond yields.
It looks like dollar will be crawling up slowly.
Those rejection shadows usually mark a failed breakdown.
The collapse in US treasury yields weakened the dollar.

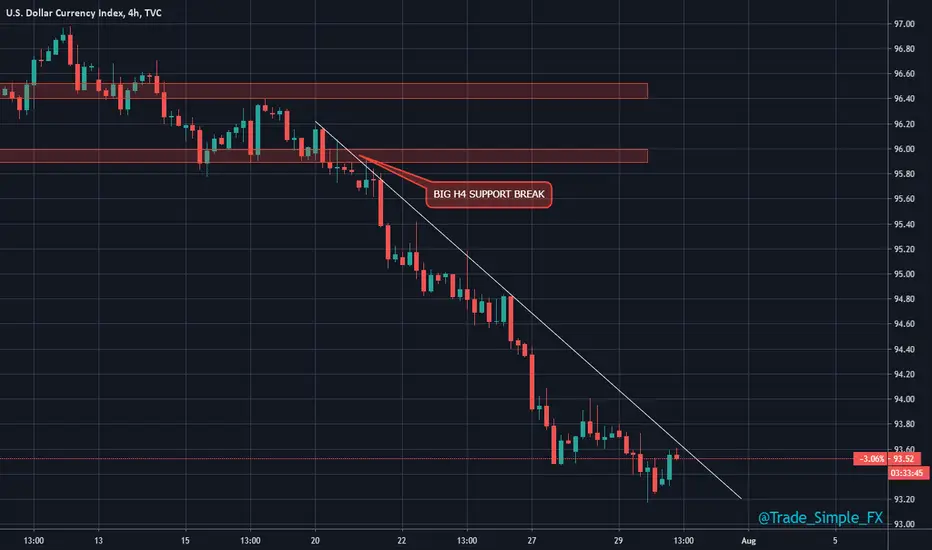
U.S Dollar Index Bearish View by ThinkingAntsOk🔸 4H CHART EXPLANATION:
.
🔸 Price broke the Ascending Trendline.
.
🔸 It has been consolidating for the last month.
.
🔸 It has bounced at the Resistance Zone with a strong rejection, so, we expect a breakout of the trendline and a downside move towards the Support Zone.
.
🔸 Will look for a lower timeframe bearish setup.
🔸DAILY CHART ANALYSIS:
