Fundamental Market Analysis for June 30, 2025 USDJPYThe USD/JPY pair is attracting some sellers towards 143.85 during the Asian session on Monday. The U.S. dollar (USD) is weakening against the Japanese yen (JPY) amid rising bets for a Federal Reserve (Fed) interest rate cut.
The United States (US) and China are close to a deal on tariffs. However, U.S. President Donald Trump abruptly ended trade talks with Canada, adding uncertainty to the market's positive outlook.
In addition, traders are betting that the U.S. central bank will cut rates more frequently and possibly sooner than previously expected. Markets estimate the probability of a quarter-point Fed rate cut at nearly 92.4%, up from 70% a week earlier.
On the data side, the personal consumption expenditure (PCE) price index rose 2.3% in May, up from 2.2% in April (revised from 2.1%), the U.S. Bureau of Economic Analysis reported Friday. This value matched market expectations. Meanwhile, the core PCE price index, which excludes volatile food and energy prices, rose 2.7% in May, following a 2.6% increase (revised from 2.5%) seen in April.
On the other hand, the Bank of Japan's (BoJ) cautious stance on interest rate hikes could put pressure on the yen and create a tailwind for the pair.
Trade recommendation: SELL 143.50, SL 144.30, TP 142.40
Dollar-yen

Fundamental Market Analysis for April 2, 2025 USDJPYThe Japanese Yen (JPY) fails to capitalise on the previous day's modest gains against its US counterpart and attracts fresh sellers during Wednesday's Asian session. The USD/JPY pair, however, remains in the range it has been in since the beginning of this week as traders await a new catalyst before positioning for the next leg of directional movement. As such, attention will remain focused on US President Donald Trump's announcement of retaliatory tariffs later today.
Meanwhile, speculation that the slowdown in the economy caused by the tariffs may force the Bank of Japan (BoJ) to keep policy steady for now is undermining the yen. However, investors seem convinced that the BoJ will continue to raise interest rates amid signs of rising inflation in Japan. This is a significant divergence from the growing confidence that the Federal Reserve (BoJ) will resume its rate-cutting cycle in June, and should support the lower-yielding Japanese Yen.
Trade recommendation: SELL 150.00, SL 150.90, TP 148.60

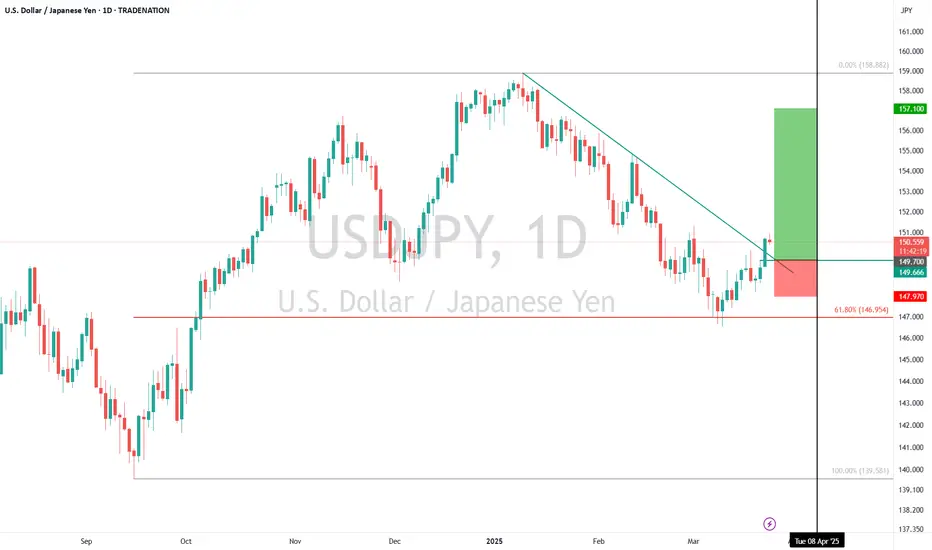
USDJPY Buy Setup – Breakout Confirmation & Seasonal TailwindTechnical: USDJPY has broken above a downtrend resistance line after finding support at the 61.8% Fibonacci retracement level at 146.95 . This breakout suggests the corrective phase may have ended, signaling potential for further upside. Pullbacks toward 149.70 (a retest of the broken trendline) present an attractive entry opportunity. Upside targets are 152.74 and 157.10 in the short to medium term. The setup is invalidated below 147.97 , with a break below 146.33 negating further bullish expectations.
Fundamental: Commercial selling of the Japanese Yen and renewed dollar purchases indicate a shift favoring USD over JPY, supporting the bullish technical outlook.
Seasonal: Over the past 25 years , USDJPY has risen 76% of the time between March 25 – April 8 , with an average gain of 1.04% .
Trade Idea:
Entry: On pullbacks toward 149.70
Stop Loss: 147.97 (or 146.33 for extended risk management)
Targets: 152.74 and 157.10
Disclosure: I am part of Trade Nation's Influencer program and receive a monthly fee for using their TradingView charts in my analysis.
USDJPYThe Yen strength coupled with the Dollar consolidation has finally played out into the larger wave-C of 2 and the first target.
December-March likely provides the primary turn back up, and as such will provide the backdrop to whether price can reach the extension target or not over the next couple of months.
Overall, the USDJPY is targeting the 300-400 range by 2027-2029 and an important trend for recalibrating assets.

Build your crypto shortsWhat will happen to crypto in the near future?
DXY looks like it will go up in the short term, VIX is spiking up again.
This is could be an indication for much lower prices.

AUDJPY IndecisionThis price has been having a bearish momentum and for the last day, there was a doji candle, which indicates an indecision.
I anticipate that the momentum will continue, provided that the candlestick that follows next does not close above the doji candle.
An analysis using a smaller timeframe will follow.

Usd/Jpy Weekly Outlook Must watch!!I have analyzed why USD/JPY is repeating a similar pattern from 2022, and it's likely that we could see the same reaction.
Please watch the video and share your thoughts.
Follow for more breakdown!!

USDJPY: Why It Dropped? 🇺🇸🇯🇵
This morning, USDJPY dropped by more than 500 pips this morning.
If you are looking for a reason why it happened,
remember that historical structure always leaves clues.
The price perfectly respected a historic structure of 1990th.
Today, we see a perfect example how important are historical levels,
and how the market remembers the things that happened more than 30 years ago.
Learn key levels because that is the key for successful trading.
❤️Please, support my work with like, thank you!❤️

Monthly supportThe pair just landed on a monthly support. It makes sense, the dollar index is also landing on an important demand area and the JYP is losing value. Check my previous post about this pair in the monthly timeframe. I just opened a long position, I will accumulate on the upcoming days.

USDJPY : Trend is bullish above 129.60As we can see from the chart above, the previously shared analysis hasn't changed (see chart below). From a technical point of view, we have considered the idea of a potential bullish swing developed with at least 3 legs, such as ABC for example )without excluding an impulsive structure 12345 with Target above the previous Top).
Now, instead of following the pair on the weekly chart as we did previously, let's try to show the first 2 potential Target Areas:
- 140.00 (Target 1)
- 143.00 (Target 2)
Having said that, the support still remains at 129.67 and as long as Price Action remains above, trend on daily chart is bullish. Having said that, the support still remains at 129.67 and as long as Price Action remains above, trend on daily chart is bullish. At the same time, we can follow the pair on intraday chart too, looking for closer supports that could anticipate the potential Bullish Pattern failure.
ANALYSIS ON WEEKLY CHART:
(Click & Play on Chart below)
Trade with care!
Like if my analysis is useful.
Cheers!

USDJPY H4 | Falling to 61.8% Fibo projectionUSD/JPY is falling towards a pullback support and could potentially bounce off this level to rise higher towards our take profit target.
Entry: 141.418
Why we like it:
There is a pullback support that aligns with the 61.8% Fibonacci projection level
Stop Loss:140.18
Why we like it:
There is a pullback support that sts under the 100.0% Fibonacci projection level
Take Profit: 144.54
Why we like it:
There is a swing-high resistance level
Please be advised that the information presented on TradingView is provided to Vantage (‘Vantage Global Limited’, ‘we’) by a third-party provider (‘Everest Fortune Group’). Please be reminded that you are solely responsible for the trading decisions on your account. There is a very high degree of risk involved in trading. Any information and/or content is intended entirely for research, educational and informational purposes only and does not constitute investment or consultation advice or investment strategy. The information is not tailored to the investment needs of any specific person and therefore does not involve a consideration of any of the investment objectives, financial situation or needs of any viewer that may receive it. Kindly also note that past performance is not a reliable indicator of future results. Actual results may differ materially from those anticipated in forward-looking or past performance statements. We assume no liability as to the accuracy or completeness of any of the information and/or content provided herein and the Company cannot be held responsible for any omission, mistake nor for any loss or damage including without limitation to any loss of profit which may arise from reliance on any information supplied by Everest Fortune Group.

USDJPY H4 | Rising to 38.2% Fibo resistanceUSD/JPY is rising towards a pullback resistance and could potentially reverse off this level to drop lower towards our take profit target.
Entry: 143.035
Why we like it:
There is a pullback resistance that aligns with the 38.2% Fibonacci retracement level
Stop Loss: 144.718
Why we like it:
There is a pullback resistance that sits above the 61.8% Fibonacci retracement level
Take Profit: 140.945
Why we like it:
There is a swing-low support level
Please be advised that the information presented on TradingView is provided to Vantage (‘Vantage Global Limited’, ‘we’) by a third-party provider (‘Everest Fortune Group’). Please be reminded that you are solely responsible for the trading decisions on your account. There is a very high degree of risk involved in trading. Any information and/or content is intended entirely for research, educational and informational purposes only and does not constitute investment or consultation advice or investment strategy. The information is not tailored to the investment needs of any specific person and therefore does not involve a consideration of any of the investment objectives, financial situation or needs of any viewer that may receive it. Kindly also note that past performance is not a reliable indicator of future results. Actual results may differ materially from those anticipated in forward-looking or past performance statements. We assume no liability as to the accuracy or completeness of any of the information and/or content provided herein and the Company cannot be held responsible for any omission, mistake nor for any loss or damage including without limitation to any loss of profit which may arise from reliance on any information supplied by Everest Fortune Group.

USDJPY H4 | Overhead resistance at 38.2% Fibo?USD/JPY could rise towards a pullback resistance and potentially reverse off this level to drop lower.
Sell entry is at 143.058 which is a pullback resistance that aligns with the 38.2% Fibonacci retracement level.
Stop loss is at 144.538 which is a pullback resistance that aligns with the 61.8% Fibonacci retracement level.
Take profit is at 140.949 which is a swing-low support level.
High Risk Investment Warning
Trading Forex/CFDs on margin carries a high level of risk and may not be suitable for all investors. Leverage can work against you.
Stratos Markets Limited (www.fxcm.com):
CFDs are complex instruments and come with a high risk of losing money rapidly due to leverage. 67% of retail investor accounts lose money when trading CFDs with this provider. You should consider whether you understand how CFDs work and whether you can afford to take the high risk of losing your money.
Stratos Europe Ltd, previously FXCM EU Ltd (www.fxcm.com):
CFDs are complex instruments and come with a high risk of losing money rapidly due to leverage. 72% of retail investor accounts lose money when trading CFDs with this provider. You should consider whether you understand how CFDs work and whether you can afford to take the high risk of losing your money.
Stratos Trading Pty. Limited (www.fxcm.com):
Trading FX/CFDs carries significant risks. FXCM AU (AFSL 309763), please read the Financial Services Guide, Product Disclosure Statement, Target Market Determination and Terms of Business at www.fxcm.com
Stratos Global LLC (www.fxcm.com):
Losses can exceed deposits.
Please be advised that the information presented on TradingView is provided to FXCM (‘Company’, ‘we’) by a third-party provider (‘TFA Global Pte Ltd’). Please be reminded that you are solely responsible for the trading decisions on your account. There is a very high degree of risk involved in trading. Any information and/or content is intended entirely for research, educational and informational purposes only and does not constitute investment or consultation advice or investment strategy. The information is not tailored to the investment needs of any specific person and therefore does not involve a consideration of any of the investment objectives, financial situation or needs of any viewer that may receive it. Kindly also note that past performance is not a reliable indicator of future results. Actual results may differ materially from those anticipated in forward-looking or past performance statements. We assume no liability as to the accuracy or completeness of any of the information and/or content provided herein and the Company cannot be held responsible for any omission, mistake nor for any loss or damage including without limitation to any loss of profit which may arise from reliance on any information supplied by TFA Global Pte Ltd.
The speaker(s) is neither an employee, agent nor representative of FXCM and is therefore acting independently. The opinions given are their own, constitute general market commentary, and do not constitute the opinion or advice of FXCM or any form of personal or investment advice. FXCM neither endorses nor guarantees offerings of third party speakers, nor is FXCM responsible for the content, veracity or opinions of third-party speakers, presenters or participants.

USDJPY H4 | Rising into resistanceUSD/JPY is rising towards an overlap resistance and could potentially reverse off this level to drop lower towards our take profit target.
Entry: 146.667
Why we like it:
There is an overlap resistance that aligns with the 50.0% Fibonacci retracement level
Stop Loss: 148.510
Why we like it:
There is a pullback resistance that lies above the 61.8% Fibonacci retracement level
Take Profit: 143.274
Why we like it:
There is a swing-low support level
Please be advised that the information presented on TradingView is provided to Vantage (‘Vantage Global Limited’, ‘we’) by a third-party provider (‘Everest Fortune Group’). Please be reminded that you are solely responsible for the trading decisions on your account. There is a very high degree of risk involved in trading. Any information and/or content is intended entirely for research, educational and informational purposes only and does not constitute investment or consultation advice or investment strategy. The information is not tailored to the investment needs of any specific person and therefore does not involve a consideration of any of the investment objectives, financial situation or needs of any viewer that may receive it. Kindly also note that past performance is not a reliable indicator of future results. Actual results may differ materially from those anticipated in forward-looking or past performance statements. We assume no liability as to the accuracy or completeness of any of the information and/or content provided herein and the Company cannot be held responsible for any omission, mistake nor for any loss or damage including without limitation to any loss of profit which may arise from reliance on any information supplied by Everest Fortune Group.

Over 2000 Pips of Trading Opportunity up or GRABS...!Here is a video outlining our thought process and analysis on this trade pair.
We are expecting to see a huge 2000 pips trading opportunity.

USDJPY D1 | Falling to 38.2% Fibo supportUSD/JPY is falling towards an overlap support and could potentially bounce off this level to climb higher.
Buy entry is at 146.560 which is an overlap support that aligns with the 38.2% Fibonacci retracement level.
Stop loss is at 144.30 which is a level that sits under an overlap support that aligns with the 50.0% Fibonacci retracement level.
Take profit is at 149.055 which is a pullback resistance.
High Risk Investment Warning
Trading Forex/CFDs on margin carries a high level of risk and may not be suitable for all investors. Leverage can work against you.
Stratos Markets Limited (www.fxcm.com):
CFDs are complex instruments and come with a high risk of losing money rapidly due to leverage. 67% of retail investor accounts lose money when trading CFDs with this provider. You should consider whether you understand how CFDs work and whether you can afford to take the high risk of losing your money.
Stratos Europe Ltd, previously FXCM EU Ltd (www.fxcm.com):
CFDs are complex instruments and come with a high risk of losing money rapidly due to leverage. 72% of retail investor accounts lose money when trading CFDs with this provider. You should consider whether you understand how CFDs work and whether you can afford to take the high risk of losing your money.
Stratos Trading Pty. Limited (www.fxcm.com):
Trading FX/CFDs carries significant risks. FXCM AU (AFSL 309763), please read the Financial Services Guide, Product Disclosure Statement, Target Market Determination and Terms of Business at www.fxcm.com
Stratos Global LLC (www.fxcm.com):
Losses can exceed deposits.
Please be advised that the information presented on TradingView is provided to FXCM (‘Company’, ‘we’) by a third-party provider (‘TFA Global Pte Ltd’). Please be reminded that you are solely responsible for the trading decisions on your account. There is a very high degree of risk involved in trading. Any information and/or content is intended entirely for research, educational and informational purposes only and does not constitute investment or consultation advice or investment strategy. The information is not tailored to the investment needs of any specific person and therefore does not involve a consideration of any of the investment objectives, financial situation or needs of any viewer that may receive it. Kindly also note that past performance is not a reliable indicator of future results. Actual results may differ materially from those anticipated in forward-looking or past performance statements. We assume no liability as to the accuracy or completeness of any of the information and/or content provided herein and the Company cannot be held responsible for any omission, mistake nor for any loss or damage including without limitation to any loss of profit which may arise from reliance on any information supplied by TFA Global Pte Ltd.
The speaker(s) is neither an employee, agent nor representative of FXCM and is therefore acting independently. The opinions given are their own, constitute general market commentary, and do not constitute the opinion or advice of FXCM or any form of personal or investment advice. FXCM neither endorses nor guarantees offerings of third party speakers, nor is FXCM responsible for the content, veracity or opinions of third-party speakers, presenters or participants.

USDJPY H4 | Approaching swing-high resistanceUSD/JPY is rising towards a multi-swing-high resistance and could potentially reverse off this level to drop lower.
Sell entry is at 151.794 which is a multi-swing-high resistance that aligns with the 61.8% Fibonacci projection level.
Stop loss is at 152.570 which is a level that sits above the 78.6% Fibonacci projection and the 127.2% Fibonacci extension levels.
Take profit is at 150.375 which is a swing-low support.
High Risk Investment Warning
Trading Forex/CFDs on margin carries a high level of risk and may not be suitable for all investors. Leverage can work against you.
Stratos Markets Limited (www.fxcm.com):
CFDs are complex instruments and come with a high risk of losing money rapidly due to leverage. 67% of retail investor accounts lose money when trading CFDs with this provider. You should consider whether you understand how CFDs work and whether you can afford to take the high risk of losing your money.
Stratos Europe Ltd, previously FXCM EU Ltd (www.fxcm.com):
CFDs are complex instruments and come with a high risk of losing money rapidly due to leverage. 72% of retail investor accounts lose money when trading CFDs with this provider. You should consider whether you understand how CFDs work and whether you can afford to take the high risk of losing your money.
Stratos Trading Pty. Limited (www.fxcm.com):
Trading FX/CFDs carries significant risks. FXCM AU (AFSL 309763), please read the Financial Services Guide, Product Disclosure Statement, Target Market Determination and Terms of Business at www.fxcm.com
Stratos Global LLC (www.fxcm.com):
Losses can exceed deposits.
Please be advised that the information presented on TradingView is provided to FXCM (‘Company’, ‘we’) by a third-party provider (‘TFA Global Pte Ltd’). Please be reminded that you are solely responsible for the trading decisions on your account. There is a very high degree of risk involved in trading. Any information and/or content is intended entirely for research, educational and informational purposes only and does not constitute investment or consultation advice or investment strategy. The information is not tailored to the investment needs of any specific person and therefore does not involve a consideration of any of the investment objectives, financial situation or needs of any viewer that may receive it. Kindly also note that past performance is not a reliable indicator of future results. Actual results may differ materially from those anticipated in forward-looking or past performance statements. We assume no liability as to the accuracy or completeness of any of the information and/or content provided herein and the Company cannot be held responsible for any omission, mistake nor for any loss or damage including without limitation to any loss of profit which may arise from reliance on any information supplied by TFA Global Pte Ltd.
The speaker(s) is neither an employee, agent nor representative of FXCM and is therefore acting independently. The opinions given are their own, constitute general market commentary, and do not constitute the opinion or advice of FXCM or any form of personal or investment advice. FXCM neither endorses nor guarantees offerings of third party speakers, nor is FXCM responsible for the content, veracity or opinions of third-party speakers, presenters or participants.

USDJPY: Trendline breakout, wait for retestLooks like USDJPY has broken down through the rising trendline, there was a slight recovery at the backend of Friday, this indicates we could see a short retracement from here to test the trendline break, and then down.
The Yen performed well at the start of Friday, I don't believe this was BoJ intervention, as they have said that they expect the fundamentals to play out - we'll see, bad data from JPY this week may necessitate intervention, however good data on Friday (PMI) will I think be enough to start the recovery process for the Yen.
If Japan looks like it's going to have a soft landing then I think markets will reward the Yen with a more positive sentiment and this could mean we get a lot of good action for these crosses.
I think the USD is done being bullish for now (even the hawkish speakers cannot convince the markets), so either way I think we'll see this pair fall, so monitoring LTF's for a suitable entry / rejection from the retest point.
A break below 148.5 will see a more sustained move to the downside, imho.

USDJPY H4 | Running into resistance?USDJPY is rising towards a swing-high resistance and could potentially reverse to drop lower towards our take profit target.
Entry: 151.703
Why we like it:
There is a swing-high resistance level
Stop Loss: 152.087
Why we like it:
There is a resistance level that aligns with the 100.0% Fibonacci projection level
Take Profit: 150.579
Why we like it:
There is an overlap support level
Please be advised that the information presented on TradingView is provided to Vantage (‘Vantage Global Limited’, ‘we’) by a third-party provider (‘Everest Fortune Group’). Please be reminded that you are solely responsible for the trading decisions on your account. There is a very high degree of risk involved in trading. Any information and/or content is intended entirely for research, educational and informational purposes only and does not constitute investment or consultation advice or investment strategy. The information is not tailored to the investment needs of any specific person and therefore does not involve a consideration of any of the investment objectives, financial situation or needs of any viewer that may receive it. Kindly also note that past performance is not a reliable indicator of future results. Actual results may differ materially from those anticipated in forward-looking or past performance statements. We assume no liability as to the accuracy or completeness of any of the information and/or content provided herein and the Company cannot be held responsible for any omission, mistake nor for any loss or damage including without limitation to any loss of profit which may arise from reliance on any information supplied by Everest Fortune Group.

USDJPY: Multiple Time Frame Analysis & Trading Plan 🇺🇸🇯🇵
Daily/4h/1h time frames analysis.
Price action.
Important key levels.
Potentials scenarios.
Trading plan explained.
❤️Please, support this video with like and comment!❤️

First Bearish, Then Bullish... and then We TRADEThe USDJPY has maintained its bullish momentum from the past few weeks. Last week, we witnessed this pair come with a deep to take out zone, create an impression of a bearish reversal, and then continue or resume its bullish trend. These are fakeouts, and they are very common occurrences in the market price movements.
On the daily, 4-hour, and 1-hour timeframes, the market is bullish. With the market making a new high, prices are expected to begin to retrace bearish. With the retracement in place, we will look to the new high that just formed as our liquidity and look to trade market prices up all the way to that point. But first, we would want to see price retrace bearish and come into our refined zone, after which we would decide on how to enter the bullish trade.
Stay close, guys. This is going to be an interesting one.

CADJPY: Short scalp next weekThinking we're starting to see JPY strength, this is because it can't stay so weak for so long imho.
Weak currency suits Japan as an exporter, to a point, but massively affects it's buying power, I do feel like we're approaching the end of this cycle of Yen weakness, by the end of this year.
I think this pair broke the rising trendline but has struggled to get back in on multiple retracement attempts, so I think we'll drop to catch the order block in the next week based on current PA.

USDJPY: CURVE ANALYSIS (1D)-SL @ 150.00 🚫
SLO @ 148.90 (conservative) ⏳
SSO @ 146.75 (moderate) ⏳
TP1 @ 142.66 (shaving 25%)
TP2 @ 139.15 (shaving 25%)
TP3 @ 136.60 (shaving 25%)
TP4 @ 132.60 (shaving 25%)
TP5 @ 130.50 (closing ALL Sell Orders)
BLO @ 129.33 (1D) ⏳
-SL @ 128.25 🚫
PA is hanging out in the Supply Zone.
📉 Hopefully, it wicks up to our SLO and tanks
