$DXY 10% Declines along with $SPX declines from 1987-1995In case you are wondering if the drop in the $USDOL TVC:DXY US Dollar of 10% from a high is a sign of something major going on in the stock market, it reminded me of research I did right when I got out of college in 1987.
Here's a quick overview of that pattern of TVC:DXY declines of 10% against the backdrop of SP:SPX or S&P500 Index declines at that time. The 1987 stock market crash is on the far left of this graph and gets the chart started for you to review.
The 10% drops from highs in the TVC:DXY index are labeled with yellow arrows and there were 9 of them across this time series from 1987-1995.
We can imagine how a Non-US investor would handle both a drop in the TVC:DXY and a drop in the SP:SPX , but a drop of both the TVC:DXY and SP:SPX of 10% together would mean a loss of 20% for the non-US investor. That is a painful loss and perhaps more than investors wanted to risk.
Historically, it was a good time to look for a stock market bottom AFTER a drop in the TVC:DXY index and the green boxes at the top show the risk of a deeper decline in the SP:SPX was minimal after this scenario.
So the end result of this analysis is that the Dollar can be viewed as a contrarian indicator after a meaningful decline, as in 10% in this time frame. Look for other signs of a market bottom, especially using my TVC:VIX signals (5 point spike indicator and VIX75% retracement) to help define a bottom. The VIX75 signal triggered on Monday, March 24th, indicating that the panic from the selloff had moderated to a point enough to signal that the panic was over.
Do some more research for yourself and see if the TVC:DXY drop was an "asset allocation" shift as US investors bailed out of US stocks to invest in non-US stocks or was it another wave of non-US investors dumping US stocks to cut risk.
Either way, know what you are investing in and question everything. These days, it is more important to be educated and use TradingView to chart and research the past will help you be a more educated investor.
Cheers,
Tim
Dollar

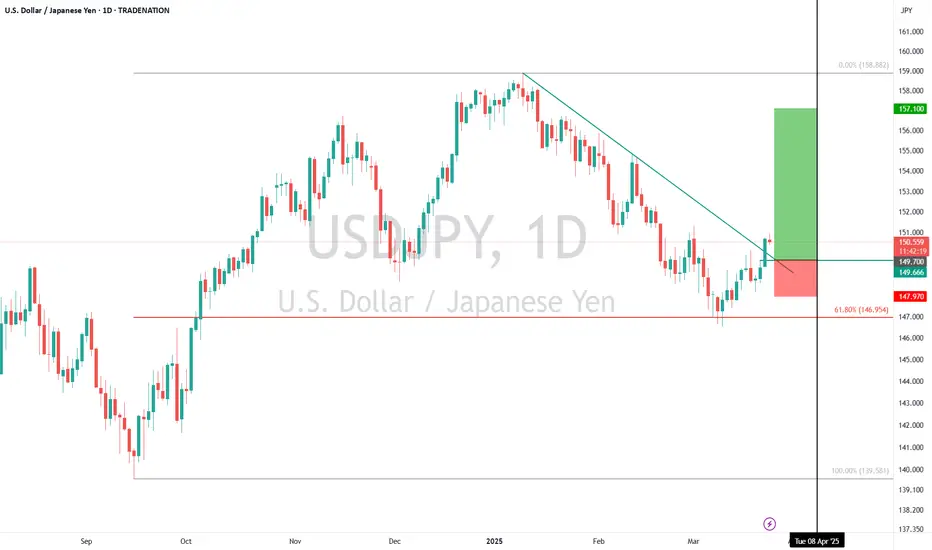
USDJPY Buy Setup – Breakout Confirmation & Seasonal TailwindTechnical: USDJPY has broken above a downtrend resistance line after finding support at the 61.8% Fibonacci retracement level at 146.95 . This breakout suggests the corrective phase may have ended, signaling potential for further upside. Pullbacks toward 149.70 (a retest of the broken trendline) present an attractive entry opportunity. Upside targets are 152.74 and 157.10 in the short to medium term. The setup is invalidated below 147.97 , with a break below 146.33 negating further bullish expectations.
Fundamental: Commercial selling of the Japanese Yen and renewed dollar purchases indicate a shift favoring USD over JPY, supporting the bullish technical outlook.
Seasonal: Over the past 25 years , USDJPY has risen 76% of the time between March 25 – April 8 , with an average gain of 1.04% .
Trade Idea:
Entry: On pullbacks toward 149.70
Stop Loss: 147.97 (or 146.33 for extended risk management)
Targets: 152.74 and 157.10
Disclosure: I am part of Trade Nation's Influencer program and receive a monthly fee for using their TradingView charts in my analysis.
US Dollar Weakens: Hedge Funds Shift to Short PositionsThe U.S. dollar, long considered a bastion of stability, is facing a significant shift in sentiment as hedge funds begin to adopt a bearish stance. This reversal, marking a notable change since the period following Donald Trump's election, is driven by a complex interplay of economic uncertainties and evolving market expectations.
Factors Driving the Bearish Turn:
• Shifting Federal Reserve Expectations:
o A key driver of this bearish sentiment is the evolving outlook on the Federal Reserve's monetary policy. Initially, expectations of a strong dollar were bolstered by projections of limited Fed rate cuts. However, growing concerns about the fragility of the U.S. economy have led to increased expectations of multiple rate reductions. This shift in expectations weakens the dollar's appeal.
• Economic Uncertainty and Trade Policies:
o Concerns surrounding potential trade wars and the impact of certain economic policies are also weighing on the dollar. Uncertainty about future trade relations and their potential impact on U.S. economic growth is creating apprehension among hedge fund managers.
o The impacts of possible public sector job cuts, and restrictive immigration policies, are also adding to the economic uncertainty.
• Data from the CFTC:
o Data from the Commodity Futures Trading Commission (CFTC) reveals a clear trend. Speculative traders have moved from holding significant long-dollar positions to net short positions, indicating a substantial shift in market sentiment.
• Global Economic Factors:
o The relative strength of other global economies also plays a role. If other global economies are showing signs of stronger growth, that can also put downward pressure on the dollar.
Implications of a Weaker Dollar:
• Impact on Global Trade:
o A weaker dollar can have significant implications for global trade, potentially making U.S. exports more competitive while increasing the cost of imports.
• Inflationary Pressures:
o A depreciating dollar can also contribute to inflationary pressures within the U.S. as import prices rise.
• Investment Flows:
o Changes in the dollar's value can influence international investment flows, as investors adjust their portfolios in response to currency fluctuations.
Market Analysis:
• Analysts are closely monitoring these developments, with some revising their dollar forecasts downward. The shift in hedge fund positioning underscores the growing uncertainty surrounding the U.S. economic outlook.
• It is important to understand that the currency markets are very dynamic, and things can change rapidly.
• The effects of political events, and world wide economic changes can have very large effects on the dollar.
In essence, the shift in hedge fund sentiment reflects a growing recognition of the complex economic challenges facing the U.S. As these challenges unfold, the dollar's trajectory will remain a key focus for investors and policymakers alike.

DOLLAR INDEX (DXY): Bearish Outlook Explained
Dollar Index is currently consolidating within a range on intraday time frames.
Testing its upper boundary, the market formed a double top pattern.
With a strong bearish mood after the opening, the market is going
to drop lower.
Goal - 103.8
❤️Please, support my work with like, thank you!❤️

Fundamental Market Analysis for March 24, 2025 GBPUSDThe GBP/USD pair continues to hold below the round 1.2900 mark and is attracting buyers in the Asian session on Monday.
The US Dollar (USD) started the new week on a weak note and halted its three-day recovery from multi-month lows, which in turn is seen as a key factor acting as a tailwind for the GBP/USD pair. Despite the Federal Reserve (Fed) raising its inflation forecast, investors seem convinced that a tariff-induced slowdown in the US economy could force the central bank to resume its rate-cutting cycle in the near future.
In fact, the UK central bank has cautioned against assumptions of rate cuts and has also raised its forecast for inflation to peak this year. This suggests that the Bank of England will reduce borrowing costs more slowly than other central banks, including the Fed, which lends further support to the GBP/USD pair.
Moving forward, traders are awaiting the release of flash PMI indices from the UK and the US for meaningful momentum. In addition, speeches from influential FOMC members will stimulate demand for the dollar, which, along with comments from Bank of England Governor Andrew Bailey, should create short-term trading opportunities for the GBP/USD pair.
Trading recommendation: BUY 1.2930, SL 1.2850, TP 1.3060

The New week can give us a Pullback on Gold!Waiting for the bigger move and for that bigger move to happen we need a solid pill back to fill in some gaps. Focused on the patience for this in order to maximize the reward. Allow Monday and Tues to show if they will reach for the lows and set up. Logically the best entry should come after Tuesday. But you never know. Just wait for it cause price will show when it is ready.

EURUSD: Detailed Support & Resistance Analysis For Next Week
Here is my latest structure analysis for EURUSD;
Resistance 1: 1.0944 - 1.0955 area
Support 1: 1.0804 - 1.0834 area
Support 2: 1.0598 - 1.0630 area
Support 3: 1.0515 - 1.0533 area
Support 4: 1.0359 - 1.0377 area
Support 5: 1.0727 - 1.0290 area
Support 6: 1.0717 - 1.0240 area
Consider these structures for pullback/breakout trading.
❤️Please, support my work with like, thank you!❤️
I am part of Trade Nation's Influencer program and receive a monthly fee for using their TradingView charts in my analysis.

USDCHF: Bullish Outlook Explained 🇺🇸🇨🇭
USDCHF looks bullish after a test of the underlined blue support.
The price formed a double bottom on that and broke its neckline
on Friday.
We see a positive bullish reaction to that after its retest.
I think that the market will continue rising and reach
at least 0.885 resistance.
❤️Please, support my work with like, thank you!❤️
I am part of Trade Nation's Influencer program and receive a monthly fee for using their TradingView charts in my analysis.

GBP/USD is heating up! A major shift is coming—are you ready?"Analysis:
The correlation between DXY & GBP/USD is playing out perfectly! As the Dollar Index (DXY) approaches key resistance in the 112-113 zone, GBP/USD is reacting inversely, showing signs of a potential drop toward 1.14.
Elliott Wave patterns confirm a high-probability reversal setup, aligning with macroeconomic factors and liquidity zones. If DXY gains strength, expect a bearish breakdown on GBP/USD.
📈 Key Levels to Watch:
GBP/USD Resistance: 1.32-1.34
GBP/USD Support: 1.14
DXY Resistance: 112-113
DXY Support: 102.5
💡 Will GBP/USD hold or break down? Drop your predictions below! 👇

GBP/USD Intraday Short: Targeting a Reversal from 1.2955Intraday Idea - We look to GBPUSD Sell at 1.2955
Technical View
Although the bulls are in control, the stalling positive momentum indicates a turnaround is possible
Price action looks to be forming a top
A lower correction is expected
Preferred trade is to sell into rallies
Bespoke resistance is located at 1.2955
Stop: 1.2975
Target: 1.2875
Disclosure: I am part of Trade Nation's Influencer program and receive a monthly fee for using their TradingView charts in my analysis.

DXY, bullish or bearish?Welcome back!
Today i'm posting a small idea on the DXY. Usually i cover crypto but the macro is important. A weak dollar correlates with more risk being taken and a strong dollar with less risk being taken. Hence my analysis of the DXY.
In the above chart a couple of things can be seen which makes the outlook hard to predict.
On one side there is a bullflag on the monthly timeframe with a target of 130!
On the other side, looking under we can see a bearish MACD cross and a bearish stoch RSI. On average it takes half a year to a year for a cross like this to recover.
This causes me to be bearish on the dollar and bullish on risk-on assets.
Thanks for reading

Fundamental Market Analysis for March 21, 2025 EURUSDFederal Reserve (Fed) Chairman Jerome Powell downplayed the danger to the economy from US President Donald Trump's tariff threats, which seem to exist in a quantum state where they both exist and don't exist at the same time. According to Fed Chairman Powell, downside risks have certainly increased thanks to repeated tariff threats, but Fed policymakers continue to insist that US economic data remains strong, albeit off recent highs.
The Federal Reserve Bank of Philadelphia's (Fed) manufacturing activity survey for March fell to 12.5 m/m, down from the previous reading of 18.1 and down for the second month in a row, but held the brakes and fell less than the median market forecast of 8.5. US weekly initial jobless claims also rose less than expected at 223,000 new jobless claimants, up from 220,000 the previous week. Investors had expected the figure to be 224k. Sales of existing homes in the US also rose by almost a third of a million transactions more than expected, rising to 4.26 million units in February from a revised January figure of 4.09 million. Market watchers had expected a slight slowdown to 3.95 million.
With little in the way of economic data on Friday, investors will have a week's worth of events to digest. Traders will also keep an eye on any social media developments from President Trump.
Trade recommendation: SELL 1.0850, SL 1.0930, TP 1.0760

Sterling Stays Firm as Fed Highlights GrowthGBP/USD held near 1.3000 as sentiment stayed upbeat after the Fed reaffirmed 2025 rate cuts, though delayed. Markets still expect a 25 bps cut in June, with Powell highlighting strong US growth and a healthy labor market.
The Fed lowered its 2025 GDP forecast to 1.7% from 2.1% and acknowledged trade policy risks but sees inflationary effects as short-lived.
Focus now shifts to the BoE’s Thursday rate decision, with no changes expected. On Friday, the UK’s GfK Consumer Confidence is projected to fall to -21.0 from -20.0.
If GBP/USD breaks above 1.3050, the next resistance levels are 1.3100 and 1.3150. On the downside, support stands at 1.2860, with further levels at 1.2800 and 1.2715 if selling pressure increases.

Bitcoin's Wild Ride: Will It Moon or Crash and Burn?Ah, Bitcoin—the digital rollercoaster we all love to hate. Currently lounging around $84,000 , but what's next? Let's dive into the crystal ball of crypto predictions, shall we? 🔮
The Bullish Dreamers:
Derivatives Delight: Some analysts are giddy over derivatives metrics, suggesting Bitcoin is "poised" to reclaim the $90,000 level in the coming weeks. Because who doesn't love a good gamble?
The Bearish Realists:
Death Cross Drama: Hold onto your hats! Bitcoin is flirting with a "death cross," where the 50-day moving average dips below the 200-day. Historically, this is like the crypto version of a horror movie—cue the dramatic music.
Support Level Shenanigans: If Bitcoin can't muster the strength to stay above $81,000, we might be sliding down to $76,000 faster than you can say "HODL."
The Fence-Sitters:
FOMC Follies: All eyes are on the upcoming Federal Open Market Committee meeting. Will they hike rates? Will they cut? Will they order pizza for lunch? Their decisions could send Bitcoin on a joyride or a nosedive.
So, what's the takeaway? Is Bitcoin gearing up for a moon mission, or are we strapping in for a freefall? As always, keep your wits about you, and maybe a parachute handy. 🎢🪂
If you want the deeper breakdown (the one nobody’s telling you), drop a comment or DM me. Maybe I’ll let you in on the real insights. 👀🔥
Disclaimer: This is not financial advice. Always do your own research before diving into the crypto abyss.

USDJPY Tests Cup and Handle Formation Ahead of FOMCUSDJPY has formed a cup-and-handle pattern just below the 150 level. Today, the Bank of Japan kept interest rates steady at 0.50%. Wage negotiations so far indicate a 5.46% wage increase, which Governor Ueda described as "somewhat strong." Combined with rising food prices, the risk of further inflation has increased. Japan's inflation has remained above 2% since early 2022, and there’s no sign of that trend reversing anytime soon. In light of these factors, the BOJ is likely to consider a rate hike in May.
However, today’s market focus will shift to the FOMC. The Fed is expected to raise its inflation and unemployment forecasts while lowering its growth forecast due to the anticipated effects of new U.S. trade policies. These stagflationary pressures are likely to keep the Fed’s rates elevated for an extended period. If the dot plot shows only one rate cut this year (instead of two as projected in December), the dollar index may begin to recover.
The 150 level remains a key resistance for USDJPY. A confirmed breakout of the cup-and-handle pattern has the potential to push the pair towards the 153 level over the medium term. However, given the underlying fundamentals favoring BOJ rate hikes, any upward movement will likely be slower and more choppy, unless of course FOMC goes full hawkish.
On the downside, if the Fed is less hawkish than expected, 149 (and sliglty below)becomes the critical support to watch. A break below 149 would invalidate the bullish pattern and shift momentum to the downside for USDJPY.

USDCAD Short Setup – Potential Top Formation & Seasonal WeaknessTechnical: USDCAD has stalled in recent weeks, signaling a potential topping pattern. A recent break of the short-term trend suggests a deeper correction may follow. Key resistance is at 1.4355 , offering a favourable risk-reward short opportunity.
Fundamental: The U.S. dollar remains weak, with commercial participants showing little interest in buying. Meanwhile, the Canadian dollar is seeing increased accumulation, indicating a potential shift in momentum.
Seasonal: Historically, from March 24 – April 30 , USDCAD has declined 76.2% of the time over the past 21 years, with an average drop of 1.30%.
Trade Idea:
Sell: 1.4355
Stop Loss: 1.4551
Target: 1.3948
Disclosure: I am part of Trade Nation's Influencer program and receive a monthly fee for using their TradingView charts in my analysis.

GOLD is bullish, but is it giving a Entry?Extremely bullish on Gold but looking for the safe entry before getting in for the run. It looks like they want to pull back. Just have to wait it out and see if it lines up inside of the killzone.

GBPUSD Week 12 Swing Zone/LevelsA new trading week begins.
The swing zone and projected paths are set.
Trades will be guided by price action.

Silver Surges to $33.90 as Safe-Haven DemandSilver surged to $33.90, its highest since October 2024, driven by a weaker dollar, geopolitical tensions, and strong industrial demand. Recession fears and trade disputes have supported safe-haven buying, with Trump planning new tariffs on China, steel, and aluminum starting April 2. Middle East tensions added support, as Netanyahu confirmed intensified military action in Gaza. Supply constraints and record industrial demand, especially in solar, 5G, and automotive sectors, further fueled the rally.
If silver breaks above $34.00, the next resistance levels are $34.85 and $35.00. On the downside, support is at $33.80, with further levels at $33.15 and $32.75 if selling pressure increases.

Fundamental Market Analysis for March 18, 2025 EURUSDThe escalating trade war with further tariffs on European Union goods by US President Donald Trump is having a negative impact on the Euro (EUR).
The US has imposed tariffs on steel and aluminium, the EU has drawn up plans to retaliate, and Trump has promised to impose retaliatory 200% tariffs on European wines and spirits. Any signs of an escalation in the tariff war between the US and EU could put pressure on the euro.
German Chancellor Friedrich Merz has agreed to a €500bn infrastructure fund and radical changes to borrowing rules, or stretching the so-called ‘debt brake’. That should ensure the package is approved in Germany's lower house of parliament on Tuesday and in the upper house on Friday. This, in turn, could boost the common currency against the US dollar (USD) in the near term.
In addition, weaker-than-expected US retail sales data has heightened concerns about a slowdown in consumer spending. This report could put pressure on the USD and serve as a tailwind for the major pair. US retail sales rose 0.2% month-on-month in February, compared to a 1.2% drop (revised from -0.9%) in January, the US Census Bureau reported on Monday. The figure was weaker than market expectations, which had expected a 0.7% rise. On a year-over-year basis, retail sales rose 3.1% compared to 3.9% (revised from 4.2%) previously.
Trade recommendation: BUY 1.0920, SL 1.0840, TP 1.1040

We Need a Retrace before the breakout IMO on GoldI want to go long. I am long on gold. but I need to see it pull back and establish a low for he week first before I'm interested in attempting the long. This would make for a much stronger move. Just have to be patient and wait for it all to line up inside of the killzone.

DXY biasSorry for my absense these days, to an extent, I still seeing Dollars going up, but with this intermediate bias, I suggest that assets or currencies against dollar will still go up, while dollars would likely drop following last friday.

Sit on hands! Wait for Gold to reveal its move!Letting monday play out. We should get a better, clear move on Tuesday after price has moved to establish a low for the week. not trying to be to early to the party so we wait for now.
