BTCUSD Daily Inflection Point
This is a continuation of the Weekly Inflection Point.
On the daily we're getting close to a crucial area. A downward move here may indicate a large move, correction on the weekly, daily. 16k could easily be hit. There is also the potential for this momentum consolidation to have a breakout leg to 77-88k before a final correction.
Watch for a break above or below the keltner channel. If the stock market is about to tank because WW3, the debt bubble created in 2008-2020, then Bitcoin will get shocked with it while everyone scrambles for PM's.
After maybe bitcoin will be revived when people realize there isn't enough PM's out there, else some world wide digital currency emerges.
Either way I have little hope for bitcoin, unless the NWO backs it because of the transparent transactions that can be traced, blacklisted, non fungible- control. Such a currency is a fools hope and will be used against you when tyranny seeks control over you.
Dollar

Gold: Today's Pullback Eases MomentumGold: Today's Pullback Eases Momentum
Last week, gold continued its upward trajectory, closing at $2716 per ounce. Several key factors tied to geopolitics, the global economy, and structural demand have contributed to this positive momentum in the gold market.
However, today, gold experienced a sharp **3.3% correction**, driven by news of a potential resolution to the Israel-Hezbollah conflict. According to Axios, citing a US official, **Israel and Lebanon have agreed to the terms of an agreement to end the conflict**. This announcement eased geopolitical tensions, reducing demand for safe-haven assets like gold.
Geopolitics and Economic Uncertainty
Gold’s recent rally has been fueled by escalating conflicts, including the war in Ukraine, and broader global geopolitical tensions. However, today’s news of a possible resolution in the Middle East has temporarily weakened the case for gold as a safe-haven asset.
Additionally, gold continues to benefit from economic uncertainty in the eurozone and China, where fears of slowing growth remain significant.
Inflation Concerns and Monetary Policy
Rising fears of global inflation continue to support gold prices. Future President Donald Trump’s proposed tariffs on imported goods to the US could fuel cost increases and inflationary pressures, bolstering gold’s appeal as an inflation hedge.
Gold also benefits from ongoing interest rate cuts worldwide, which reduce the opportunity cost of holding non-yielding assets like gold. Meanwhile, central banks’ continued purchases of gold provide additional fundamental support.
Emerging Economies and Infrastructure Development
Economic growth in emerging markets, such as China and India, where gold has both cultural and investment significance, continues to drive demand. The development of infrastructure around gold trading—such as exchanges, wallets, and investment products—also makes gold increasingly accessible to investors.
Conclusion
Today’s pullback reflects the easing of geopolitical tensions, but gold’s long-term fundamentals remain robust. Factors such as global economic uncertainty, inflation concerns, and central bank policies continue to underpin demand for the precious metal.
Will gold resume its rally after today’s correction, or will geopolitical developments continue to dictate its price direction? Share your thoughts in the comments!

Nasdaq: Gains Driven by Data, Eyes on Key EventsNasdaq: Gains Driven by Data, Eyes on Key Events.
The Nasdaq ended current day on a positive note, buoyed by strong economic data, robust corporate earnings, and supportive seasonality. However, investors are shifting their focus to critical upcoming events: the FOMC meeting on Tuesday and the PCE inflation report on Wednesday. These events have the potential to set the tone for the markets for the remainder of the year.
Mixed Economic Data
The past week brought a blend of economic data, with some encouraging signals and a few disappointments:
Initial Jobless Claims (Nov. 16): At 213K, the result came in better than the 220K consensus, underscoring the resilience of the labor market and reducing recession fears.
Philadelphia Fed Manufacturing Index (Nov.): Disappointed at -5.5 against expectations of 8, reflecting continued weakness in the manufacturing sector.
Michigan Consumer Sentiment Final (Nov.): Came in at 71.8, below the 73.7 forecast, indicating a slight dip in consumer confidence.
S&P Global Services PMI Flash (Nov.): Surprised to the upside with a reading of 57.0, exceeding the expected 55.2, highlighting the strength of the services sector.
Nvidia Shines Bright
Corporate earnings added to the bullish sentiment, led by Nvidia's impressive Q3 results. The company reported revenue of 35.08 billion dollars, significantly above the consensus estimate of 33.17 billion dollars. As a leader in AI-related technology and semiconductors, Nvidia's results lifted the broader tech sector and contributed to Nasdaq's gains.
Market Sentiment and Seasonality
The Fear & Greed Index currently stands at 61, in the "Greed" zone, indicating a risk-on environment as investors show confidence in equities. Seasonality also plays a crucial role. Historically, Nasdaq benefits from end-of-year trends, especially in an election year, when policymakers often aim to maintain market stability.
Challenges Ahead
While the current momentum is positive, the market faces significant tests this week with two major events:
FOMC Meeting (Tuesday): The Federal Reserve’s policy decisions and commentary will be in the spotlight. Investors will look for signals on whether the Fed plans to pause or keep the door open for further rate hikes in 2024.
PCE Inflation Report (Wednesday): The core PCE inflation data, the Fed's preferred measure of price pressures, could shape expectations for monetary policy. A higher-than-expected reading might increase concerns about further tightening, while a lower figure would reinforce the soft landing narrative.
Lingering Risks
In addition to the upcoming macroeconomic events, investors remain wary of:
Trade Policy: Former President Donald Trump’s proposed tariffs on imported goods could stoke inflation and weigh on economic growth.
Geopolitics: The ongoing risk of escalation in the Ukraine conflict continues to loom over global markets.
Soft Landing: The Baseline Scenario
Looking at the current data, the Nasdaq appears to be on the path to a soft landing, supported by a strong labor market and robust technology sector performance. Favorable seasonality—both year-end trends and election-year dynamics—further bolsters the case for continued gains, which remains the baseline scenario for now.
Conclusion
The Nasdaq has shown strength, but this week FOMC meeting and PCE inflation report could reshape market dynamics. The key question is whether the data will support the soft landing narrative or signal a need for further monetary tightening.
What are your thoughts on the Nasdaq’s outlook given the upcoming Fed meeting and inflation data? Will the index sustain its rally, or are we in for increased volatility? Share your insights in the comments.

Gold 1H Intra-Day Chart 25.11.2024Here is what I am looking for next;
Gold prices dip lower $2,602 - $2,590 zone as prices are overbought.

Ethereum: Momentum Fueled by Growth and AdoptionEthereum: Momentum Fueled by Growth and Adoption
Ethereum (ETH) continued its upward trend over the past week, closely following Bitcoin’s rally. The second-largest cryptocurrency by market capitalization is benefiting from a range of factors that reinforce its position as a leader in the blockchain space. With strong fundamentals, expanding use cases, and favorable seasonal trends, ETH’s price growth appears poised to continue.
Adoption and Network Usage
The growing adoption of Ethereum for a wide range of applications—ranging from decentralized finance (DeFi) to enterprise solutions—is a key driver of its rising value. Ethereum’s robust and versatile network continues to attract developers, businesses, and users, solidifying its role as the backbone of the blockchain ecosystem.
The Rise of DeFi and NFTs
The expansion of decentralized finance (DeFi) platforms, which leverage Ethereum’s smart contract capabilities, has created new opportunities for decentralized lending, borrowing, and trading. Simultaneously, the ongoing popularity of non-fungible tokens (NFTs) keeps Ethereum at the forefront of digital ownership and creative innovation.
Network Upgrades and Transaction Fee Burning
Technological improvements, such as Ethereum’s transition to proof-of-stake through the Merge, enhance network efficiency and sustainability. Additionally, the implementation of EIP-1559 introduced the burning of transaction fees, effectively reducing the supply of ETH and creating deflationary pressure, which can drive long-term price appreciation.
Institutional Investment and Ethereum ETFs
Institutional investors are increasingly entering the Ethereum market, driven by its utility and growth potential. One of the major catalysts has been the launch and increasing inflows into Ethereum-based ETFs, which provide a regulated and convenient way for institutional and retail investors to gain exposure to ETH. These inflows not only validate Ethereum’s role as a leading crypto asset but also contribute directly to its demand and price growth.
Seasonality and Market Momentum
Historically, the second half of December has often been a favorable period for cryptocurrency markets, including Ethereum. Factors such as increased trading activity, end-of-year portfolio adjustments, and overall market sentiment have historically supported upward trends during this time. Ethereum seems well-positioned to benefit from this seasonal tailwind, potentially pushing its price toward new highs.
Competition and Ecosystem Growth
Ethereum faces competition from other blockchain platforms, but its first-mover advantage, coupled with continuous innovation, helps it maintain a dominant position. The ecosystem of ERC-20 tokens—built on the Ethereum network—further strengthens its utility and value proposition.
Market Sentiment and Macroeconomic Factors
Positive market sentiment and media coverage contribute to Ethereum’s momentum. Broader macroeconomic factors, such as inflation and economic uncertainty, are also driving investors to explore alternatives like Ethereum as a hedge and growth asset.
Infrastructure and Partnerships
The continued development of infrastructure, including wallets, exchanges, and DeFi tools, makes Ethereum more accessible to users and investors. Strategic partnerships and collaborations within the blockchain space are also expanding Ethereum’s reach and utility.
Conclusion
Ethereum’s price growth is underpinned by a combination of strong network fundamentals, expanding use cases, increasing ETF inflows, and favorable seasonality. From DeFi and NFTs to network upgrades and institutional interest, Ethereum is positioned to continue its upward trajectory as we move into the traditionally bullish second half of December.
Will Ethereum leverage these advantages to reach new price milestones? Share your views and insights in the comments!

GOLD FURTHER SELL OFF?! (UPDATE)Remember what I said on my last Gold update? We could see a short squeeze happen on Gold to trap new buyers & liquidate early sellers. I said if Gold passes the $2,700 mark then it could go up to $2,720 - $2,735 before dropping. Price touched $2,720 last night & melted right back down with accuracy🎯
Overall, our bearish bias remains intact despite the short squeeze!

Bitcoin: Is the Psychological Barrier of $100,000 Within Reach?Bitcoin: Is the Psychological Barrier of $100,000 Within Reach?
Bitcoin continues its impressive rally toward the psychological barrier of $100,000, driven by both fundamental and psychological factors. The rise in its value is supported by growing adoption, institutional investments, positive market sentiment, and key developments within the cryptocurrency ecosystem.
Adoption and Acceptance
Bitcoin’s growing acceptance by businesses, financial institutions, and individual users is increasing its utility and value. As more entities begin to accept bitcoin as a form of payment, demand naturally rises, solidifying its position as a viable medium of exchange.
Institutional Investments
One of the primary drivers of bitcoin’s growth is the involvement of large institutional investors such as hedge funds, investment firms, and corporations. Their entry into the market significantly boosts liquidity and builds confidence in the cryptocurrency, attracting smaller retail investors in the process.
Planned Regulatory Changes and Strategic Reserves
Future President Donald Trump’s proposals to establish strategic reserves in bitcoin and introduce cryptocurrency-friendly regulations could be game-changing for the market. Such measures are likely to attract new market participants, driving demand and increasing bitcoin’s value.
Media and Market Sentiment
Positive media coverage, endorsements from influential figures, and expert analyses play a crucial role in shaping market sentiment. Media narratives have a substantial impact on perception and can amplify investor interest, fueling price increases.
Technological Improvements
Advancements in blockchain technology and updates to the bitcoin network are improving its efficiency, security, and scalability. These innovations make bitcoin more appealing as an investment asset, contributing to its rising value.
Macroeconomic Factors
Global economic uncertainty, inflation, and the weakening of traditional fiat currencies are pushing investors toward alternative assets. Often referred to as “digital gold,” bitcoin is increasingly viewed as a hedge against currency devaluation and a reliable store of value.
The 2024 Halving
This year, bitcoin underwent another halving – the process that reduces the reward for mining new blocks by half. This reduction in new supply, coupled with sustained or growing demand, has historically led to price increases, and the current cycle appears to be following a similar trajectory.
Infrastructure Growth and ETFs
The cryptocurrency market’s infrastructure is rapidly evolving, making bitcoin more accessible than ever. The growth of exchanges, cryptocurrency wallets, and inflows into bitcoin-based ETFs are driving demand and strengthening the market.
Seasonality and an Unstoppable Trend
Seasonality is also working in bitcoin’s favor. Historically, the final months of the year often see strong performance in the cryptocurrency market. The current upward trend seems difficult to halt, and breaking through the $100,000 level appears to be only a matter of time.
Conclusion
Bitcoin remains one of the most dynamic assets on the market, drawing interest from institutional and retail investors alike. The combination of fundamental, technological, and macroeconomic factors suggests that the rally toward $100,000 could not only materialize but also set the stage for further gains.
Will bitcoin surpass this symbolic threshold, or are there still hurdles ahead? Share your thoughts in the comments.

S&P 500: Gains Driven by Data, Eyes on Key Events Next WeekS&P 500: Gains Driven by Data, Eyes on Key Events Next Week
The S&P 500 ended the week on a positive note, buoyed by strong economic data, robust corporate earnings, and supportive seasonality. However, investors are shifting their focus to critical upcoming events: the FOMC meeting on Tuesday and the PCE inflation report on Wednesday. These events have the potential to set the tone for the markets for the remainder of the year.
Mixed Economic Data
The past week brought a blend of economic data, with some encouraging signals and a few disappointments:
Initial Jobless Claims (Nov. 16): At 213K, the result came in better than the 220K consensus, underscoring the resilience of the labor market and reducing recession fears.
Philadelphia Fed Manufacturing Index (Nov.): Disappointed at -5.5 against expectations of 8, reflecting continued weakness in the manufacturing sector.
Michigan Consumer Sentiment Final (Nov.): Came in at 71.8, below the 73.7 forecast, indicating a slight dip in consumer confidence.
S&P Global Services PMI Flash (Nov.): Surprised to the upside with a reading of 57.0, exceeding the expected 55.2, highlighting the strength of the services sector.
Nvidia Shines Bright
Corporate earnings added to the bullish sentiment, led by Nvidia's impressive Q3 results. The company reported revenue of 35.08 billion dollars, significantly above the consensus estimate of 33.17 billion dollars. As a leader in AI-related technology and semiconductors, Nvidia's results lifted the broader tech sector and contributed to the S&P 500’s gains.
Market Sentiment and Seasonality
The Fear & Greed Index currently stands at 61, in the "Greed" zone, indicating a risk-on environment as investors show confidence in equities. Seasonality also plays a crucial role. Historically, the S&P 500 benefits from end-of-year trends, especially in an election year, when policymakers often aim to maintain market stability.
Challenges Ahead
While the current momentum is positive, the market faces significant tests next week with two major events:
FOMC Meeting (Tuesday): The Federal Reserve’s policy decisions and commentary will be in the spotlight. Investors will look for signals on whether the Fed plans to pause or keep the door open for further rate hikes in 2024.
PCE Inflation Report (Wednesday): The core PCE inflation data, the Fed's preferred measure of price pressures, could shape expectations for monetary policy. A higher-than-expected reading might increase concerns about further tightening, while a lower figure would reinforce the soft landing narrative.
Lingering Risks
In addition to the upcoming macroeconomic events, investors remain wary of:
Trade Policy: Former President Donald Trump’s proposed tariffs on imported goods could stoke inflation and weigh on economic growth.
Geopolitics: The ongoing risk of escalation in the Ukraine conflict continues to loom over global markets.
Soft Landing: The Baseline Scenario
Looking at the current data, the S&P 500 appears to be on the path to a soft landing, supported by a strong labor market and robust technology sector performance. Favorable seasonality—both year-end trends and election-year dynamics—further bolsters the case for continued gains, which remains the baseline scenario for now.
Conclusion
The S&P 500 has shown strength, but next week’s FOMC meeting and PCE inflation report could reshape market dynamics. The key question is whether the data will support the soft landing narrative or signal a need for further monetary tightening.
What are your thoughts on the S&P 500’s outlook given the upcoming Fed meeting and inflation data? Will the index sustain its rally, or are we in for increased volatility? Share your insights in the comments.

Gold: Strong Gains Driven by Global Uncertainty and DemandGold: Strong Gains Driven by Global Uncertainty and Demand
Last week, gold continued its upward trajectory, closing at $2,716 per ounce. The positive momentum in the gold market was driven by several key factors related to geopolitics, the global economy, and structural demand for the metal.
Geopolitics and Economic Uncertainty
One of the primary drivers of gold prices remains geopolitical uncertainty. The escalation of the conflict in Ukraine has prompted investors to seek safe havens, with gold, as a traditional "safe haven" asset, attracting significant capital inflows.
Additionally, economic uncertainty in the Eurozone and China is boosting demand for gold. In Europe, tensions stem from economic instability, while in China, concerns about a slowdown in key sectors of the economy weigh on market sentiment.
Inflation Concerns
The rising risk of a global inflation rebound also supports higher gold prices. The tariffs proposed by future President Donald Trump on goods imported into the U.S. could raise production costs and consumer prices, fueling inflation concerns. In such scenarios, gold becomes an attractive hedge against inflation.
Monetary Policy and Central Bank Purchases
Gold is also benefiting from the ongoing cycle of interest rate cuts around the world. Lower interest rates reduce the opportunity cost of holding gold, making it a more appealing investment asset.
Moreover, central banks continue to bolster their reserves by purchasing gold at a strong pace, a trend that supports the market amid increasing global uncertainties and inflation risks.
Emerging Economies Driving Demand
The economic growth of emerging markets, such as China and India, is another factor driving gold prices. These countries traditionally have high demand for gold, driven by cultural and investment preferences. As the wealth of these societies grows, demand for gold, both as an investment and in the form of jewelry, is likely to rise.
Conclusion
Gold remains a key beneficiary of global uncertainties, both geopolitical and economic. Factors such as escalating conflicts, inflation fears, loose monetary policy, and rising demand from emerging economies are bolstering its upward momentum.
Will gold maintain its current growth trajectory? Much depends on the future course of geopolitical and economic developments. For now, gold stands out as an attractive asset for investors seeking safety and inflation protection.
What are your forecasts for the gold market? Share your thoughts in the comments below.

Dollar Index (DXY): More Growth is Coming?!
Dollar Index looks very bullish with a formation of a cup & handle pattern
and a strong buying imbalance candle.
The market will most likely continue growing at least to 107.43
❤️Please, support my work with like, thank you!❤️

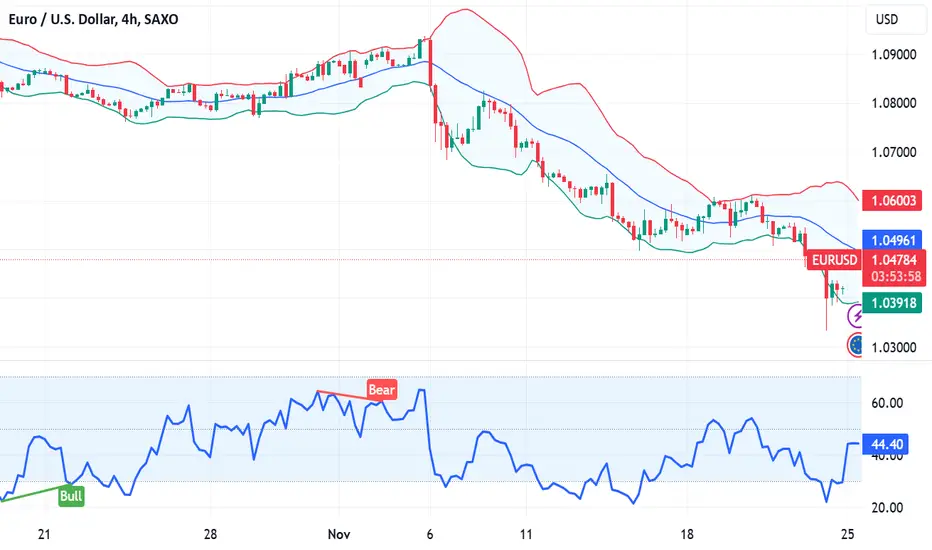
Fundamental Market Analysis for November 25, 2024 EURUSDThe US Dollar may strengthen as the latest US PMI data reinforces the likelihood that the Fed will slow the pace of rate cuts.
The Euro faced challenges as the latest HCOB PMI data pointed to continued weakness in Eurozone business activity.
EUR/USD recovered from the two-year low of 1.0332 recorded on Friday and traded near 1.0480 during Monday's Asian session. The rebound could be attributed to a correction in the US Dollar (USD) despite strong preliminary S&P Global US Purchasing Managers' Index (PMI) data released in the previous session.
Meanwhile, the US Dollar Index (DXY), which tracks the performance of the USD against six major currencies, slipped to 107.00 after hitting a two-year high of 108.07 on Friday. However, downside risks to the U.S. dollar remain limited as recent economic data has reinforced expectations that the Federal Reserve (Fed) may slow the pace of rate cuts.
The S&P Global US PMI composite index rose to 55.3 in November, indicating the strongest growth in private sector activity since April 2022. The US Services PMI rose to 57.0 from 55.0 in October and well above market expectations of 55.2, marking the sharpest growth in the services sector since March 2022. Meanwhile, the US manufacturing PMI rose to 48.8 from 48.5 in October, matching market forecasts.
Trade recommendation: Watch the level of 1.0480, when fixing below consider Sell positions, when rebounding consider Buy positions.
Gold Might be bullish...We need more dataLooking for price to break below the Asian range to fill in a FVG for London open. Trying to wait it out to see how price reacts to this area if it moves down there. It is a new week...

How Will a Strong Dollar Impact Emerging Forex Pairs?Persistent US dollar strength is poised to pose significant challenges for emerging market (EM) bonds and forex. As the greenback continues its upward trajectory, investors are advised to exercise caution and consider potential risks.
Why a Strong Dollar Matters for Emerging Markets
A stronger dollar generally makes it more expensive for emerging market countries to service their dollar-denominated debt. They need to exchange their local currency for US dollars to make payments. When the dollar appreciates, it requires more of their local currency to acquire the necessary amount of dollars.
Furthermore, a strong dollar can deter foreign investment in emerging markets. Investors may prefer to invest in US assets, which are perceived as safer and more stable. This can lead to capital flight from emerging markets, putting pressure on their currencies and economies.
Potential Risks for Emerging Market Bonds and Forex
Investors in emerging market bonds should be aware of the following risks:
1. Currency Risk: A weaker local currency can erode the value of bond investments. As the dollar strengthens, emerging market currencies may depreciate, reducing the value of bond holdings when converted back to the investor's home currency.
2. Interest Rate Risk: Rising interest rates in the US can lead to higher borrowing costs for emerging market countries. This can increase their debt burden and make it more difficult to service their debt obligations.
3. Default Risk: In extreme cases, a strong dollar and rising interest rates can push emerging market countries to the brink of default. This can result in significant losses for bondholders.
How to Mitigate Risks
While the risks associated with emerging market bonds are significant, investors can take steps to mitigate them:
1. Diversification: Diversifying investments across different emerging markets can help reduce exposure to specific country risks.
2. Currency Hedging: Investors can use currency hedging strategies to protect themselves from currency fluctuations.
3. Credit Rating Analysis: Carefully analyzing the creditworthiness of issuers can help identify bonds with lower default risk.
4. Consult with Financial Advisors: Seeking advice from experienced financial advisors can provide valuable insights and help develop a suitable investment strategy.
Conclusion
The persistent strength of the US dollar poses a significant threat to emerging market bonds. Investors should be mindful of the risks associated with these investments and take appropriate measures to protect their portfolios. By diversifying, hedging, and conducting thorough due diligence, investors can navigate the challenges posed by a strong dollar and potentially reap the rewards of emerging market growth.
It is important to note that this article is for informational purposes only and should not be construed as financial advice. Always consult with a qualified financial advisor before making any investment decisions.2

Nasdaq: Gains Driven by Data, Eyes on Key Events Next WeekNasdaq: Gains Driven by Data, Eyes on Key Events Next Week
The Nasdaq ended the week on a positive note, buoyed by strong economic data, robust corporate earnings, and supportive seasonality. However, investors are shifting their focus to critical upcoming events: the FOMC meeting on Tuesday and the PCE inflation report on Wednesday. These events have the potential to set the tone for the markets for the remainder of the year.
Mixed Economic Data
The past week brought a blend of economic data, with some encouraging signals and a few disappointments:
- Initial Jobless Claims (Nov. 16): At 213K, the result came in better than the 220K consensus, underscoring the resilience of the labor market and reducing recession fears.
- Philadelphia Fed Manufacturing Index (Nov.): Disappointed at -5.5 against expectations of 8, reflecting continued weakness in the manufacturing sector.
- Michigan Consumer Sentiment Final (Nov.): Came in at 71.8, below the 73.7 forecast, indicating a slight dip in consumer confidence.
- S&P Global Services PMI Flash (Nov.): Surprised to the upside with a reading of 57.0, exceeding the expected 55.2, highlighting the strength of the services sector.
Nvidia Shines Bright
Corporate earnings added to the bullish sentiment, led by Nvidia's impressive Q3 results. The company reported revenue of 35.08 billion dollars, significantly above the consensus estimate of 33.17 billion dollars. As a leader in AI-related technology and semiconductors, Nvidia's results lifted the broader tech sector and contributed to Nasdaq's gains.
Market Sentiment and Seasonality
The Fear & Greed Index currently stands at 61, in the "Greed" zone, indicating a risk-on environment as investors show confidence in equities. Seasonality also plays a crucial role. Historically, Nasdaq benefits from end-of-year trends, especially in an election year, when policymakers often aim to maintain market stability.
Challenges Ahead
While the current momentum is positive, the market faces significant tests next week with two major events:
1. FOMC Meeting (Tuesday): The Federal Reserve’s policy decisions and commentary will be in the spotlight. Investors will look for signals on whether the Fed plans to pause or keep the door open for further rate hikes in 2024.
2. PCE Inflation Report (Wednesday): The core PCE inflation data, the Fed's preferred measure of price pressures, could shape expectations for monetary policy. A higher-than-expected reading might increase concerns about further tightening, while a lower figure would reinforce the soft landing narrative.
Lingering Risks
In addition to the upcoming macroeconomic events, investors remain wary of:
- Trade Policy: Former President Donald Trump’s proposed tariffs on imported goods could stoke inflation and weigh on economic growth.
- Geopolitics: The ongoing risk of escalation in the Ukraine conflict continues to loom over global markets.
Soft Landing: The Baseline Scenario
Looking at the current data, the Nasdaq appears to be on the path to a soft landing, supported by a strong labor market and robust technology sector performance. Favorable seasonality—both year-end trends and election-year dynamics—further bolsters the case for continued gains, which remains the baseline scenario for now.
Conclusion
The Nasdaq has shown strength, but next week’s FOMC meeting and PCE inflation report could reshape market dynamics. The key question is whether the data will support the soft landing narrative or signal a need for further monetary tightening.
What are your thoughts on the Nasdaq’s outlook given the upcoming Fed meeting and inflation data? Will the index sustain its rally, or are we in for increased volatility? Share your insights in the comments.

EUR/USD: Euro Weakens as the US Dollar Gains StrengthEUR/USD: Euro Weakens as the US Dollar Gains Strength
The EUR/USD pair continued to decline last week, losing 2.8%. This marks another week of euro weakness, driven by poor economic data from the eurozone and strong US indicators that underscore the resilience of the American economy and reduce expectations for Federal Reserve rate cuts.
Strong US Data Bolsters the Dollar
Key economic data from the US reinforced the dollar’s strength, reflecting the underlying robustness of its economy:
- Initial Jobless Claims (Nov. 16): Reported at 213K, outperforming the 220K forecast, indicating a stable US labor market.
- S&P Global Services PMI Flash (Nov.): Came in at 57.0, significantly above the 55.2 expectation, highlighting strong activity in the US services sector.
These figures diminish the likelihood of imminent rate cuts by the Federal Reserve, maintaining the dollar’s attractiveness to investors.
Weak Eurozone Data Pressures the Euro
On the other hand, disappointing data from the eurozone added considerable pressure on the euro:
- HCOB Composite PMI Flash (Nov.): Dropped to 48.1 (below the 50 threshold indicating contraction), missing the forecast of 50.
- HCOB Manufacturing PMI Flash (Nov.): Fell to 45.2, underperforming the expected 46.
- HCOB Services PMI Flash (Nov.): Declined to 49.2, well below the 51.6 forecast.
The eurozone’s sluggish growth, coupled with inflation stabilizing around 2%, makes a strong case for the European Central Bank (ECB) to accelerate rate cuts. With eurozone rates at 3.4% compared to 4.75% in the US, the dollar’s yield advantage makes it more appealing to investors.
Policy Divergence and Trade Risks
The divergence in monetary policy between the US and the eurozone is a significant driver of EUR/USD’s weakness. While the ECB seems poised to continue cutting rates, the Federal Reserve may slow its actions or even pause. Further boosting the dollar is the potential for future President Donald Trump’s proposed tariffs on imported goods, which could strengthen the US economy and delay rate cuts.
Seasonality: A Possible Lifeline for EUR/USD
Despite the euro’s bearish outlook, seasonality could offer some support to EUR/USD. Historically, December has often been a favorable month for the pair, which might provide temporary relief for the euro in the coming weeks.
Conclusion
EUR/USD remains under significant pressure due to weak eurozone data, monetary policy divergence, and the dollar’s relative strength. Unless there’s a major shift in economic dynamics or central bank decisions, the euro is likely to stay on the defensive.
Will seasonal trends be enough to support the euro, or will the downward trajectory continue? Share your thoughts in the comments!

Gold: Strong Gains Driven by Global Uncertainty and DemandGold: Strong Gains Driven by Global Uncertainty and Demand
Last week, gold continued its upward trajectory, closing at $2,716 per ounce. The positive momentum in the gold market was driven by several key factors related to geopolitics, the global economy, and structural demand for the metal.
Geopolitics and Economic Uncertainty
One of the primary drivers of gold prices remains geopolitical uncertainty. The escalation of the conflict in Ukraine has prompted investors to seek safe havens, with gold, as a traditional "safe haven" asset, attracting significant capital inflows.
Additionally, economic uncertainty in the Eurozone and China is boosting demand for gold. In Europe, tensions stem from economic instability, while in China, concerns about a slowdown in key sectors of the economy weigh on market sentiment.
Inflation Concerns
The rising risk of a global inflation rebound also supports higher gold prices. The tariffs proposed by future President Donald Trump on goods imported into the U.S. could raise production costs and consumer prices, fueling inflation concerns. In such scenarios, gold becomes an attractive hedge against inflation.
Monetary Policy and Central Bank Purchases
Gold is also benefiting from the ongoing cycle of interest rate cuts around the world. Lower interest rates reduce the opportunity cost of holding gold, making it a more appealing investment asset.
Moreover, central banks continue to bolster their reserves by purchasing gold at a strong pace, a trend that supports the market amid increasing global uncertainties and inflation risks.
Emerging Economies Driving Demand
The economic growth of emerging markets, such as China and India, is another factor driving gold prices. These countries traditionally have high demand for gold, driven by cultural and investment preferences. As the wealth of these societies grows, demand for gold, both as an investment and in the form of jewelry, is likely to rise.
Conclusion
Gold remains a key beneficiary of global uncertainties, both geopolitical and economic. Factors such as escalating conflicts, inflation fears, loose monetary policy, and rising demand from emerging economies are bolstering its upward momentum.
Will gold maintain its current growth trajectory? Much depends on the future course of geopolitical and economic developments. For now, gold stands out as an attractive asset for investors seeking safety and inflation protection.
What are your forecasts for the gold market? Share your thoughts in the comments below.

EURUSD: Detailed Support & Resistance Analysis 🇪🇺🇺🇸
Here is my latest structure analysis
and important support & resistance levels/zones on EURUSD for next week.
Support 1: 1.030 - 1.033 area
Support 2: 1.016 - 1.024 area
Support 3: 1.008 - 1.009 area
Support 4: 0.994 - 0.997 area
Support 5: 0.962 - 0.975 area
Support 6: 0.953 - 0.960 area
Resistance 1: 1.045 - 1.053 area
Resistance 2: 1.060 - 1.062 area
Resistance 3: 1.066 - 1.069 area
Resistance 4: 1.094 - 1.094 area
Resistance 5: 1.099 - 1.101 area
Resistance 6: 1.120 - 1.128 area
Consider these structures for pullback/breakout trading.
❤️Please, support my work with like, thank you!❤️

S&P 500: Gains Driven by Data, Eyes on Key Events Next WeekS&P 500: Gains Driven by Data, Eyes on Key Events Next Week
The S&P 500 ended the week on a positive note, buoyed by strong economic data, robust corporate earnings, and supportive seasonality. However, investors are shifting their focus to critical upcoming events: the FOMC meeting on Tuesday and the PCE inflation report on Wednesday. These events have the potential to set the tone for the markets for the remainder of the year.
Mixed Economic Data
The past week brought a blend of economic data, with some encouraging signals and a few disappointments:
Initial Jobless Claims (Nov. 16): At 213K, the result came in better than the 220K consensus, underscoring the resilience of the labor market and reducing recession fears.
Philadelphia Fed Manufacturing Index (Nov.): Disappointed at -5.5 against expectations of 8, reflecting continued weakness in the manufacturing sector.
Michigan Consumer Sentiment Final (Nov.): Came in at 71.8, below the 73.7 forecast, indicating a slight dip in consumer confidence.
S&P Global Services PMI Flash (Nov.): Surprised to the upside with a reading of 57.0, exceeding the expected 55.2, highlighting the strength of the services sector.
Nvidia Shines Bright
Corporate earnings added to the bullish sentiment, led by Nvidia's impressive Q3 results. The company reported revenue of 35.08 billion dollars, significantly above the consensus estimate of 33.17 billion dollars. As a leader in AI-related technology and semiconductors, Nvidia's results lifted the broader tech sector and contributed to the S&P 500’s gains.
Market Sentiment and Seasonality
The Fear & Greed Index currently stands at 61, in the "Greed" zone, indicating a risk-on environment as investors show confidence in equities. Seasonality also plays a crucial role. Historically, the S&P 500 benefits from end-of-year trends, especially in an election year, when policymakers often aim to maintain market stability.
Challenges Ahead
While the current momentum is positive, the market faces significant tests next week with two major events:
FOMC Meeting (Tuesday): The Federal Reserve’s policy decisions and commentary will be in the spotlight. Investors will look for signals on whether the Fed plans to pause or keep the door open for further rate hikes in 2024.
PCE Inflation Report (Wednesday): The core PCE inflation data, the Fed's preferred measure of price pressures, could shape expectations for monetary policy. A higher-than-expected reading might increase concerns about further tightening, while a lower figure would reinforce the soft landing narrative.
Lingering Risks
In addition to the upcoming macroeconomic events, investors remain wary of:
Trade Policy: Former President Donald Trump’s proposed tariffs on imported goods could stoke inflation and weigh on economic growth.
Geopolitics: The ongoing risk of escalation in the Ukraine conflict continues to loom over global markets.
Soft Landing: The Baseline Scenario
Looking at the current data, the S&P 500 appears to be on the path to a soft landing, supported by a strong labor market and robust technology sector performance. Favorable seasonality—both year-end trends and election-year dynamics—further bolsters the case for continued gains, which remains the baseline scenario for now.
Conclusion
The S&P 500 has shown strength, but next week’s FOMC meeting and PCE inflation report could reshape market dynamics. The key question is whether the data will support the soft landing narrative or signal a need for further monetary tightening.
What are your thoughts on the S&P 500’s outlook given the upcoming Fed meeting and inflation data? Will the index sustain its rally, or are we in for increased volatility? Share your insights in the comments.

Nasdaq: Gains Driven by Data, Eyes on Key Events Next WeekNasdaq: Gains Driven by Data, Eyes on Key Events Next Week
The Nasdaq ended the week on a positive note, buoyed by strong economic data, robust corporate earnings, and supportive seasonality. However, investors are shifting their focus to critical upcoming events: the FOMC meeting on Tuesday and the PCE inflation report on Wednesday. These events have the potential to set the tone for the markets for the remainder of the year.
Mixed Economic Data
The past week brought a blend of economic data, with some encouraging signals and a few disappointments:
- Initial Jobless Claims (Nov. 16): At 213K, the result came in better than the 220K consensus, underscoring the resilience of the labor market and reducing recession fears.
- Philadelphia Fed Manufacturing Index (Nov.): Disappointed at -5.5 against expectations of 8, reflecting continued weakness in the manufacturing sector.
- Michigan Consumer Sentiment Final (Nov.): Came in at 71.8, below the 73.7 forecast, indicating a slight dip in consumer confidence.
- S&P Global Services PMI Flash (Nov.): Surprised to the upside with a reading of 57.0, exceeding the expected 55.2, highlighting the strength of the services sector.
Nvidia Shines Bright
Corporate earnings added to the bullish sentiment, led by Nvidia's impressive Q3 results. The company reported revenue of 35.08 billion dollars, significantly above the consensus estimate of 33.17 billion dollars. As a leader in AI-related technology and semiconductors, Nvidia's results lifted the broader tech sector and contributed to Nasdaq's gains.
Market Sentiment and Seasonality
The Fear & Greed Index currently stands at 61, in the "Greed" zone, indicating a risk-on environment as investors show confidence in equities. Seasonality also plays a crucial role. Historically, Nasdaq benefits from end-of-year trends, especially in an election year, when policymakers often aim to maintain market stability.
Challenges Ahead
While the current momentum is positive, the market faces significant tests next week with two major events:
1. FOMC Meeting (Tuesday): The Federal Reserve’s policy decisions and commentary will be in the spotlight. Investors will look for signals on whether the Fed plans to pause or keep the door open for further rate hikes in 2024.
2. PCE Inflation Report (Wednesday): The core PCE inflation data, the Fed's preferred measure of price pressures, could shape expectations for monetary policy. A higher-than-expected reading might increase concerns about further tightening, while a lower figure would reinforce the soft landing narrative.
Lingering Risks
In addition to the upcoming macroeconomic events, investors remain wary of:
- Trade Policy: Former President Donald Trump’s proposed tariffs on imported goods could stoke inflation and weigh on economic growth.
- Geopolitics: The ongoing risk of escalation in the Ukraine conflict continues to loom over global markets.
Soft Landing: The Baseline Scenario
Looking at the current data, the Nasdaq appears to be on the path to a soft landing, supported by a strong labor market and robust technology sector performance. Favorable seasonality—both year-end trends and election-year dynamics—further bolsters the case for continued gains, which remains the baseline scenario for now.
Conclusion
The Nasdaq has shown strength, but next week’s FOMC meeting and PCE inflation report could reshape market dynamics. The key question is whether the data will support the soft landing narrative or signal a need for further monetary tightening.
What are your thoughts on the Nasdaq’s outlook given the upcoming Fed meeting and inflation data? Will the index sustain its rally, or are we in for increased volatility? Share your insights in the comments.

Gold: Strong Gains Driven by Global Uncertainty and DemandGold: Strong Gains Driven by Global Uncertainty and Demand
Last week, gold continued its upward trajectory, closing at $2,716 per ounce. The positive momentum in the gold market was driven by several key factors related to geopolitics, the global economy, and structural demand for the metal.
Geopolitics and Economic Uncertainty
One of the primary drivers of gold prices remains geopolitical uncertainty. The escalation of the conflict in Ukraine has prompted investors to seek safe havens, with gold, as a traditional "safe haven" asset, attracting significant capital inflows.
Additionally, economic uncertainty in the Eurozone and China is boosting demand for gold. In Europe, tensions stem from economic instability, while in China, concerns about a slowdown in key sectors of the economy weigh on market sentiment.
Inflation Concerns
The rising risk of a global inflation rebound also supports higher gold prices. The tariffs proposed by future President Donald Trump on goods imported into the U.S. could raise production costs and consumer prices, fueling inflation concerns. In such scenarios, gold becomes an attractive hedge against inflation.
Monetary Policy and Central Bank Purchases
Gold is also benefiting from the ongoing cycle of interest rate cuts around the world. Lower interest rates reduce the opportunity cost of holding gold, making it a more appealing investment asset.
Moreover, central banks continue to bolster their reserves by purchasing gold at a strong pace, a trend that supports the market amid increasing global uncertainties and inflation risks.
Emerging Economies Driving Demand
The economic growth of emerging markets, such as China and India, is another factor driving gold prices. These countries traditionally have high demand for gold, driven by cultural and investment preferences. As the wealth of these societies grows, demand for gold, both as an investment and in the form of jewelry, is likely to rise.
Conclusion
Gold remains a key beneficiary of global uncertainties, both geopolitical and economic. Factors such as escalating conflicts, inflation fears, loose monetary policy, and rising demand from emerging economies are bolstering its upward momentum.
Will gold maintain its current growth trajectory? Much depends on the future course of geopolitical and economic developments. For now, gold stands out as an attractive asset for investors seeking safety and inflation protection.
What are your forecasts for the gold market? Share your thoughts in the comments below.

GBPUSD SHORT TO $1.24300 (UPDATE)Well done to everyone who got into GU sell's from my analysis yesterday! GBPUSD is now running 95 PIPS in profit so far & inching closer to out TP which should hit early next week📉

DXY - Long Term ScenariosDXY / Dollar is looking very strong and can break above resistance and target higher levels. A break of Support Level will open lower levels. MAs are coming closer and a cross will confirm Bearish move.
Best approach is to go from level to level rather than aiming for a swing move as sentiments can switch anytime.
For entries, please wait for at least two candle reversals at the specified level and apply appropriate risk management.
If you found this analysis helpful, please consider boosting and following for more updates.
Disclaimer: This content is for educational purposes only and should not be considered financial advice.

50% fib retracement vs macroeconomics price has made new low of the range
price testing big horizontal support zone
price testing 50% fib of two years old bull market
lets see how fundamental analysis aka monetary economics fit into this simple fib retracement
and market found a reason to go up from here
