AUD/USD – Rejection at 2025 High?By: MJTrading
📉 AUD/USD – Rejection at 2025 High?
The Aussie is struggling at its 2025 high, printing successive lower highs (LH) and flirting with the 60-period EMA. With momentum leaning bearish, a short opportunity opens up near 0.64878, targeting the 0.64094 support zone. Confirmation from the EMA breakdown and rejection wicks strengthens the setup. Stop-loss above 0.65285 protects against a breakout trap.
Entry: 0.64883
Stop Loss: 0.65285
TP1: 0.64500
TP2: 0.64100
#Hashtags: #AUDUSD #ForexTrading #TechnicalAnalysis #ReversalSetup #BearishBias #LowerHighs #EMARejection #ShortThePop #PriceAction
Dollar

Gold now pushing bullish for new LevelsWaited for this Move all day yesterday and it didnt start till London session. Oh well happens some time! Looking for the Weekly Low level to be broken so we can continue the bullish activity.

$DXY Repeating 2016 Post-Election I have highlighted the 2016 to 2020 Presidential Elections time period and then pasted that timeframe onto the 2024 election and found that the pattern is going along very similarly to Trump 1.0.
If we assume that the future unfolds the same as last time, which is low probability, of course, then the future will unfold as shown in the yellow bars going into the future, as shown.
Initially in 2016 post election there was a 7% rally in the U.S. Dollar Index and then a 15% retreat for the following year. So far in 2025 we have seen the same rally and a similar decline, but only faster this time.
It would appear as thought the bulk majority of the declines in the TVC:DXY are over at this time with perhaps 4% further downside over the balance of the year.
The Dollar Index has been useful for predicting changes in the earnings estimates for the S&P500 in the USA due to the high percentage of earnings coming back to the US for quarterly reporting. I have posted a few charts in the past which have been helpful at determining the risk in the stock market.
The behavior of the global central banks has certainly had its impact on monetary aggregates and inflation. The policy response since the Covid Pandemic has been for maximum liquidity and maximum Government spending to keep the global economy afloat. The post-Covid response is now coming to a head along with new policy directives to cut wasteful Government spending and to reduce inflation (caused the Gov't spending).
Global investors have flocked to the US for access to high technology stocks and have driven up the value of US assets to extreme levels compared to other markets. This adjustment phase where investors remove money from overvalued, or highly valued, US assets back to other markets has created a wave of selling in the US Dollar and US listed equities.
What does the future hold? We never know but we sure can learn from what happened in the past by looking at charts just like this one to see what may happen. Looks like a bounce in the TVC:DXY from here, followed by a new low and then a rebound into the next few years.
All the best,
Tim
April 22, 2025 1:16PM EST TVC:DXY 98.78 last

Dollar - Short term Bullish again (Mainly Bearish)Looks like Dollar wants to come back into the range we broke down from. I am still bearish dollar but no point getting into longer term "bearish" dollar trades yet

Patience has to be the Major Play in waiting on these Set ups! Was waiting for the sweep on gold to happen and they didnt do it till the very end of the day yesterday. Looking for the bullish action to continue. If we can get a breakout tonight then i will look for possible levels of support.

GBPUSD Breakout and Potential RetraceHey Traders, in today's trading session we are monitoring GBPUSD for a buying opportunity around 1.35900 zone, GBPUSD was trading in a downtrend and successfully managed to break it out. Currently is in a correction phase in which it is approaching the retrace area at 1.35900 support and resistance area.
Trade safe, Joe.

24th JuneTA: Many confluences for a bearish bias. Only confirmation needed for high probability price action is running (closing below 4H SL) on 1H. We have to exercise some caution, because price is still in the area of the monthly sweep. For a trade PA has to give us optimal behaviour.
News: Powell testifies at 10:00am. This could lead to a very quick move below the swept monthly low.

AUDUSD - 4h |||Check this out for comprehensive analysis...
#AUSUSD #MJTRADING #FOREX #FXsignals #chart

Have we made a Low for the Week yet on Gold???Im looking for price to sweep Monday's low before deciding what it wants to do. I want to see everything line up inside of the killzone to take advantage. Just have to be patient. We still have a lil time so sitting on my hands until it all looks clear to proceed with the move.

Bottom in for the dollar against the EuroI know many people are calling for the decline of the dollar and to invest in Europe, but the chart shows a different picture.
The chart shows that the dollar has bottomed against the Euro and looks set to make a run at the highs.
I think over the coming months/years, the dollar will go back above par against the Euro and will likely outperform the Euro for the coming years.
The recent decline in the dollar was just to backtest support, and now that we have done that, I think the bottom is in.
Breaking above the trend line should accelerate the bullish move.

New Week! New Opportunities on GOLD! With the recent activity in the middle east expecting prices to continue bullish. I was looking for this move last week but it seems the holiday delayed the process. If we can get a full breakout above the previous daily High level that will be confidence that we are moving bullish for the rest of the week.

Dollar's Decline: Global Economic ShiftsYou're probably wondering why I'm talking about the dollar on the Bitcoin chart. It's because I want you to look a few steps ahead.
That's why this post is for people like that.
1. Global Economic Transformations: Collapse of the Jamaican Monetary System
Insights and Logic:
We are witnessing the end of the Jamaican monetary system, established in 1976 following the collapse of the Bretton Woods system.
The Jamaican system's key feature is free (yet conditionally market-driven) exchange rates and the global dominance of the U.S. dollar.
For decades, the U.S. utilized the dollar's reserve currency status to finance budget and trade deficits without equivalent value returns—a beneficial "global tax."
Facts:
Currently, over 60% of global reserves are denominated in dollars (IMF data), but diversification is accelerating.
The U.S. is facing a "liquidity trap": to sustain markets, the Fed must print money, exacerbating inflation and weakening the dollar's global effectiveness.
Analogy:
Just as Nixon abolished the gold standard in 1971, we are now witnessing the abolition of the dollar's global standard—not abandoning the dollar as a reserve currency, but its monopoly.
2. Political Environment in the U.S.: Trump, Tariffs, and Managed Uncertainty
Insights:
Court decisions against Trump's tariffs are political tools, especially prior to congressional elections.
Democrats aren't just fighting for power—they systematically undermine Trump's economic policies in voters' eyes.
Systematic Explanation:
Virtually any presidential decree in the U.S. can be challenged legally. Lower-court decisions rarely withstand appeals, yet they create temporary buffers allowing policy adjustments.
This enables Trump to recalibrate his trade model systematically without losing face.
Conclusion:
The U.S. operates under "managed uncertainty," where seemingly chaotic political behaviors are structured adaptation mechanisms to global changes.
3. Mass Market and Sixth Technological Paradigm: NBIC as Foundation for Future Growth
Insights:
The future mass market will be built around NBIC technologies:
* Nano—new materials and sensors;
* Bio—biotech, genetic engineering, life extension;
* Info—digital platforms, neural networks, blockchain;
* Cogno—cognitive interfaces, AI, neural interfaces.
Historical Analogy:
Just as cars and mobile phones defined the mass market of the 20th century, longevity treatments, AI services, and neural devices will define the 21st century.
Facts:
Examples of current "false starts": Nvidia, Palantir, OpenAI—stock price volatility relates not to technology failures but premature valuation.
Forecast:
The next 20 years will see growth in new sectors, dominated by those capturing mass consumers, not just investors.
4. Digitalization and Geo-economics: Telegram, AI, and Control
Facts:
Telegram plans to integrate Grok neural network—a signal of the digital merger of communication, payment platforms, and behavioral analytics.
Insight:
Telegram as a future super-app: messaging, finance, AI assistance—all-in-one.
This is a media reset: traditional platforms like Bloomberg and CNBC lose influence to those controlling data flows directly.
Conclusion:
Information landscapes become automated—algorithms, not journalists, manage narratives.
5. **Europe: From "Progress Locomotive" to Stagnation and Subcontracting**
Facts:
Germany has been in recession for three consecutive years. The average age is 46.
Pension burdens and social standards make the economic model (Rhineland capitalism) unsustainable.
Ideological Crisis:
Europe is split into "transhumanist" (West) and "neoconservative" (East) factions.
The neoconservative revolution is gaining ground in Hungary, Poland, Slovakia, Romania, and even eastern Germany.
Conclusion:
Europe is skipping the sixth technological paradigm, becoming a "comfortable but uncompetitive" zone. Europe's "Japanification"—a path without acute crises but also without growth.
6. Future Growth Centers: Asia and the Global South with Risks
Facts and Locations:
Indonesia, Vietnam, Thailand—dynamic economies with high ROI and moderate political risks.
Philippines, Taiwan—potential proxy-conflict zones between the U.S. and China.
Logic:
Global capital moves towards higher returns rather than better living standards.
Asia becomes a new economic and geopolitical battleground similar to 20th-century Europe.
7. Role of Cryptocurrencies and USDT, USDC: Transition to Digital Dollar
Facts:
U.S. authorities view cryptocurrencies, especially USDT, as tools to reboot the dollar model.
USDT effectively integrates the dollar into the crypto economy, maintaining Treasury demand and allowing dollar exports outside the U.S.
Insights:
Unlike CBDCs, the U.S. digital dollar (via stablecoins) enables global expansion rather than local control.
The U.S. aims to lead the new monetary evolution—digital dominance instead of fiat.
8. Prospects in Latin America: Argentina, Mexico, and Risks
Argentina Analysis:
President Milei implements neoliberal reforms akin to Ukraine's: reduced state role and deregulation.
Possible outcomes: deindustrialization, increased poverty, export dependency.
Positives:
No war risks, resource-rich (oil, wine, food), good medicine and education standards (legacy).
Mexico:
High growth yet severe crime levels—excellent for business, risky for life.
9. Global Hybrid War Instead of a Third World War
Concept:
Not a "world war" but a global hybrid war: multiple power centers, proxy conflicts, shifting alliances.
Theaters of conflict: Asia (especially the South China Sea), potentially the Middle East and Africa.
Strategic Conclusion:
Avoid proxy countries; prefer "neutral dynamic" regions like Indonesia, Vietnam.
About DXY
I have been talking about the fall of the dollar index for a very long time.
September is coming soon
Best regards EXCAVO

You've Already Lost: The Bitcoin Delusion of FOMO and False HopeLet’s get one thing straight: if you’re staring at Bitcoin, squinting past the red flags, and convincing yourself it’s not a Ponzi scheme because of that one shiny feature that screams “legit,” you’re not investing—you’re auditioning for the role of “next victim.” And if your motivation is the fear of missing out (FOMO) or the fantasy of getting rich quick, well... congratulations. You’ve already lost.
The 99%: Red Flags Waving Like It’s a Parade
Let’s talk about the indicators—the ones that make Bitcoin look suspiciously like a Ponzi scheme. No, it’s not technically one, but the resemblance is uncanny:
- No intrinsic value: Bitcoin isn’t backed by assets, cash flow, or a government. It’s worth what the next person is willing to pay. That’s not investing. That’s speculative hot potato.
- Early adopters profit from new entrants: The people who got in early? They’re cashing out while newcomers buy in at inflated prices. That’s the classic Ponzi dynamic: old money out, new money in.
- Hype over utility: Bitcoin’s actual use as a currency is minimal. It’s slow, expensive to transact, and volatile. But hey, who needs functionality when you’ve got memes and moon emojis?
- Opaque influencers: From anonymous creators (hello, Satoshi) to crypto bros promising Lambos, the ecosystem thrives on charisma, not accountability.
- Scam magnet: Bitcoin has been the currency of choice for over 1,700 Ponzi schemes and scams, according to a University of New Mexico study cs.unm.edu . That’s not a coincidence. That’s a pattern.
The 1%: The “But It’s Decentralized!” Defense
Ah yes, the one redeeming quality that Bitcoin evangelists cling to like a life raft: decentralization. No central authority! No government control! It’s the financial revolution!
Except… decentralization doesn’t magically make something a good investment. It just means no one’s in charge when things go wrong. And when the market crashes (again), you can’t call customer service. You can tweet into the void, though.
FOMO: The Real Engine Behind the Madness
Let’s be honest. Most people aren’t buying Bitcoin because they believe in the tech. They’re buying because they saw someone on TikTok turn $500 into a Tesla. FOMO is the fuel, and social media is the match.
Bitcoin’s meteoric rises are often driven by hype cycles, not fundamentals. Tesla buys in? Price spikes. El Salvador adopts it? Price spikes. Your cousin’s dog walker says it’s going to $1 million? Price spikes. Then it crashes. Rinse, repeat.
This isn’t investing. It’s gambling with a tech-savvy twist.
The Punchline: You’ve Already Lost
If you’re ignoring the overwhelming signs of speculative mania and clinging to the one feature that makes you feel better about your decision, you’re not ahead of the curve—you’re the mark. And if your motivation is “I don’t want to miss out,” you already have. You’ve missed out on rational thinking, due diligence, and the ability to distinguish between innovation and illusion.
Bitcoin might not be a Ponzi scheme in the legal sense. But if it walks like one, talks like one, and makes early adopters rich at the expense of latecomers… maybe it’s time to stop pretending it’s something else.
INDEX:BTCUSD NYSE:CRCL NASDAQ:HOOD TVC:DXY NASDAQ:MSTR TVC:SILVER TVC:GOLD NASDAQ:TSLA NASDAQ:COIN NASDAQ:MARA

Dow Jones potential down side moveDow Jones is showing some sign of wanting to go short with also the potential dollar strength coming into the markets and the bond yield markets having a bullish trend for the last couple of months. Dow has reach a full fib extension and we could see some form of retracement continuation.

Dollar - Slightly Bullish Short Term but overall bearishDollar
Just expressing my feel on the dollar for the coming week

Middle East Tension: Read This Before You Trade today⚔️🕊️💣 Middle East Tension: Read This Before Markets close for the Weekend 🌍🔥✌️
Video:
Hey traders,
Today’s landscape is delicate and raw: we stand between a possible US strike on Iran and a chance for leaders to step back from the edge. Many are asking: Should I bet on gold? Should I short the indices? Should I buy oil?
Here’s my honest read, straight from today’s video (which I highly recommend you watch for full context 📺):
👉 Bitcoin (BTC)
Still ranging sideways. The last move hit my resistance zone perfectly. For now, BTC keeps its cool — but watch out: global fear can spark sudden moves, or the opposite, a liquidity crunch.
👉 Gold & Silver
Yes, they’re classic safe havens — but don’t fall for the textbook trap. When true chaos strikes, big players often sell profitable gold positions to cover losses elsewhere. So an initial spike is possible, but deep pockets can reverse it fast. This is why I’m cautious: I do not expect a guaranteed pump on gold or silver.
👉 Crude Oil (WTI)
The chart says it all: any strike in the Middle East fuels oil prices fast. But as I’ve always said — I do not long oil during human tragedy. Ethics over easy pips.
👉 Indices & USDJPY
Gaps are likely. Risk assets may get hammered if bombs fall. If leaders choose dialogue instead, expect a risk-on rebound. The USD stays a wildcard: trust in the US remains, but shocks test that trust.
👉 Airlines Pausing Flights?
Yes — major airlines are avoiding the Gulf. That alone signals how real this risk is.
✅ My plan is clear:
I never short disasters. I never profit from pain. I am LONG on humanity and peace. I’d rather lose a trade than wish for blood in the streets.
I do have some carefully calculated positions open tonight — fully risk-managed and small-sized. If Monday gaps bless me, fine. If peace wins and my trades lose? Even better.
👉 Watch the full video for my live charts, context, and unfiltered thoughts.
This text is just a recap — the full idea is already posted as a video.
Stay sharp. Stay ethical. Protect your capital and your soul — one good trade is never worth your humanity.
One Love,
The FXPROFESSOR 💙
Disclosure: I am happy to be part of the Trade Nation's Influencer program and receive a monthly fee for using their TradingView charts in my analysis. Awesome broker, where the trader really comes first! 🌟🤝📈

Middle East Tension & Markets: My Honest Stance🌍🕊️✌️ Middle East Tension & Markets: My Honest Stance 💣 🔥 🗡️
Hi everyone,
It’s Friday, June 20th — and we face a fragile moment: the uncertainty of possible US military action against Iran. 📉📰✈️
On my charts:
Bitcoin (BTC) reached key resistance and now ranges sideways as we await clarity.
Gold (XAUUSD) remains the classic safe haven — it holds an ascending structure, but profit-taking could trigger dips if markets crash.
Silver (XAGUSD) is similar, yet needs broader industrial strength to outperform gold.
Crude Oil (WTI) could spike dramatically if bombs fall — but I choose not to profit from pain.
USDJPY & USD pairs reflect global trust in the dollar and US stability — I’ll cover this more next week.
My personal stance is simple:
💙 I never short disasters. I never profit from human suffering. I am LONG on humanity and peace. 🕊️✌️🌈
👉 I expect potential market gaps between now and Monday:
✅ Bad news (war) → gold, silver, oil likely pump
✅ Good news (diplomacy) → risk assets rebound, oil stabilizes
I am positioned carefully with small risk and clear stops. My goal: protect my capital, trade my plan, but never bet on pain. If I lose because peace prevails — I win as a human.
Stay safe, trade wisely, and never forget: sometimes the best trade is no trade at all.
One Love,
The FXPROFESSOR 💙
Disclosure: I am happy to be part of the Trade Nation's Influencer program and receive a monthly fee for using their TradingView charts in my analysis. Awesome broker, where the trader really comes first! 🌟🤝📈

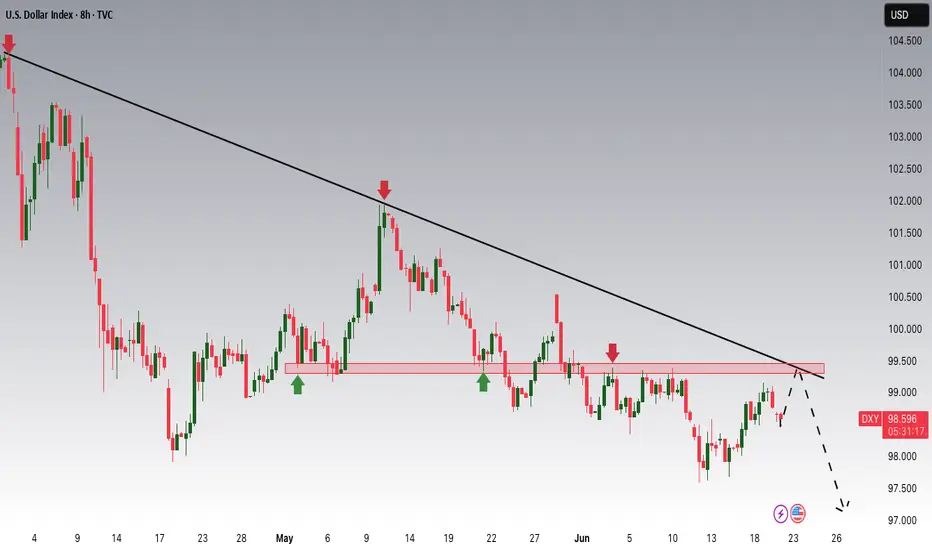
DXY Potential DownsidesHey Traders, in today's trading session we are monitoring DXY for a selling opportunity around 99.300 zone, DXY is trading in a downtrend and currently is in a correction phase in which it is approaching the trend at 99.300 support and resistance area.
Trade safe, Joe.
Holiday yesterday so no play! can we get it today?As we get ready to close out the week we are looking for the reversal to play out. We have been in a casual consolidation all week. Just looking for price to step outside of value one more time so that we can get a entry for it to continue pushing bullish.

Gold Finally Swept the Lows!!!!Waited for this all damn day and it didnt happen till just before the day closed. Now looking for the action to continue. If they give signs before the killzone then its a go going into London session.

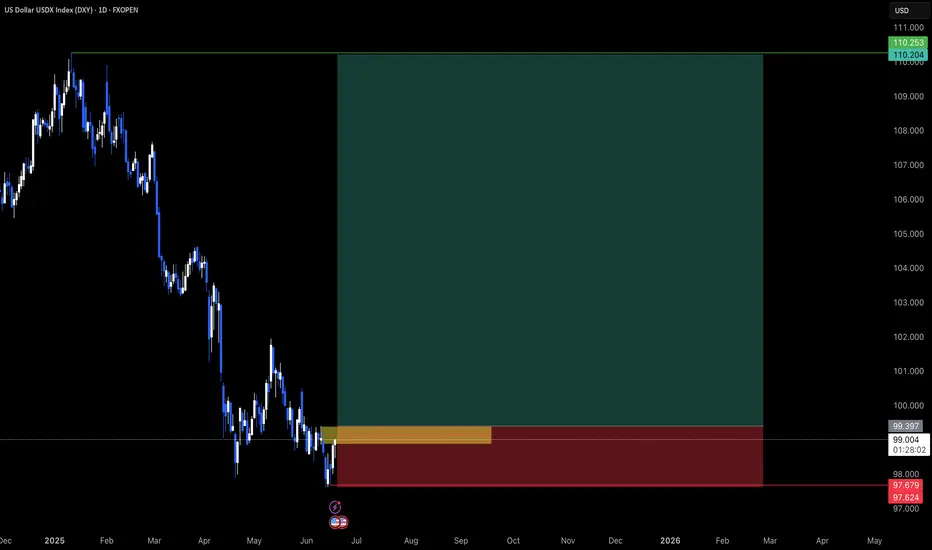
DXY OUTLOOK - SWING SETUPThe dollar has been on a six-month decline, but I anticipate a recovery. This is primarily due to the current economic climate, geopolitical landscape, and the dollar's traditional role as a safe-haven currency during periods of significant uncertainty
"May fortune attend thee, and thy trade prosper." .......L2Earned
AUDCAD - OUTLOOKMy current view on AUDCAD. expecting CAD continue to strengthen in the coming weeks, and in-turn, expecting weak AUD in AUDCAD.
"May fortune attend thee, and thy trade prosper." .......L2Earned

Dollar - Coming back into Consolidation (Short Term Bullish)Been following dollar with videos for over a month and we have been in sync from the highs highlited in the video. We hit our target last week and now looking for a short term bullish run on stops at 94.40s
Give us a follow. Support the channel. Videos are regular
