SHORT ON EUR/USDEUR/USD has just swept a previous high and has plenty of liquidity to the downside to capture.
I will be selling EU to the next swing low looking to catch 80-100 pips.
Dollar

Gold Looks Bullish. But need more confirmation! Looking for more supporting signs that gold is ready to go bullish. I think it will pull back first. But waiting to see where price is at inside of the killzone before making any decision on direction. Being that it is Monday price could end up acting flaky on action. So keeping expectations low.

1. "What do you think — is DXY ready to fly or fall?"DXY 4H Analysis – Decision Time for the Dollar?
After completing a falling wedge with a clean 5-wave Elliott structure, the U.S. Dollar Index is approaching a key demand zone.
Will buyers step in to push price toward the bullish target near 106 📈?
Or will we see another rejection from the supply zone and a deeper drop to 94? 📉
Wave A or Wave B?
Market structure shows signs of reversal, but confirmation is still pending a break of resistance or further rejection.
👉 What do you think — bounce or breakdown?
Comment your view below ⬇️
Let’s see who’s riding the next big wave 🌊
#DXY #USD #ElliottWave #SupplyAndDemand #GreenFireForex #ForexAnalysis #WaveTheory

DXY 4H Breakout? Bulls Eye Momentum Shift!Hey There;
The U.S. Dollar Index (DXY) appears to have reached a critical turning point from a technical analysis perspective. According to Elliott Wave Theory, following a five-wave downtrend, the AB corrective wave has been completed, and a bullish movement towards the C wave is emerging. This scenario could signal a transition from a bearish market to a bullish one.
Technical Outlook:
- A move towards 104.460 on the DXY may indicate that the market is entering a strong recovery phase.
- The completion of the AB corrective wave suggests that buyers are stepping in, driving upward momentum in price action.
- The C wave typically retraces a portion of the prior decline, creating potential for a higher price level.
Macroeconomic Factors:
- U.S. monetary policy and inflation data remain key determinants of the dollar index’s trajectory.
- Increased global risk appetite may bolster the dollar’s appeal as a safe-haven asset.
- U.S. Treasury yields could provide additional support for DXY’s upward movement.
If DXY successfully reaches 104.460, this could confirm a shift into a bullish trend. However, the strength and sustainability of the C wave will depend on supportive volume and momentum indicators. The interplay between technical and fundamental factors could drive a solid recovery in the dollar index.
Should this scenario unfold, it may mark the beginning of a renewed period of dollar strength against global currencies. However, market dynamics and macroeconomic developments must be monitored closely to validate this outlook.
Guys, every single like from you is my biggest source of motivation when it comes to sharing my analysis.
A huge thank you to everyone who supports me with their likes!

EURUSD: Detailed Support & Resistance Analysis For Next Week
Here is my latest structure analysis
and important supports and resistances for EURUSD
for next week.
Consider these structures for pullback/breakout trading.
❤️Please, support my work with like, thank you!❤️
I am part of Trade Nation's Influencer program and receive a monthly fee for using their TradingView charts in my analysis.

LONG ON USD/JPYUJ has given a choc (change or character) at a major demand zone.
JPY index structure is currently bearish.
I will buying UJ to the next swing high looking to catch 100-200 pips

EUR/USD Drifts Lower as Dollar ReboundsEUR/USD is struggling to hold onto Thursday’s rebound from the 1.1200 region—its lowest in nearly 10 days—and trades with a slight bearish bias in Friday’s Asian session. The pair is hovering near the mid-1.1300s, down around 0.15% on the day.
The US Dollar regained some ground due to renewed safe-haven demand after a federal appeals court reinstated former President Trump’s broad trade tariffs, injecting fresh uncertainty into the markets. However, the dollar’s momentum remains limited by concerns over the US fiscal outlook and expectations of Fed rate cuts in 2025.
The euro finds partial support as Trump postponed tariffs on EU imports. Market focus now shifts to the upcoming US PCE inflation data, which may influence Fed policy expectations, followed by next Thursday’s ECB meeting for further direction.
Resistance is seen at 1.1400, with higher levels at 1.1460 and 1.1500. Support is located at 1.1300, followed by 1.1260 and 1.1210.

SHORT ON EUR/USDEUR/USD has pulled back to a major supply zone that previously formed a DOUBLE TOP in that area in the past. (This is technically the re-test)
I have placed a sell limit order in the supply area and I will be expecting EUR/USD to fall past the swing low for over 100 -150 pips.

Gold Still bearish for the momentLooking for gold to fill in a Bullish gap before I consider longs. price is pretty bearish this week and im thinking it due to the contract roll and month end close. Looking for price to find some area of support before considering going Long. As always we wait for the Killzones.

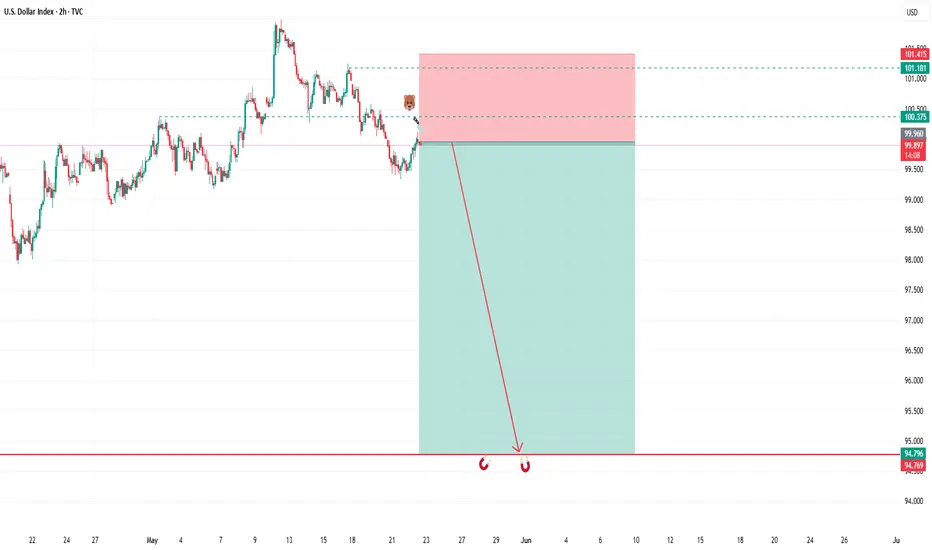
SELL DXYThis week the USD has been retracing, most traders are going long but we know how this goes. Based of our strategy and approach we are still very much bearish on the USD. Our positions for shorts are at 99.916 and adding more shorts at 100.500. Our targets remain at 94.760. If you are catching this set up now then your stops should be above 1011.300. Use proper risk management and risk what you can afford to loose. Best of luck folks.

Gold is going to have a slow fall to set up for a bullish playLooking for the bearish pressure to continue. Price looks like it is ultimately setting up for a bullish play. We just need to see it hit a area of support first before that bullish play happens.

NASDAQ: More Bullish MovementsHuge drop on the left side which happens to reset the trend. Maybe NAS could continue to rally from this point forward

Gold looks like it wants to go higher. We might need to wait. Waiting for more confirmation on what direction price wants to go in. Now that we are past the holiday more volatility should come back. Just waiting for it to confirm a direction first before getting active.

US Dollar Index - Classic Bearish PatternUS Dollar index has successfully broken down from the previous support which held strongly in the past, after support broke we saw successful retest of the support as the new resistance and got rejected from the resistance, now its heading towards the next support
Follow Our TradingView Account for More Technical Analysis Updates, | Like, Share and Comment Your thoughts.
Cheers
GreenCrypto

Does Gold want to continue Bullish to close out the Month?Looking for more bullish plays but Im thinking we need to allow Monday to play out and wait for the better move on Tues. Be cautious today.

EURUSD: Support & Resistance Analysis For Next Week 🇪🇺🇺🇸
Here is my latest structure analysis
and important supports & resistances for EURUSD for next week.
Consider these structures for pullback/breakout trading.
❤️Please, support my work with like, thank you!❤️
I am part of Trade Nation's Influencer program and receive a monthly fee for using their TradingView charts in my analysis.

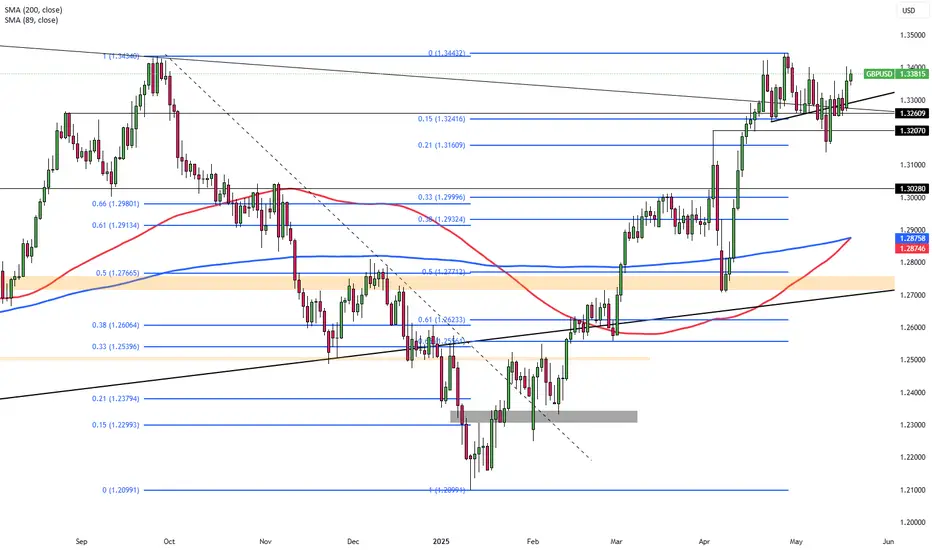
GBP/USD Firms as UK Data Performs WellGBP/USD edged up by 0.25% in Friday’s Asian session, nearing 1.3450, after upbeat UK retail sales and consumer confidence data lifted sentiment. The GfK index rose to -20 in May, beating forecasts, while April retail sales surprised to the upside.
However, PMI data showed divergence as manufacturing fell to 45.1 (vs. 46.0 expected), while services ticked up to 50.2 from 49.0.
The pound also benefited from a weaker U.S. dollar as Treasury yields retreated from 19-month highs. Trump’s budget bill, which includes tax breaks on tips and U.S.-made car loans, passed narrowly and is projected to add $3.8 billion to the deficit.
Resistance is at 1.3470, followed by 1.3550 and 1.3700. Key support lies at 1.3250, then 1.3150 and 1.3000.

SELL THE US DOLLARThis is a continuation of our previous analysis on DXY. As we had mentioned USD DOLLAR will drop all the way to 94.800 before we consider any bullish market movement. In the next session we will be monitoring DXY for selling positions (this means buying EURUSD, GBPUSD and GOLD). Keep your risk manageable and use proper risk management. Cheers to you all.
Gold Stalled for a day! Can we get some more action now?Looking for price to start moving again today since we have some news coming up. It totally stalled out yesterday and consolidated in a range. we just need it to break outside of that range now.

GBPUSD: Bearish Order FlowSpread out across multiple days, GBPUSD has been ranging now. Maybe it's time GBPUSD reached the peak of this distribution with this Shark Pattern. Let's see how it plays out.

Gold is Giving up Set ups this week! Lets get it!Nice run up yesterday. Looking for it to continue. Want to see a nice pull back to give us entry for it to continue. Its a waiting game to wait for the killzones for best entries!

Pound Climbs Above $1.336 on Strong UK DataThe British pound rallied past $1.336, reaching a one-week high and inching closer to its April peak of $1.34. The move was fueled by renewed optimism after the UK and EU reached a comprehensive post-Brexit agreement covering energy cooperation, defense partnerships, and fisheries rights through 2038.
Supporting the pound further, recent UK data exceeded expectations. GDP rose 0.7% in Q1 and 1.3% annually, easing pressure on the Bank of England to cut interest rates aggressively. Although rate reductions remain on the table, the strength of the economic rebound gives policymakers more flexibility.
Despite some concerns about rising unemployment and slowing wage growth, the upbeat GDP print has helped offset fears of an impending recession. Meanwhile, the US dollar continued to weaken following Moody’s credit downgrade, providing additional support to the pound.
GBP/USD now faces resistance at 1.3450, with higher targets at 1.3550 and 1.3700. Support is located at 1.3160, followed by 1.3000 and 1.2960.
Market Closed, Breaking Down Gold Outlook...While the market is closed you take the time to clear you thoughts and reset, preparing for a new week. making notes on what I'm thinking we can expect from Gold the coming week. I'm thinking they want to move bullish but I need to see how they want to play it Monday. Monday needs to break levels and hold above those levels to give more confidence hat they want to push bullish. We should find a entry after seeing that.
