USDCHF Potential UpsidesHey Traders, in today's trading session we are monitoring USDCHF for a buying opportunity around 0.82700 zone, USDCHF is trading in an uptrend and currently is in a correction phase in which it is approaching the trend at 0.82700 support and resistance area.
Trade safe, Joe.
Dollar

EUR/USD Inverse DXY PatternEUSR/USD forming a carbon copy inverse of the DXY on daily timeframe (stands to reason). Will we see the other half play out? Bulls still seem in control, but such meteoric rise surely comes with some correction to the downside as the dollar strengthens?

GOLD setting up for a bigger Bullish PlayBeen waiting for price to get down close to this FVG. Now it looks like it setting up for the bigger play. The key is to wait for the killzone.

IMP update for all Forex Traders Expect the Dollar Index (DXY) to appreciate in the near future. However, a further decline into the green highlighted region is possible before this upward movement. The green zone represents a potential key reversal area. Monitor the following currency pairs for trading opportunities if the DXY begins to climb:
BUY - USDCAD, USDCHF, USDSGD;
SELL - EURUSD, GBPUSD

Gold Spot (XAU/USD) Bullish Setup: Buy Zone to Target Levels Gold Spot (XAU/USD) on the 1-hour timeframe. Key points:
Support Zone: Strong support is identified in the yellow zone around 3,290–3,293, where price has bounced multiple times.
Buy Zone: Market is currently in a potential buy zone just above support, signaling a possible long entry.
Targets:
1st target: Around 3,368
2nd target: Around 3,419
All-Time High: Marked as a potential long-term resistance above 3,500.
Outlook: If price respects the support and buy zone, the market may rally toward the 1st and 2nd targets. Watch for bullish confirmation before entering.

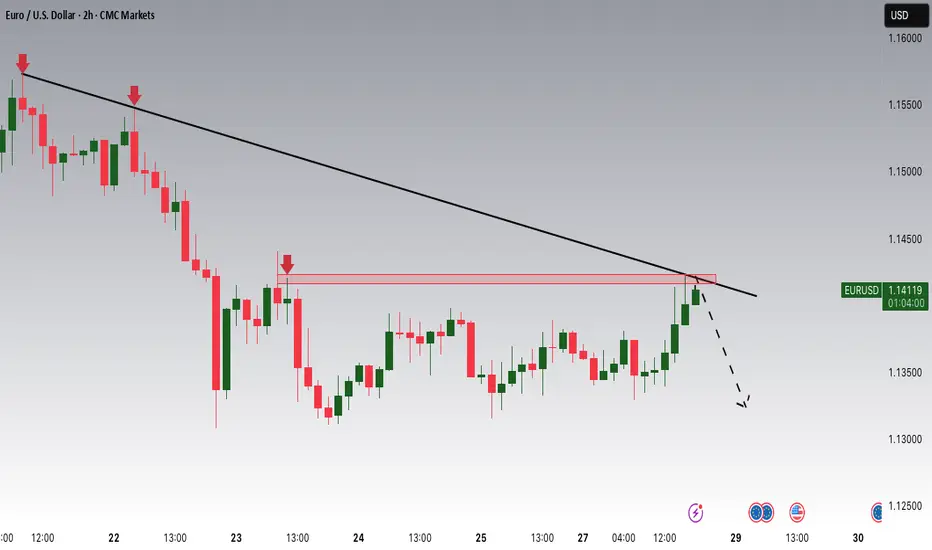
EURUSD is Switching to a Bearish Trend!Hey Traders, in today's trading session we are monitoring EURUSD for a selling opportunity around 1.14200 zone, EURUSD is trading in a downtrend and currently is in a correction phase in which it is approaching the trend at 1.14200 support and resistance area.
Trade safe, Joe.
The Monthly Transition for GoldLooking for price to retrace and take out lows before it proceeds to be bullish. Waiting for Killzones.

GBPUSD SELL NOW BUY LATER!Our previous idea played out perfectly once again! Currently, GBPUSD is showing signs of a pullback within a mini bearish trend. However, I still believe the overall structure remains bullish. I'll be watching for buying opportunities once this pullback completes. Stay patient and wait for confirmation!

Heading into pullback resistance?US Dollar Index (DXY) is rising towards the pivot which is a pullback resistance and could reverse to the 1st support which acts as a pullback support.
Pivot: 100.27
1st Support: 98.32
1st Resistance: 101.77
Risk Warning:
Trading Forex and CFDs carries a high level of risk to your capital and you should only trade with money you can afford to lose. Trading Forex and CFDs may not be suitable for all investors, so please ensure that you fully understand the risks involved and seek independent advice if necessary.
Disclaimer:
The above opinions given constitute general market commentary, and do not constitute the opinion or advice of IC Markets or any form of personal or investment advice.
Any opinions, news, research, analyses, prices, other information, or links to third-party sites contained on this website are provided on an "as-is" basis, are intended only to be informative, is not an advice nor a recommendation, nor research, or a record of our trading prices, or an offer of, or solicitation for a transaction in any financial instrument and thus should not be treated as such. The information provided does not involve any specific investment objectives, financial situation and needs of any specific person who may receive it. Please be aware, that past performance is not a reliable indicator of future performance and/or results. Past Performance or Forward-looking scenarios based upon the reasonable beliefs of the third-party provider are not a guarantee of future performance. Actual results may differ materially from those anticipated in forward-looking or past performance statements. IC Markets makes no representation or warranty and assumes no liability as to the accuracy or completeness of the information provided, nor any loss arising from any investment based on a recommendation, forecast or any information supplied by any third-party.

Price Action + Fundamentals Point to Dollar StrengthThe current market environment presents compelling evidence for a bullish move in the US Dollar Index (DXY). While some patience is required, the setup is increasingly favorable for the dollar to appreciate in the coming weeks and months.
Key Factors Supporting a Bullish Move:
Monthly Close Above 100.160:
A critical technical level to monitor is the monthly close above 100.160. If achieved, it would signal a strong bullish breakout, setting the stage for a continuation higher. Given current price action and market dynamics, this scenario looks highly probable. However, if the price fails to close above 100.160 and instead breaks below it, we could potentially start looking for short opportunities.
Bond Market Strength (30Y, 10Y, 5Y):
This past week, we witnessed notable strength across the US bond market. Yields declined as prices rose, typically a positive signal for the dollar as it reflects capital inflows into US assets.
COT Report Insights:
The Commitment of Traders (COT) report reveals a critical shift: commercial traders, often considered the "smart money," are beginning to accumulate long positions in the dollar. This change in positioning historically precedes significant bullish moves.
Seasonal Patterns:
Seasonality also favors the dollar during this period. Historically, the dollar tends to strengthen in the mid-year months, aligning perfectly with the current technical and fundamental landscape.
Targets:
Initial Target: 106.120
Given the accumulation signs and supportive macro backdrop, a move towards 106.120 seems very realistic.

Is this the start of a massive dollar rally? Learn how .Price action (falling wedge breakout)
Institutional concept (BOS – Break of Structure, 78.6% Fibonacci retracement entry zone)
Liquidity zones (4H LQ and key levels marked in green)
Higher targets (institutional supply zones highlighted in cream boxes around 104-107)

DXY Dxy has some more upside, let the market go above 100 and then we will see the reaction.
Disclosure: We are part of Trade Nation's Influencer program and receive a monthly fee for using their TradingView charts in our analysis.

EURUSD: Detailed Support & Resistance Analysis 🇪🇺🇺🇸
Here is my latest support and resistance analysis for EURUSD
for next week.
Consider these structures for pullback/breakout trading.
❤️Please, support my work with like, thank you!❤️
I am part of Trade Nation's Influencer program and receive a monthly fee for using their TradingView charts in my analysis.

Gold will continue to break out!Looking for the bullish price action to continue as we get ready to close the week and next week close the month. Watching for support as we move into the killzones. Excess has been created on the DOM and it should continue from here.

Now that we Have our Pullback...Back to BULLISHNESSBeen waiting on this pull back. Now that we got it price should move more reasonably. Looking for the bullish action to continue and new highs to be made.

DXY BEARISH BIAS|SHORT|
✅DXY is trading in a downtrend
And the index is making a local
Bullish correction so after the
Resistance is hit around 100.500
We will be expecting a local
Bearish correction
SHORT🔥
✅Like and subscribe to never miss a new idea!✅
Disclosure: I am part of Trade Nation's Influencer program and receive a monthly fee for using their TradingView charts in my analysis.

$DXY bullish from 96-98, massive bull flagDespite everyone calling for the death of the dollar, I think the dollar is in the process of bottoming and then will head higher.
Macron called for the Euro to replace the dollar (which is laughable) and likely marks a bottom.
Either we bounce here, or I could see the possibility of one more spike low down to the ~96 support level, but should we see a reaction there, it sets up a massive move higher in the dollar.
As you can see on the chart, we've been correcting inside of a bull flag, if we can form a low around $96-98, we will reverse and head higher to break the flag to the upside. Upside targets on the chart.
I think the bull market in the dollar is just starting, don't let the news scare you out of accumulating dollars over other fiat currencies.

US30Anyone Bearish or Bullish, say something
I willl be aggressively Bullish if US30 breaks the 40000.00 key level and get a clear retest, supporting it to go higher, to 42020.00 key level.
>US30 failed to break 37864.46 key level to continue selling, now 37864.46 is supporting US30 to go higher.
>US30 is supported by the trend line.
But if US30 fails to break the 40000.00 key level. I will be going with the market structure, as US30 is been selling. But will be aggressive selling if US30 trade below 37864.46 key level
Update will be given

xauusd what is happening?Gold (XAU/USD) Market Overview – April 22, 2025
🧨 Geopolitical & Trade Tensions
Ongoing US-China trade disputes and President Trump’s tariff policies continue to amplify uncertainty.
Market chatter on platforms like X (formerly Twitter) reflects investor anxiety over potential global trade disruptions, increasing gold’s appeal as a safe-haven asset.
💵 US Dollar Dynamics
The US dollar remains weak, partly due to Trump’s continued criticism of Fed Chair Jerome Powell and his calls for rate cuts.
A weaker dollar supports gold by making it more attractive to international investors.
🏦 Institutional & Central Bank Demand
Strong ETF inflows: Over 23 tonnes added in a single session, suggesting large-scale accumulation.
Central banks, particularly China, continue adding gold to reserves—contributing to bullish long-term sentiment.
🧯 Macro Environment
Persistent inflation concerns and dovish central bank policies are reinforcing gold's status as an inflation hedge.
Markets await US retail sales data and Fed Chair Powell’s speech, which could introduce volatility or direction.
📊 Technical Analysis of XAU/USD @ $3,424
📈 Trend & Chart Structure
Gold is trading in a well-defined ascending channel, with a recent breakout above $3,400 confirming bullish structure.
However, the presence of a rising wedge pattern and overbought conditions warns of a potential short-term correction.
🔐 Key Support & Resistance Levels
Type
Level
Notes
Support 1
$3,400
Psychological level & prior breakout point
Support 2
$3,320–$3,325
Fibonacci zone and fair value gap
Support 3
$3,296–$3,284
April 18 low; deeper support
Resistance 1
$3,445
Immediate resistance
Resistance 2
$3,500
All-time high; psychological milestone
Long-term
$3,550–$3,637
Medium-term upside targets
📟 Indicators & Volume Analysis
RSI: >70 on short-term charts → Overbought, suggesting risk of pullback.
MACD: Bullish crossover intact, but declining momentum is a caution flag.
Moving Averages:
Price is well above the 30-EMA ($3,265) and 200-EMA ($3,163) — strongly bullish.
Volume: Recent rally on declining volume = possible divergence, implying weakening buying strength.
📌 Trading Scenarios
✅ Bullish Case
If XAU/USD holds above $3,400 and breaks $3,445, next targets = $3,500 → $3,550 → $3,600.
Entry: Wait for a pullback to $3,400–$3,405 or bullish confirmation (e.g., bullish engulfing candle, rising volume).
Stop Loss: Below $3,390
Rationale: Strong uptrend + safe-haven flows + USD weakness = sustained bullish bias.
🚫 Bearish Case
If price breaks below $3,400 with momentum, correction toward $3,325 or $3,296 is likely.
Entry: Below $3,400 after confirmation (e.g., high-volume bearish candle)
Stop Loss: Above $3,430
Rationale: Overbought RSI + volume divergence → short-term profit-taking or macro catalyst risk.
📈 Volatility Note
Recent daily swings around 2.25% — use tight stop-losses and risk/reward ≥ 1:2.
📅 Key Events to Watch
US Retail Sales Data
Fed Chair Powell’s Speech
US-China trade news
Dollar index (DXY) movement
📅 Medium-Term Outlook (1–3 Months)
Projected move toward $3,600+ remains valid due to:
Global uncertainty
Persistent inflation
Central bank buying
Key swing support: $3,137
Upside resistance: $3,500 → $3,600
⚠️ Risks & Reversals
Risk Factor
Impact on Gold
US-China Trade Deal
↓ Demand (safe-haven outflows)
Strong US Economic Data
↑ Dollar → ↓ Gold
Hawkish Fed Comments
↓ Gold
Continued Overbought Status
Pullback/Cool-off likely
🎯 Conclusion
Gold (XAU/USD) is in a strong long-term uptrend, currently consolidating near $3,424. While bullish fundamentals support a move toward $3,500–$3,600, technical overbought signals and volume divergence suggest caution in the short term.
#xauusd #gold #usd #tariff #tradingview

SHORT ON NZD/USDNZD/USD Is currently at a major resistance level/zone and has created a double top or equal highs.
Price has started to fall a bit, but I do believe price will rise to take out the equal highs in a "Liquidity hunt"
Overall I am taking a market execution sell on NZD/USD to the next demand level looking to catch over 300+ pips.

Gold Making New Highs! Will it continue?Took a mental break for a second to give price a chance to show more of what it wanted to do. Now that we are in a new week expecting the bullish price action to continue. We are just waiting for the right moment to enter the position.

DXY is Strugglig to GrowHey Traders, in today's trading session we are monitoring DXY for a selling opportunity around 102 zone, DXY is trading in a downtrend and currently is in a correction phase in which it is approaching the trend a 102 support and resistance area.
Trade safe, Joe.

Gold Approaches $3,400 Amid Weakening Dollar ConfidenceGold is rallying on a combination of safe-haven flows and Dollar weakness, approaching the $3,420 resistance. While momentum is elevated—resembling crisis-era extremes—further gains are possible amid continued uncertainty.
If $3,420-$3450 zone holds, aligning with key Fibonacci extensions (drawn from the 2018 lows, 2020 highs, and 2022 lows), and trendline connecting 2016 and 2020 peaks, gold could follow through on its cup and handle breakout pattern toward $3,700 and $4,000.
However, any geopolitical resolution or easing of trade tensions could trigger a sharp reversal, with potential downside levels at $3,000, $2,960, $2,900, and $2,800.
Written by Razan Hilal, CMT
