Dollar Index on its way to 93I've been bearish Dollar for a while now.
I've recognize the Dollar's weakness and was glad to get a confirmation when the Dollar broke below the rising channel.
Today, we get another bearish confirmation signal as the Dollar breaks below the neckline of a Head and Shoulders pattern
Dollar_index

The US dollar can't go up forever.*** THIS IS NOT AN ADVICE, DO YOUR RESEARCH AND TRADE WITH YOUR OWN RESPONSIBILITY***
The US dollar index has been going up but seems to be losing stream and has formed topping patterns as well.
I see a lot of people not looking at it, but often good traders will always keep an eye on all sorts of correlations.


MONTHLY ANALYSIS ON DXY(US DOLLAR INDEX)I believe that the Dollar Index is still bullish on the monthly perspective at the present moment @15/09/2018(UK DATE) but it is losing steam and will look to reverse around the 98 -100 region. This will give traders an opportunity to go long for the time being i'm expecting in the upcoming months. As we reach the levels of resistance i will expect a reversal and price should look to fill more of the market inefficiency to the downside( along the way turning support into resistance).
I will be updating it as price goes along in the upcoming months...

Dollar is testing support as Investors wait for Draghi and CPIThe Dollar Index is back near support after a failed rally that we saw in August.
The support zone includes the bottom of a rising channel, MA line and a structure zone (previously resistance, now potential support)
On Thursday we will have the ECB meeting and the U.S CPI data - Two events that can (and probably will) impact the Dollar.
The bearish scenario shows potential to reach 93
The bullish scenario shows potential to reach back to the top of the channel
What do you think?


DXY-SHORT AT BREAK RULE WAVEAfter falling to X (94.90), rising to XI (95.68), then reversing to the reversal point at 120% (94.60), confirming the bearish trend.
At present, the H4 wave group (1) (2) (3) has the rule of recovery at wave (2), according to symmetry wave theory waiting for adjustment of waiting zone (80-100%: 95.08-95.32). Hit down the Weekly timeframe
The 3 Elliot rule targets are:
- 38.2 fibo: 93.64
- 23.6 fibo: 92.85
- 0 fibo: 91.57
stop loss: at wave (2) 95.74

DXY Future Sep 2018Price was smash down in previous daily candle... indicate a bear attack move mode on..
watch out any bull fight back on coming days.. as in long term bull is still in charge upward.
Let's see...

DXY Dollar Index BULL IN THE SHORTTERM, BEAR IN THE LONGDollar index will make an a small bullish adjustment to the 96.20-96.00 area, to continue later bearish looking for the 90.80-90.00 area.


Short term direction of the Dollar - DownLast week's breakout ended with e daily Pinbar.
It looks like DXY is heading to test 95-96 as potential support now

Dollar index - 95 level critical+Fundamentally US macro data is supportive for $, just as Fed communication.
+Trump comments could not harm the greenback.
+100% Fib level retested after breakout
+50D EMA holds as support
-USD rally seems to get stretched a bit
-Uncertainty around Trump persists -> uncertainty for USD
DXY rebounds off key 95 supportThe dollar index is in a pullback from an uptrend on the daily chart. 95 is key support
Scenario A) 95 holds and price pushes higher toward 96.15
Scenario B) 95 breaks and ends uptrend for larger drop

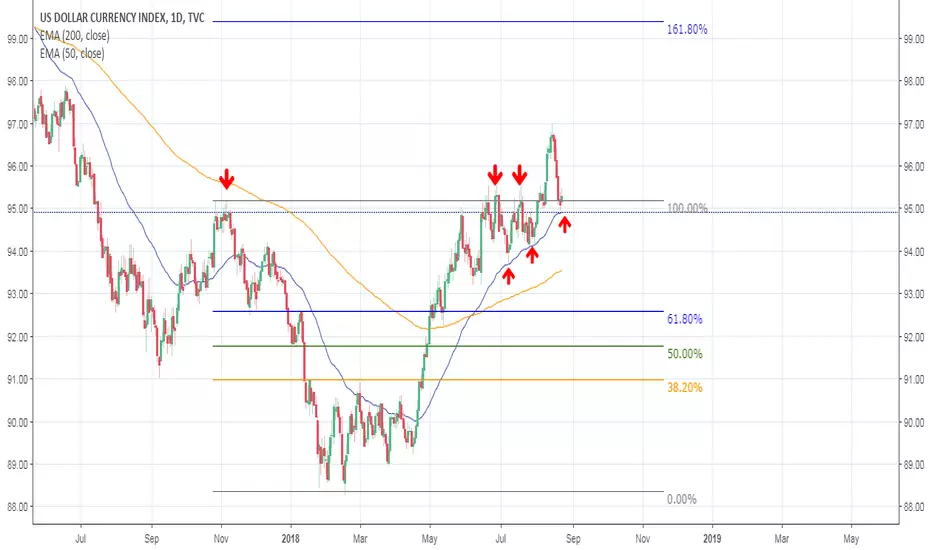
DXY breaks below 21-EMA, eyes 23.6% FibDXY extends declines for the 4th straight session.
U.S. President Donald Trump said he disagreed with the Federal Reserve’s decision to raise interest rates.
Possibility that the Fed might slow down the pace of tightening in response to criticism from the White House weighing on the dollar.
Technical indicators are biased bearish. RSI and Stochs have rolled over from overbought levels.
We see -ve DMI crosover on +ve DMI and MACD is on verge of a bearish crossover on signal line.
Price has taken support at 21-EMA, decisive break below will see further weakness.
Scope then for test of 50-DMA at 94.94 ahead of 38.2% Fib at 93.65.
Support levels - 94.97 (50-DMA), 94.92 (23.6% Fib), 93.65 (38.2% Fib)
Resistance levels - 95.57 (21-EMA), 96.13 (5-DMA)
Stay short on upticks, SL: 95.75, target 95

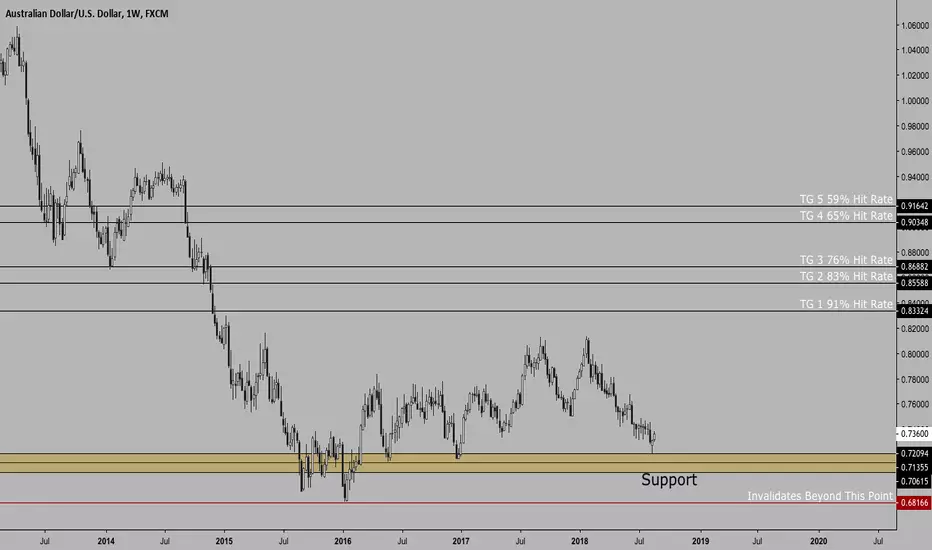
$AUDUSD | Long Term Analysis | Coming Into Major SupportHello Traders,
Long term analysis shows AUDUSD coming into major support. Idea invalidates if new low is made on Weekly time frame. This is not so much a trading idea as it is an overall market perspective. Support zone is defined by my model and supported by structural support.
DXY short opportunity The US dollar index has retraced from 13-month highs at 96.98.
Shooting star formation seen on daily charts and price has dipped below 5-DMA at 96.49.
Intraday charts have turned bearish. Price action has dipped below hourly cloud and we see bearish divergence which adds to downside bias.
Shooting star formation seen on daily charts and price has dipped below 5-DMA at 96.49.
Price is holding support at 1H 100-SMA at 96.42. Break below will see further weakness.
Next immediate support is seen at 96.31 (23.6% Fib) ahead of 1H 200-SMA at 95.84 and then 21-EMA at 95.50.
Good to go short on break below 1H 100-SMA, SL: 97, TP: 95.84/ 95.50

GBP/USD counter trend buy tradeGBP/USD fell into what I call a double zone. First falling into the weekly demand zone and within that a smaller time frame (8 hour chart) demand zone. My entry was at 1.3105 with a stop market order in at 1.2699. I've decided to risk 2% of my account size on this trade and looking to take off 2/3 once it hits 3:1. Dollar has been very strong recently so I may be a bit more aggressive with taking profits. If you like my info guys please give me a thumbs up or follow me. Would love to hear more of your thoughts on my analysis as well. Thanks for viewing guys and gals :)

DXY - Wave 1 of iii of 3 Nearing A TopThe Dollar has clearly started its larger agenda, with wave 1 of a very large degree iii of 3 (Very Bullish) nearing its completion.
On the lower degree level an internal wave iii of v looks to be complete with the iv starting.
A choppy wave iv and v should still be to come for the completion of the wave 1 which leads to the next main move being down in wave 2 into the Fall and possibly out to the end of year.
Overall, the extremely bullish long-term picture has a LOT of upside ahead so keeping a clear awareness of that is recommended.

$USD Breakout/Rally and $BTC.X Breaking Below 6kThe rally in the dollar creates a headwind for #bitcoin as dollars become more valuable against cryptos. In addition, this dollar rally puts pressure on the economy as the financial economics start to tighten. Will continue to monitor prices from here.


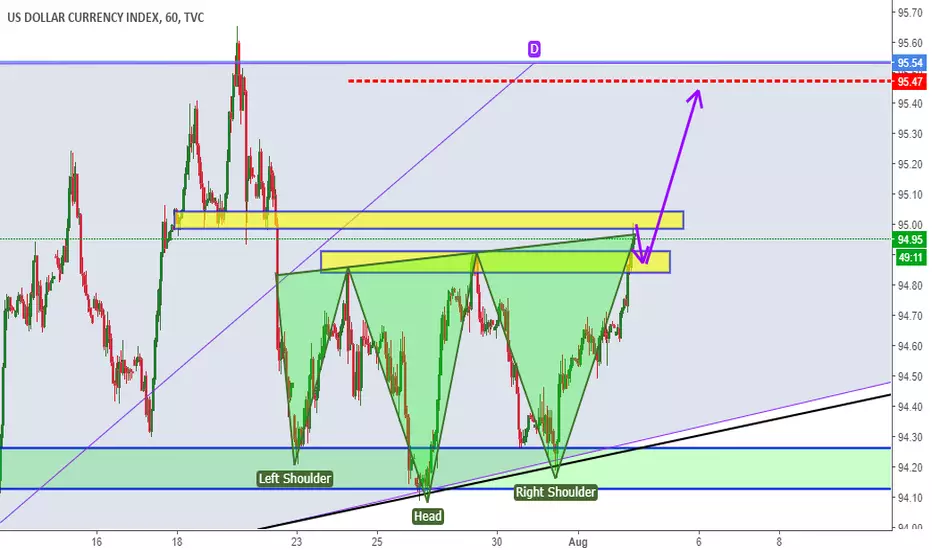
DXY INDEX ANALYSISDXY index broke 98.86-94.91 zone and also the head and shoulders pattern neckline. now we are going to see higher moves for dxy index.
DOLLAR BULLSDollar breaking out of ascending triangle
bullish wave 3 breakout 97.65 second target is 99.28

Part 3 - Risk-off August - DXY DailyDXY – Daily Resistance & Support:
Resistance: 95.00 / 95.50 / 96.00 / 98.00 / 102.00
Support: 93.90 / 92.85 / 92.00 / 91.10 / 90.00
DXY – Summary:
Expected to commence a Bearish Impulse at or around 95.00 or 95.50 Levels
Bullish Impulse expected around 92.00 / 91.00 Levels
