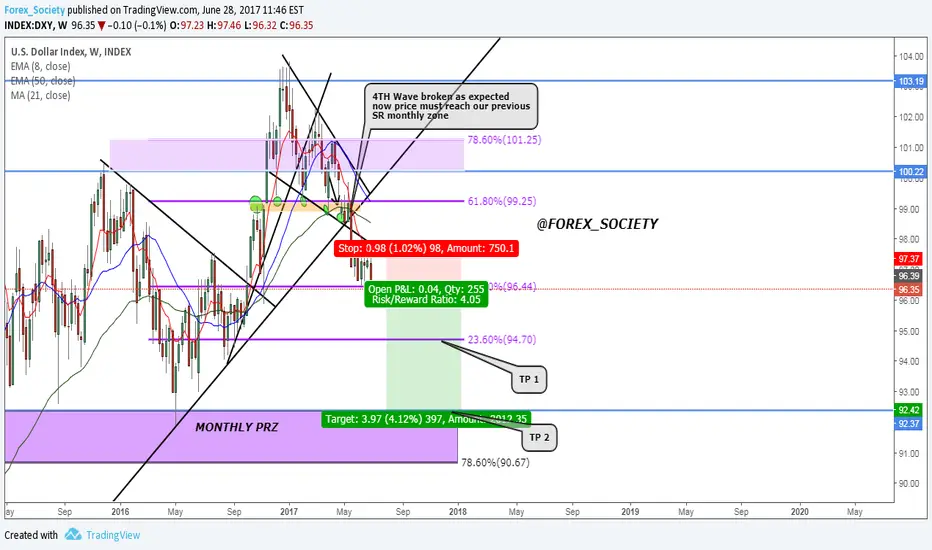
Retreading some old ground? (Simple trend path observation)Looking like DXY might be retreading some old ground, that is to say; DXY path / pattern during the period 1997 - 10.1999 roughly matches it's current path from 12.2014 till today(07.2017).
Were going over some historical data and happen to notice, likely nothing but you never know do you. Well hopefully someone out there finds it useful.
Dollar_index

Dollar Loosing value - The End Of Petrodollar -> SDR/Gold?Don't get hung up on the stock market, the bubbles. commodities are on sale!

USDJPY Divergence Short H4The TVC:DXY has been falling since June 21 from 97.84 to its current 96.00. During this period, the Dollar-Yen pair has continued to rally from its bottom of 108.82 to its previous week close of 113.904.
We are able to view that the pair is currently trading upwards in a channel, and one way which we can profit from this is to go long when prices hit channel lows, and go short at channel highs, though I would personally recommend to go long only since it is currently trending upwards and thus makes no sense to go against the trend.
However, we expect the divergence to be coming to and end, given that there is a significant resistance level at 115.00 and 116.00 on the Daily charts.
We would stay out of the pair at the moment and wait for potential shorting opportunities at the key resistance levels of 115.00 and 115.30.
This analysis can also be found at www.houtiantan.com

Dollar will rise again The ABC correction of dollar unfolded as zigzag as described in the chart.
Next week we hope to see bullish candle that will be my confirmation.

Gold (XAU/USD) - Dollar index down, Stock bubble, Bonds downConsidering the fact that Usbonds, Usdollar index have been tanking for the entire year, FED continues to raise rate hikes in this crazy inflationary environment, Stocks (DJI, S&P500) are in a Tripple Divergence, US debt ceiling is reached "http://usdebtclock.org/"
One must wonder if Gold really could tank to the lower daily trendline of 1180.
I tend to believe not so at the moment.
The chart seems to indicate a rally to a perhaps fall to 1180 but i cannot see this geopolitical environment getting any cooler in the summer, moreover i.imgur.com The Blackrock world gold mining fund have been in a huge decline back to 1200... there is a 2x-3x divergence in the mining sector atm -> oversold.
On the hourly chart
We can observe a triangle forming within the 1,2,3,4,5 wave structure of descending lower bottoms. Volume, Macd, RSI does not indicate another fall but the crash from 1240 did not indicate a fall either (There was manipulation involved in that price being broken previously from the flash crash of 2 billion dollars but if u observe the candle that broke u can also see the same thing at 1240 so there is huge manipulation going on.
I would advice you to have a short term perspective long and observe what gold will do at the end of this decending triangle. If it breaks down --> 1180 next test, if not then we get a small rally up and depending on other factors perhaps things will get rolling again for the precious metalls.
Take care & Trade safe

DXY ... WOW!! A major reversal is coming to the dollar It will affect all these pairs - NU/USD EUR/USD GBP/USD USD/JPY AU/USD
The economy in the USA is doing great. lowest unemployment numbers in 17 years. Fed is slowly increasing rates. Even if inflation isnt moving up yet, Fed is still raising rates to have some ammunition for the next recession. Keep in mind inflation is a lagging indicator, by the time you start getting it whipping through the economy, its to late. Also, the first thing to show inflation isnt durable goods etc, its Assets. Large Assets in the US are inflating, houses are increasing in value at a strong pace.
The market has been bearish on the dollar for a long time dating back to march of 2017, even as far back as November of 2016. Market is bearish, fundamentals are strong. It doesnt add up. So it seems the pressure is building for the dollar to be bullish. Now throw in the technical analysis with a very nice bullish Bat on the WEEKLY chart with an RSI at 33. We are not there yet but we are getting very very close to a turn around in the dollar.

Dollar Flag ? On this chart we can see nice TVC:DXY flag. Potential move upside through the resistance line is very possible. Keep watching it.
Good luck

EURUSD Trade IdeaCypher Harmonic pattern seems to indicate lower price for the EURUSD. Look for 1.093 in the days ahead. TSI bearish cross supports the idea. The DXY US Dollar is strengthening and should run.

Back inside a weekly support zone following trend line rejectionIn this week's newsletter I mentioned that in order to continue higher towards my final target zone (99$) DXY will have to over come a daily resistance zone that included a structure and a broken trend line near 97.5$
That zone played major role so far this week and today it has sent DXY back to the weekly harmonic support zone shown in the chart.
GDP now in focus.
Strong numbers will push DXY back up
Weak number will break that support
Basically as long as the harmonic support zone holds, I think that we are now in a potential Buy Zone but no doubt today's price action is a warning signal for the Dollar.
Don't forget to read next week's newsletter - Don't miss the next setup
#WeeklyMarketsAnalysis on Twitter

Dollar Index Potential Moves Keep an eye of on dollar index. we either going to get a bounce or a break so look out for price action around this area

Focus on MA line (resistance) and trading channel (support)EURUSD is stalling between 1.11 and 1.13 following a down trend line breakout.
For about a month now EURUSD has been consolidating and it can end this week with speeches from Draghi, Yellen and the U.S GDP number (impact on the Dollar and therefore EURUSD).
1.12 is the nearest resistance zone - The Fast MA line is the technical element to focus on
From below we have the bottom of a trading channel (pink) as potential support.
A breakdown of the trading channel will probably lead EURUSD towards 1.11 and maybe even towards 1.1
A breakout above 1.12 will trigger a bullish move that can end with a re-test of the weekly resistance zone 1.14-1.15
Read more about EURUSD, DXY, GLD and SPX in this week's newsletter
#WeeklyMarketsAnalysis on Twitter

EURUSD should test 1350 any moment.If 1350 is broken 1520 will be the next station. Going steady this time.
Depending on the news coming out of Syria until the end of July, 17 will be tested after 2.5 years.
Or else 0815 is strong support.

DXY: Two Buy Setups DXY has been forming an inverse head and shoulders, with nice price action during the rate hike event. Watch for a break of the neckline for a favorable trade setup.


US DOLLAR INDEX: Buy setup on reversal channelHere we have dollar index chart and we are having a reversal channel formation to upside.
Look for breakout and if price does not breakout this time then look for the bottom to buy.
When dollar index moves, it means that dollar pairs will move with it as well (correlation). So you should look for sell on pairs such as NZDUSD, AUDUSD, EURUSD....

Hammer on #USD INDEX #DXYPossible Hammer building and a bounce of 61.8 fib. A close above 97.52 would be short term bullish. Watch #EURUSD a close below 1.1180 = dollar bullish

People buy USD as Comey tension eases and focus shifts to FOMCThe Harmonic Support Zone I mentioned in this week's newsletter.
Comey's tension eases, the GBPUSD is crashing down following the UK elections (1.3 was also a resistance zone I mentioned in this week's newsletter) and Investors are starting to buy again with expectations for another rate hike next week.
DXY is up and back above 97$
The final target zone of this potential bullish scenario is the 200 days MA line and the re-test of the broken trend line.
More updates in next week's newsletter

Potential Buy Zone for Gold GLD fell last week as Dollar rallied towards FOMC.
The turn came after the completion of a bearish Gartley pattern.
Now GLD is approaching a potential Buy Zone that includes:
Weekly MA lines
Daily MA lines
Broken trend line
Structure
Risk and Potential Reward are shown
If the Fed won't raise rates, GLD can be an interesting buy.
Read more about GLD, DXY, Bitcoin and more of my weekly forecast in the #WeeklyMarketsAnalysis (search on Twitter)


Dollar Index RIPDollar Index on the daily time frame looks like it's set for a free fall.
ADX shows a very strong bearish trend and Stoch Rsi still shows strong selling pressure. When you look at the price levels its just broken through a resistance and it seems to keep trading in the fresh downwards channel.
With this in mind, stay sharp on possible sell setups on the dollar pairs. Also look to buy JPY.


Rising channel leads Bitcoin into resistance The rising channel you see in the chart is leading BTCUSD into a daily resistance zone that includes a bearish harmonic pattern and a Fib confluence zone.
Stop loss above the psychological level, 2000 (with some buffer), should be enough if you want to try and trade Bitcoin lower based on this setup
Conservative entries - Below the Fast MA line and the trading channel (trading channel breakdown)
