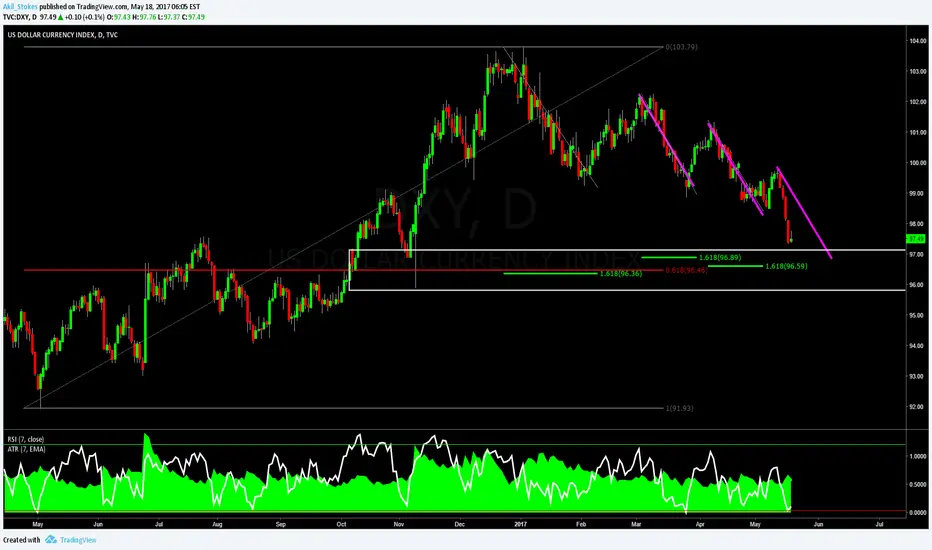
Break out to the downside in the Dollar IndexThe US Dollar Index has resolved its recent daily wedge to the downside. The break out below 98.35 is a clear signal for selling. A recent is at 95.025 level
Dollar_index

DXY: Just Some Random Analysis In my opinion, finding a good trading opportunity is like a detective gathers clues and seeing what they all add up to. There are lots of tools that we can use in our technical analysis, but in my opinion no single one is great. Rather it's the combination of those tools & tactics that allow us to dial down on the best areas in the markets.
USD index long?An old trendline plus the weekly 100SMA could make an interesting point to buy now, if fundamentals come with it. Good luck everyone!

Who killed Dollar Index despite stronger Sentiments and draggingdespite showing you fundamental analysis which also favoring downside in Dollar Index and upside in gold.I have marked the Killer of USD index in technical because we understand pattern but not the soul fundamental behind that pattern.
So guys no worry FOMC hike rate or not the DXY going nowhere but only downside.
Wish you best of luck trade safe and be safe.
Kinds and Regards,
Dipak Z

USD index DXY bearishUSD index price crossed below neck line of head and shoulders that gives us 2 scenarios:
1- Stall into target that is the price range between head and neck line
2- Get stuck in an ascending wedge (between neck line and trend line) until it retests all levels and then break down

Strong rally from MA line drive Dollar Index to 100DXY experienced an amazing week so far and it is charging the 100$ resistance zone again.
The rally started from the 50 weeks MA line.
Near 100$ DXY will meet the psychological structure zone and the Fast MA line as resistance. Will this zone kill the Dollar's comback?
Still ahead this week - Dragi, Fed members and G7

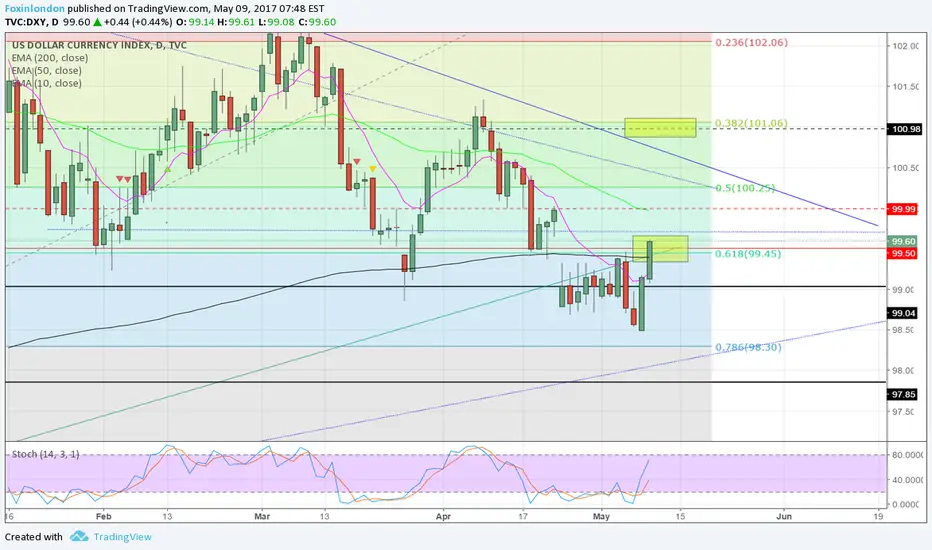
DXY Daily price levelsBullish above 99.5 to 101
Possible reverse at 99.5 and leg lower to 98 and 97.
Bearish below 99

USDJPY - WELCOME BEARS!!USDJPY has finally reached the top of the trend line. we now have consolidation happening. If price comes below the consolidation box 111.900 this will be a great area for shorting. We can expect to see 105 area if this happens. as of now we are currently waiting to see if the trend holds. RSI is making lower highs. Patience is key, so if we see price jump about 40 pips above the consolidation box this will be invalid.


Break of lower trendline, more downside momentum on DXY likelyThe US dollar index is at a turning point. For close to 6 months, this index has been in a converging symmetrical triangle that was playing out on the daily chart. During that time, many tests of both the upper and the lower bounds of the triangle have happened, but there was never an actual breakout. This has now changed.
On Friday, the DXY broke and closed below the lower trendline for the first time. It also broke the 5-month lows and it closed relatively strong to the downside. We need to see what happens next week, but my initial bet is that we might see more downside momentum. This would be in line with multiple setups I have added to my weekly watch list, where I also expect to see the dollar lose some strength. For more potential setups, have a look at my outlook for next week .
Find more analysis on smartforexlearning.com and give us a follow:
- on Twitter: twitter.com
- on Facebook: www.facebook.com
- on Google+: plus.google.com


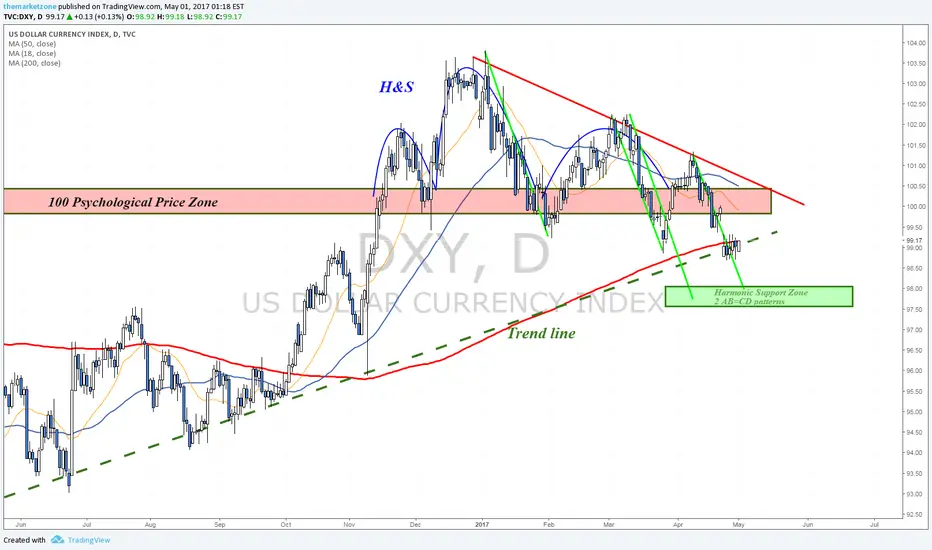
Stuck between 200 days MA line and a daily uptrend lineThe Dollar Index gapped down last week following the French Elections.
The price couldn't close above its 200 days MA line despite multiple attempts.
What stands between DXY and the next support zone (harmonic support zone shown at the chart) is the uptrend line that still holds as support.
Key Price Zone this week - 99$
A close above the 200 days MA line can send DXY back towards 100$ and the downtrend line.
A close below 99$ can send DXY to test the harmonic support zone (2 AB=CD patterns) near 97.5$
Read more about this analysis and other trading scenarios in my weekly newsletter - #WeeklyMarketsAnalysis on Twitter

DX to resume uptrend next weekAlthough I am a long term dollar bear, I think next week we see some upside. Maybe even new highs later this year. Daily divergence at a major support is what interests me in a long

Dollar Index Preparing Next BreakdownThe past days the Dollar Index has been touching the lower range, it lackek bullish momentum to bounce back up cancelin the 5th wave. ADX shows that the bearish trend is still strong while the Stoch Rsi still indicates strong sell pressure. Because of this we can assume that the Dollar Index will break-out of the lower range next week.
Possible targets 98 and 97. Please note that on allot of Dollar pairs you see setups against the dollar, so this alligns with the bearish setup on the Dollar index.

[DOLLAR INDEX] WEEKLY SUPPORT...who will be the new President of the United States?
Thank you for your support and trade with care!

This is what you need to know before the elections results EURUSD is trading inside a yearly trading range.
There's a daily uptrend line that EURUSD is currently still above.. and from above it has a daily downtrend line and the middle of the range - 1.1 (Resistance Zone).
In case of a bullish move, focus on 1.1.
A breakout above this price zone could send EURUSD towards 1.14-1.115 again to re-test the top of the range
In case of a bearish move, a breakdown of the 1.04 support zone can lead EURUSD towards parity and even lower.
As long as it stays inside the range, you can try and trade the range

Dollar Index Bullish SetupThe dollar index made a nice bounce back up from the lower green range. The Stoch Rsi indicator shows a possible bullish crossover and the Adx indicator shows a very weak bearish trend meaning that its more then likely the bulls will take over.
Because of this I see the dollar gaining some strenght this week and the dollar index attacking and breaking 100. It's most likely that this will be fueled alot by the Usd gaininst most of its strenght against the Cad and Jpy (see my Jpy chart).
If you're less bullish than I am on the Dollar then you should wait till the lower range breaks (around 99.40) and then sell the Usd

DXY ( LONG TERM ) This is what I seeing for the US Dollar.
** This is 100% technical outlook ** Fundamentals are not on my mind when I am marking any chart up, ever. I do not base any trade off any type off news, ever.
Thanks for taking the time to check out my chart~!

DOLLAR INDEX MONTHLY - CORRECTION/REVERSAL SCENARIODollar Index Monthly - Structure speaks for itself. Big moves to the downside expected. This correlates well with global indices and Oil they are also indicating a big correction on larger timeframes technically.

Could the DXY (US Dollar Index) break below 99.30? Possibly!The DXY daily chart is approaching the last leg of a descending triangle pattern which is a bearish signal. Look out for a shorting opportunity if it breaks below 99.30 which has been a pretty solid support level.

Breaks below 100$. This is the next support zoneDXY breaks below 100
In case that it will also close below 100, this is the next support zone (99):
- Trend line support
- Bullish Bat pattern
