DXY Short (March 1, 2017)Today we ran a clean level of stops around 101.70 with a nice reaction and 4H pinbar. There has been some divergence in the recent up move though we could see more bullishness to 102-102.50 levels before turning. There is a liquidity void where orders were not filled around 99.00 which I believe we will need to fill before further upside.
Dollar_index

U.S. Dollar Index Weekly Outlook + BIG Long Move Possible?The US-Dollar Index is in an intact impulsive long trend. After the weekly break of the sideways range a pull back towards the break out level or in other words around 100-100.5 zone was initiated.The possible upside breakout of the 1 ½ - year sideways range also underlines the current situation within the US-Dollar. After the Federal Reserve stopped QE 3 in October 2014 and started to think about rising rates the currency moved in a sideways range of uncertainty about a next potential rate hike. As the FED said that economic data should be waited to recover. For one and a half year the market moved in a range between 92-100. This is also shown in all USD-crosses such as the EUR/USD, that the USD made choppy moves on weekly time frames.
After the market indicated an upside move and a potential fundamental driver of the US election, the market finally broke out of the sideways range and closed above 100 on a weekly basis which confirmed the breakout. After the FED rose rates in December 2016 for another 25 basis points, market reacted with further upside movement. This fundamental driver gave technicals a sustainable kick to the upside. For the near term, fundamental drivers play with the question of the next rate hike by the FED and tax policy by President Trump, which will affect the US-Dollar heavily as well. We definitely keep an eye when evaluating new mid-longterm bullish US-Dollar trades.
However, currently market flirts again with the break out zone and seems to start its bullish move to the upside. BUT for an clear confirmation of a new start of an impulsive move the local highs ofaround 103 should be broken with a weekly close price, then we could easily see next weekly resistance of 107.75-110 with a potential pullback before. 107.75-110 is the price target of the projection from the sideways range. Bullish candle formation in weekly chart confirms that this breakout might not be a fake one. This indication told us that the uptrend might give a little pullback to the downside before continue due to an overbought market. This scenario is currently for some weeks of flirting with the resistance. We currently await for two scenarios for the DXY. Two scenarios:
- Market finds support and initiates further bullish movement and breaks the resistance zone of local highs at 103.8 (break out highs). This would be a continuation move that the next impulsive the long side has been confirmed.
- Market corrects a little further to the downside and holds support around drawn trend line after initiating further bullish momentum
We remain bullish on long-term.
As we look at our intermarket indications we could get confirmed with our statement, as they currently cooling down from capital outflow.
We always mention the importance of intermarket flows, as we believe that investors only repark their money due to sentiment and global macroeconomic conditions. Therefore, we always keep in mind the in-and outflows with the help of our intermarket indications that lead us towards better timing when making a trading decision. As you might know that timing is one of the most important things when it comes to trading.
As seen in the chart, our two of our intermarket indications showing a cool down of capital outflows and currently moving in buying territory which might indicate a soon inflow of capital towards other asset classes. We take into account always the BIG 4: Currencies, Bonds, Stocks and Commodities.
As always, trading is a probability game nobody is 100% and always use a stop-loss when trading. Trade with care.

US10Y Yield Fake Breakout (Feb 27, 2017)This is an update regarding my breakout idea from the weekend. Today the yields failed to push below Friday's low and we got a close back above the trendline. Price is being supported ahead of Trump's speech tomorrow. There's a possibility bulls can push back towards 2.500 this week. I am residing with slightly bullish on the Dollar until further confirmation. This is also starting to play out as a bullish flag.

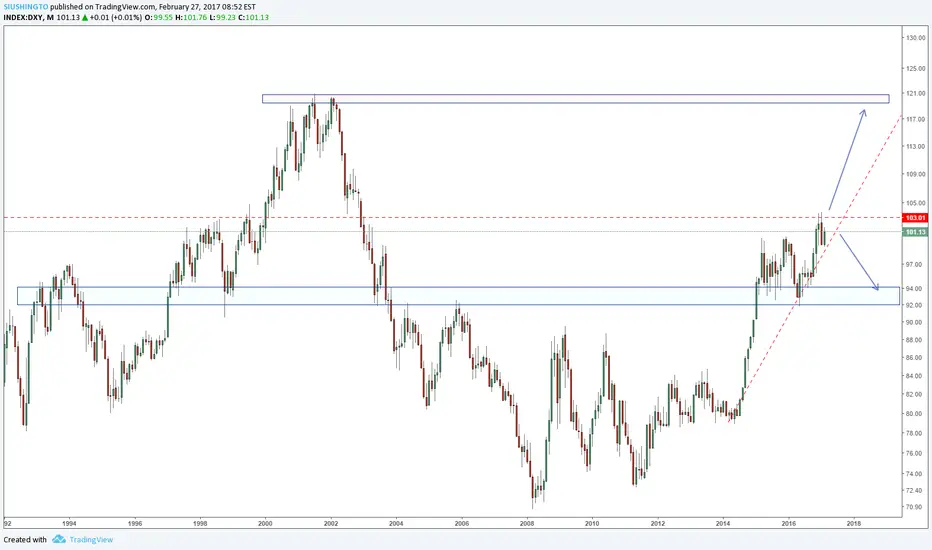
Dollar index trading oppotunity1. If the price breaks the uptrend line, it's very likely to go all the way back to the 94 - 92 area
2. Alternatively, if the market breaks the reisitance 103, it will go all the way up to the 12o area
XAGUSD Silver weekly chartXAGUSD weekly chart
EMA cross is bearish
Silver is in correction wave 4
The correction is wedge pattern and could retest broken trendline at fibo 3 around $10

DXY weekly chartDXY dollar index
weekly chart
EMA cross is bullish, the move up continues
The top vs initial move, could reach a 13/3 fibo ratio as the previous wave c in 2000-2001
In stochastic price normalization it shows pattern of
1)correction 2) trendline break 3) dollar top
If it repeats the top could be for may 2018

Dollar Index Daily AnalysisThe dollar has been waffling around the 99-102 range for most of 2017. Right now there is a nice pivot area below acting as support and a pivot area above acting as resistance with the range being fair value. I can see two possible scenarios playing out.
1) We get a break above 102.00 and retest support to continuation of the uptrend
2) The upward trend line breaks and we have a selloff back toward 99 and possibly lower
With US yields getting crushed I am more favorable to a bearish bias. I am playing all price action setups within the range.

USD Index sell setupafter breaking neckline of head & shoulders pattern we put sell order on DXY as showed on chart.
2 targets : 100.83 / 100.59


dollar index for this weekdollar index for this week
if it's open up 100.96 will go up.
if it's open under 100.41 will go down.

dollar index short pattern94.80 $ is the target for head and shoulders pattern.
if dollar break 99.24 will go down.
pattern fail by break 103.65 to up ...

Gold Breaks Through and Closes Below the 8 Day Moving AverageGold dropped 8.1 points on the day to close below the 8 day moving average. As the dollar rose, gold sold off and finally cracked the 8 day ma. It also closed below the forward adjusted closing price line represented as the cyan line. There is now a high probability that gold will touch the 20 day moving average which is the midpoint of the Bollinger Bands.
The Heikin Ashi chart shows that we are now in red territory, with 2 red candles in a row. If you look back a few days at the last green Heikin Ashi candle, you can see that it is a doji. Doji Heikin Ashi candles signify either a change or continuation of direction. Since that green doji has been followed by 2 red candles, it appears to have signaled a change of direction.
The volume profiles are still showing confluence of the POCs from the intermediate and short terms.
Whether or not we will see a resumption of the C wave and Gold moving higher in the near future is uncertain. For now though, it looks like there is more room to go on the downside.


Short term bullish scenario - Testing weekly supportEURUSD is testing the bottom of a weekly trading range
The price held above the 50 days MA line last Friday and as long as it holds above this line there's a chance it'll bounce towards 1.07, 1.08 or even 1.09!
The final target zone and the potential R/R are shown at the chart.
#Notice - Weekly chart analysis support the opposite way right now (bearish!) so be careful with counter trend trading here. Read more about EURUSD in my weekly newsletter (link in signature below)

NZDUSD Short Zonelooking for Shorts on NU as we are at resistance on 2 major trendlines
Looking for a break for the blue trend line for entry
