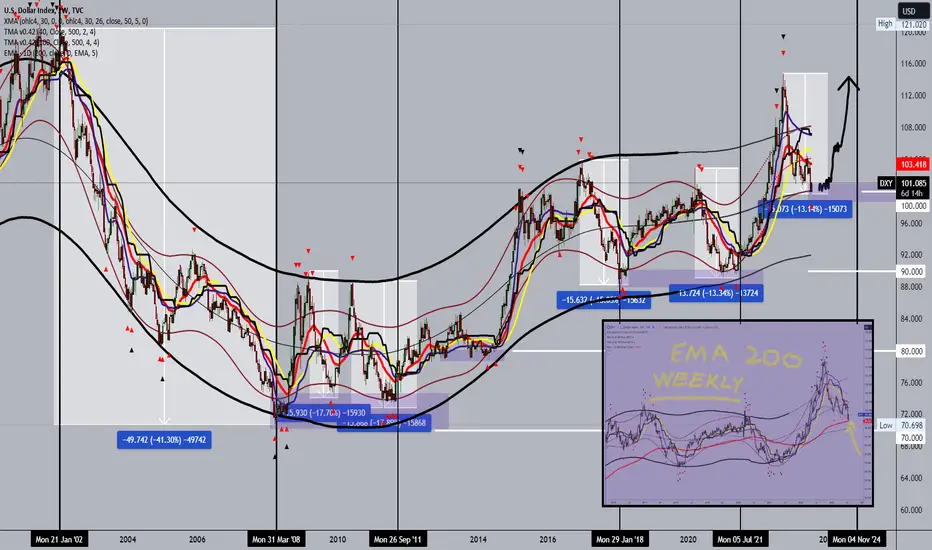
Dollar index long viewThe dollar index: an interesting comparison of previous pullbacks.
In the period from 2003-2008, the dollar index lost 41% of its value. A historical low was formed at the 70,698 level, and the dollar is starting a bullish trend, breaking through the EMA200 daily and forming a higher low.
Since that moment, we have been in a bullish trend and are monitoring each pullback's strength. From 2008 to date, we have seen five pullbacks, with the dollar falling 13%-18% in that period.
Soon, the dollar could find new support and start a longer-term bullish trend.
This week was positive for the dollar index and could trigger a significant increase in the dollar in the coming period.
Dollar_index
Mighty Dollar Soars as Competing Currencies Succumb to InflationGet ready to witness an exhilarating opportunity in the world of currency trading! The global economic landscape is undergoing a seismic shift as major currencies face mounting inflationary pressures. Amidst this chaos, the mighty US dollar emerges as the frontrunner, poised to dominate the market. Brace yourselves for an exciting ride as we delve into the reasons behind the dollar's rise and present a compelling call to action for you to long the dollar!
1. Inflationary Headwinds
2. The Dollar's Unyielding Strength
3. Long the Dollar - A Lucrative Opportunity
Call-to-Action:
Are you ready to ride the wave of the dollar's ascent? Here's your call to action:
1. Educate Yourself: Dive deep into the currency market dynamics, understand the factors influencing the dollar's rise, and equip yourself with the knowledge to make informed trading decisions.
2. Analyze Market Trends: Keep a close eye on economic indicators, central bank policies, and geopolitical developments that impact currency values. Stay ahead of the curve and identify potential entry points for prolonged positions on the dollar.
3. Seek Expert Advice: Consult with experienced forex traders or financial advisors who can provide valuable insights and guidance on maximizing your dollar trading strategy.
4. Execute Your Trades: Utilize reputable trading platforms that offer access to a wide range of currency pairs, allowing you to capitalize on the dollar's rise against weaker currencies.
Conclusion:
Traders, the stage is set for an exhilarating journey into the world of currency trading. As major currencies face higher inflation pressure, the dollar emerges as the undisputed champion, ready to conquer the market. Seize this momentous opportunity, long the dollar, and embark on a path to potential profits. The time to act is now!
Disclaimer: Trading involves risks, and conducting thorough research and seeking professional advice is crucial before making any financial decisions.

DXY analysis This is a long term analysis of DXY showed strong rejection from monthly FVG after a sweep of liquidity and now we are seeing a bullish momentum expecting this to get to a premium zone and a higher dxy for the next 1 or 2 months .

DXY Rangebound Since Dec Don't Miss the Opportunity to Long It's time to dive into the world of currency markets and explore what's been happening with the DXY (US Dollar Index) since December. Despite the buzz surrounding Jerome Powell's Jackson Hole speech, the DXY has been in a range. However, fear not, as this article aims to illuminate this situation and present a compelling case for why now might be the perfect time to long the dollar. So, let's get started!
Understanding the DXY Rangebound Situation:
Since December, the DXY has displayed remarkable rangebound behavior, seemingly unaffected by various market events and economic indicators. This range has left many traders wondering about the potential opportunities. Even Jerome Powell's highly anticipated speech at Jackson Hole failed to break the DXY free from its confines.
The Call-to-Action: Long the Dollar!
While the DXY's rangebound behavior may seem discouraging initially, it's important to remember that within every challenge lies an opportunity. Now is the time to consider going long on the dollar, and here's why:
1. Economic Resilience: The US economy has demonstrated remarkable resilience amidst global uncertainties, thanks to solid consumer spending, robust corporate earnings, and a proactive fiscal stimulus. These factors position the dollar favorably for potential gains shortly.
2. Interest Rate Divergence: The Federal Reserve's commitment to maintaining accommodative monetary policies while other major central banks contemplate tightening provides a unique advantage for the dollar. This divergence in interest rates can attract investors seeking higher yields, further boosting the dollar's strength.
3. Safe-Haven Appeal: In times of uncertainty, the US dollar has historically served as a safe-haven currency. With geopolitical tensions, ongoing trade disputes, and the potential for market volatility, the dollar's safe-haven appeal will likely remain intact, potentially driving its value higher.
4. Technical Indicators: Despite the rangebound behavior, technical indicators suggest that the DXY is nearing essential support levels, indicating a potential upward breakout. This presents an excellent opportunity for traders to capitalize on a likely rally in the dollar.
Conclusion:
As traders, it's essential to stay optimistic and seize opportunities even in challenging market conditions. While the DXY has remained rangebound since December, it's crucial to recognize the potential for a breakout shortly. Considering the abovementioned factors and analyzing technical indicators, going long on the dollar can be rewarding.
So, fellow traders, don't miss the chance to ride the potential dollar rally! Stay informed, closely monitor market developments, and make well-informed trading decisions. Remember, every rangebound situation eventually breaks, and when it does, you'll want to be in a position to benefit.

Dollar Index (DXY): Important Resistance Ahead 💰
Dollar Index is currently testing a solid key daily resistance.
To catch a bearish wave from that, watch a major rising trend line.
Its breakout - daily candle close below will be a strong bearish signal.
A bearish continuation will be expected at least to 103.3 level then.
Alternatively, a bullish breakout of the underlined blue are will push the prices higher.
❤️Please, support my work with like, thank you!❤️

DXY follows as updatedUS Dollar Index same as I updated in my analysis, Rebound from 103.20 to 103.60 around. after that seen pullback. Now it's retesting and looking target again 103.20 and we may see below 103 next coming week.

US Dollar Index (Yearly Chart)- $DXYUS Dollar Index (Yearly Chart)- TVC:DXY
The chart reveals a clear historic time pattern of c.6 years of bear price action followed by 10 to 12 years of bullish price action for the Dollar.
The Chart
o Each bear cycle ends with a double bottom which forms over a 4 to 6 month period. The double bottoms are marked 1 and 2 in blue on the chart.
o If we assume the top is in for 2022, each top has taken 10 – 14 years to reach and need to hit or exceed the upper resistance line.
o Price can oscillate near or above the upper boundary of the resistance line for a period of 3 years. At present we hit this resistance line in 2022 and thus arguably could remain elevated here for a further 1.5 years. Whilst this is a potential outcome, I do not see it as likely for reasons outlined below.
Why I’m Bearish on the dollar:
o We are presently in year 14 of positive price action. Based on historic price action this is an over extended bullish time period thus leading me to believe it is near its end or at its end.
o Price hit the upper resistance line and was definitively rejected from it in 2022.
o The price candle in 2023 is showing a spinning Doji candle which typically means indecision or a turning point (unlike the candle post the “oval area” marked in 2000 which was followed by a large green candle). This could change by the end of the year though and keeping an eye on this would help us confirm if the dollar is into a long term down trend.
o If we open 2024 and the 3 year moving average(Blue Line) has started to turn down I think this would be the nail in the coffin that the dollar has at least 3 years of continued downward price action thereafter.
o As you can see from the last two bearish periods the DXY declined 52% between 1985 – 1992 and then declined 42% between 2002 – 2008. Based on this reductive pattern I have in an continued the pattern projecting a 32% decline for the 2022 – 2028 period of which we have already declined 10% with a potential 22% to go down to $78.25.
Whilst I have included a projection here and in the chart, it is not a prediction. I am just using past price action as a guide and we only have two data windows as reference points so this is more guess than anything. At any stage the chart can either confirm or cancel this perspective. That’s the beauty of charting, we lean on what is more probable based on what the chart has done in the past and what it currently doing, continually challenging and updating our thesis, and letting price (or the market no matter how irrational) be the dictator of our trades.
It’s vital to recognise that we can revisit the top resistance line. It is possible, however the 6 month chart and the weekly chart seem to lean more bearish now and thus on a shorter timeframe I believe we will likely head lower. This can all change though as we are still 1.5 years into the 3 year topping window period. Technically, we could have a recession and the DXY could spike and then still head down and form a its 6 year low after. As more time passes everything will become more clear.
I will be following up this post with Monthly and Weekly charts so that we can monitor price and time action more closely. I have already completed a basic version of these which I will add in the comments below.
PUKA


DXY possible upside moveTVC:DXY
Hey, gettin back after long time but with different strategy I trust more
So DXY, when we look into XAUUSD we see bearish trend so thats this idea of DXY upside move
one thing goin against is last high is not higher then previous
When is entry valid: Fisrt at all I wanna see some 1H low to be formed, low cant go lower than 102.138. If yes trade is invalid.
Then i want to see break of highs at 102.400 with candle close above this price. 1H candle would be best but we can go even with 30min
If everything go well we enter, SL we can set under 1H low or more risky one, under last 15 min low before break of 102.400 zone.
TP is set at last high 102.743. There i would close 80% of positions and if we break that high then we looking for TP2 at 103.482
I will keep u updated about this trade. Have a great week.

Dollar Index (DXY): Important Things to Watch 💵
Here is my top-down analysis for Dollar Index.
Ahead of NFP, the main focus are 2 structures:
intraday support and a daily resistance.
If the price breaks and closes above 102.73 - 102.92 area on a daily,
a bullish movement will be expected to 103.33
Alternatively, a bearish breakout of 102.3 - 102.44 area and
4h candle close below that will be a strong bearish signal.
The index will drop at least to 101.96 then.
Let's see what will happen.
❤️Please, support my work with like, thank you!❤️

DXY DOLLAR INDEXHey, fellow surfers of the financial waves! Mondays can be a wild ride, no doubt, but let's not let them mess with our stoke. The Dollar index is making its move back to the range midpoint, and EURUSD is just catching its breath, chilling out in consolidation mode. But you know what, this is where the magic happens for us at Global Chart Surfers!
We're the masters of our own destiny, catching those scalps like pros, riding the charts like waves, and making those calculated moves with finesse. We know how to navigate these waters, and we won't let Monday's tricks throw us off balance.
So let's keep our cool, stay on top of those setups, and lock in those sweet profits. And hey, tomorrow is a new day, with fresh opportunities waiting to be conquered. Until then, keep the good vibes flowing, and remember, we got this! Peace out, and see you on the charts tomorrow, ready to conquer once again! 🤙🌊

Dollar Index (DXY): Important Key Levels to Watch This Week 💵
Here is my latest structure analysis for Dollar Index.
Resistance 1: 101.70 - 102.05 area
Resistance 2: 103.35 - 103.58 area
Support 1: 100.55 - 100.70 area
Support 2: 99.58 - 99.78 area
Consider these structures for pullback/breakout trading.
❤️Please, support my work with like, thank you!❤️

DXY (Dollar index): 31/07/2023: Possible scenariosHello traders.
As you can see, the price had a bullish reaction after touching the weekly support.
There is a clean FVG above the price that is a high possibility to be filled. Then we can expect another bearish move.
Please pay attention to the details.
feel free to ask questions.
💡Wait for the update!
🗓️31/07/2023
🔎 DYOR
💌It is my honor to share your comments with me💌

dxy after federal Fund ratehi dear trader my road map for dollar curency index ...
One more Fed rate hike at least and a narrowly softer dollar outlook
The forthcoming Federal Open Market Committee meeting may be a relatively subdued gathering, leaving exciting loose ends for September. Meanwhile, the dollar could trade around current ranges with a modest softening bias over the rest of the year.
July FOMC meeting
The FOMC meets on 25-26 July and a 25-basis point hike in the Fed Funds rate is inevitable. The ‘skip’ from the last meeting foreshadowed a hike in July – and potentially another in September. Markets unanimously expect a July hike and Federal Reserve officials haven’t pushed back.
Since the June FOMC meeting, and in view of favourable inflation prints and softer employment data, markets no longer anticipate a September hike. While that may prove right, they might be getting ahead of themselves. One month’s data doesn’t make a trend. Further, core inflation remains too high for the Fed and labour markets are still quite resilient. Expectations of a US recession or hard landing continue to fade – ‘soft landing’ is the buzzword of the day.
More data will come in after the July FOMC meeting and data dependence will shape the September decision. Perhaps the Jackson Hole symposium in August will shed some light on Fed thinking.
The key challenge for the July meeting will be communications. Regardless of the September outlook, the Fed has won its months-long struggle, convincing markets that, at least for now, the FOMC is on hold for the rest of 2023. The July meeting should be wary of any statements that might imperil this victory.
Foreign exchange outlook
Predicting exchange rates is a fool’s errand. With that disclaimer, what is the dollar’s outlook for the remainder of the year?
The dollar is off its peak from last autumn, but it remains strong (Figure 1). The dollar’s upside may be limited as the Fed’s rate hiking cycle is nearing an end. Improving inflation may inject a downward bias to note and bond yields. However, the downside may also be limited given anticipation that the FFR, after peaking, will be on hold for the rest of 2023 and services price will be sticky.
Figure 1. Dollar remains strong despite falling from peak
Source: Federal Reserve; through June 2023
A soft landing scenario would comport with muted dollar sentiment and modest volatility, unlike a sharp risk-off or risk-on environment. Decent dollar selling could emerge when markets perceive with certainty the Fed will start embarking on rate cuts, but that isn’t priced in at this juncture until early next year.
The base case faces two-sided risks. If US inflation comes down more sharply than anticipated, major financial instability emerges or the economy sharply stagnates, the Fed could begin cutting rates earlier than expected, yields could fall and the dollar tumble. On the upside, more inflation persistence or greater than expected vigour in the US economy could sustain demand, as could a heightening in geopolitical risks.
Of course, the dollar will also be impacted by what is happening abroad.
Markets are discounting two more European Central Bank hikes this year – though there is increased debate about a September hike. The euro area economy has already stagnated and the outlook is for continued weakness. Absent further inflationary impulse, this weakness will curb the ECB’s hiking appetite and limit euro appreciation.
The Japanese yen’s course will be sensitive to finance ministry concerns about yen weakness and yield curve control policy expectations. Further yen weakness will be limited by market concerns over official jawboning or intervention. Meanwhile, markets expected a quick abandonment of YCC after Bank of Japan Governor Haruhiko Kuroda stepped down earlier this year, but his successor Kazuo Ueda has taken a cautious approach. However, YCC adjustment seems more a question of when than if. Altering YCC could significantly boost the yen.
There may be modest renminbi upside against the dollar. It’s a managed currency, and opaquely so. It has depreciated against the dollar by some 4% this year, mainly reflecting divergent monetary policy stances in the US and China. Capital inflow to China has sharply ebbed over the last year. The authorities are resisting depreciation, though not through formal People’s Bank of China intervention, and increasingly signalling stronger aversion to renminbi weakness. .
The Chinese growth surge expected after reopening has fallen short of expectations given strong headwinds. The PBoC has only run slightly more accommodative policies and the fiscal authorities have so far eschewed significant stimulus given the economy’s high indebtedness. The renminbi will remain soft overall, unless authorities embark unexpectedly on stepped up fiscal stimulus – a topic increasingly debated.
With the UK facing continued inflation challenges, the Bank of England may need to stick with relatively high rates, undergirding sterling.
One quarter of the dollar’s trade-weighted basket consists of the Mexican peso and Canadian dollar. Mexico moved preemptively to raise interest rates ahead of the Fed, hiking by nearly six percentage points since early 2022, and Banco de México is holding rates high, given elevated inflation. The peso took off this year, rising by 16%. Further upside is limited. The Canadian dollar through ups and downs has been fairly flat this year.
The picture facing emerging market currencies varies. But good performers that raised policy rates preemptively relative to the Fed, such as Brazil, have experienced good capital inflows this year.
Putting it all together, the dollar may trade narrowly with a softening bias for the rest of 2023. Next year may prove more interesting.
Mark Sobel is US Chair of OMFIF.
source passage : Federal Reserve

DOLLAR / DXY - Day-Trading Market Idea Price Action - Smart Money Concepts - Institutional Trading.. My Trading Analysis
4H: Price has not created new high, possible retracement to see IF price will continue uptrend at previous Higher Low or Break Structure.
1H: Price FAILED to create new high as well. We see a BOS on the line chart... indicating a possible reversal / retracement.
15M: (Entry Confirmation):
Would like to see price Break structure here while taking out the lows and continue down to next POI.
Will go over this on stream today.

dxy ready to gothe whole view is mentioned on the chart
do not want to spam too much..
remember to always enjoy your profits ;)

Will US Dollar fall to 2021 lows? The US dollar has recently fallen below its Simple Moving Average (SMA) of 100, an essential technical indicator for many traders.
Based on this recent movement, there is a growing concern among experts that the US dollar could potentially drop to its 2021 lows. This noteworthy development requires careful consideration, particularly for those relying heavily on the US dollar in their trading strategies.
Considering the US dollar's potential downward trajectory, I encourage you to explore the possibility of diversifying your currency holdings. Holding other foreign currencies could prove beneficial, as they may not be as susceptible to the impending drop in the US dollar's value.
It is essential to approach this situation cautiously and conduct thorough research before making decisions. Analyze the trends, consult with fellow traders, and seek advice from trusted sources to ensure you are well informed about the potential risks and rewards.
In light of these circumstances, I urge you to consider the following call to action:
1. Evaluate your current currency portfolio: Assess how much your trading strategy relies on the US dollar and consider diversifying your holdings to include other foreign currencies.
2. Stay updated on market trends: Regularly monitor the market and closely monitor the US dollar's performance. This will enable you to make informed decisions and adjust your trading strategy accordingly.
3. Seek expert advice: Consult with experienced traders or financial advisors specializing in forex trading. Their insights and recommendations can provide valuable guidance during uncertain times.
Remember, the purpose of this email is not to instill panic but to bring your attention to a potential market development that could impact your trading decisions. By remaining cautious and proactive, you can better navigate the volatile currency market and potentially mitigate potential losses.

Dollar Index (DXY): Multiple Time Frame Analysis & Trading Plan
Top-down analysis for Dollar Index.
Price action analysis & key levels.
Trading plan and potential scenarios.
❤️Please, support this video with like and comment!❤️

Dollar Index (DXY): Oversold Market & Time For Pullback 💵
After the CPI report this week, Dollar Index dropped rapidly.
Ahead, I see a confluence zone based on a completion point of a harmonic abcd pattern
and a horizontal historical key level.
From the underlined blue area, I will expect a bullish movement at least to 100.58 level.
❤️Please, support my work with like, thank you!❤️

Dollar Index (DXY): Inflation Data Ahead! Your Plan:
Multiple time frame analysis for Dollar Index.
Trading plan for Inflation Data explained.
Potential scenarios & recommendations.
❤️Please, support my work with like, thank you!❤️

Dollar Index / DXY Oversold Market! BUY
Dollar Index looks oversold after NFP.
I think that the market may start a correction on Monday.
I will expect a pullback to 102.8.
Please, support my work with like!

Dollar indexDollar index: As you know DXY determines pairs related to USD (which means all markets). 2 days ago, I had an analysis regarding dollar index. I don't know I published it or not (I guess not). But so far it exactly followed my analysis. I expected a high in dollar index (external liquidity sweep) and then a huge low to sweep internal liquidity which happened today. There is a nice order block (demand zone) which I have marked. I expect a reaction from this zone. if it breaks this zone I have marked another zone below this zone which I expect a reaction too. As you know, positive reaction in dollar index means negatvve reaction on EURUSD. So for the next move, I expect a positive reaction to the order block in dollar index, and negative reaction to the order block in EURUSD which will be my next analysis.

Dollar Index (DXY): Potential Scenarios & Trading Plan
Multiple time frame analysis on Dollar Index.
Price action & key levels.
Potential scenarios & thoughts.
❤️Please, support this video with like and comment!❤️
