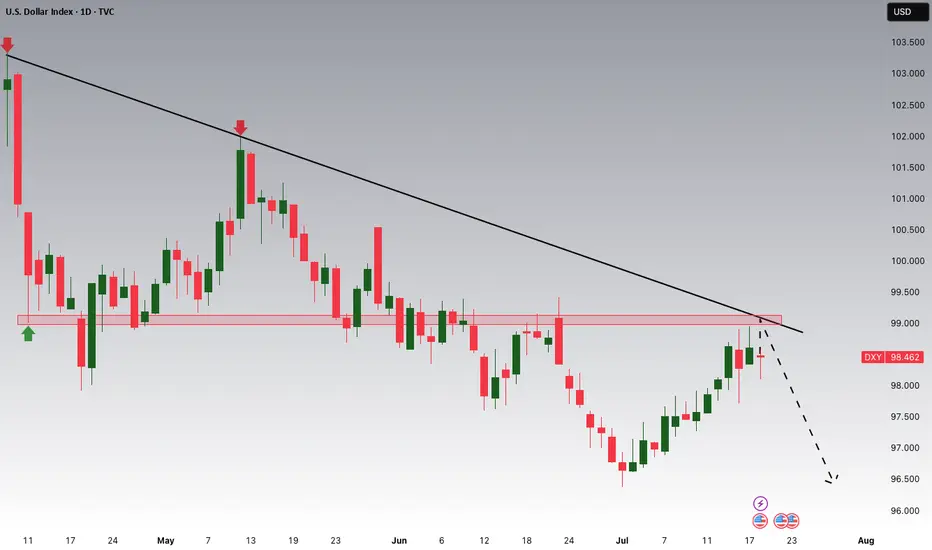
Dollar Index (DXY): Strong Bearish Price Action
Dollar Index broke and closed below a support line
of a bullish flag pattern on a daily.
Because the market is trading in a bearish trend,
this violation provides a strong bearish signal.
I expect a bearish movement to 96.75
❤️Please, support my work with like, thank you!❤️
Dollarindex

Dollar. When King of cash said : I'm still the king. 23/July/25DXY. when Dollar = the king of cash said : "Cash is King!" AND as a King of cash I'm RECLAIMING MY CROWN.. What will happen to "all equities market? e.g Stocks, Gold or even Bitcoin?
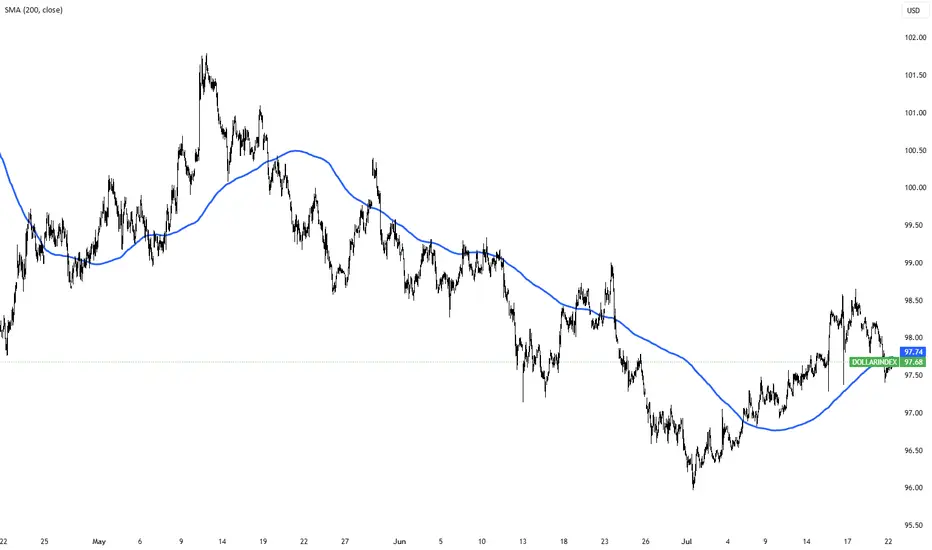
Dollar Index (DXY): Time to Recover
It looks like Dollar Index is going to recover after a yesterday's
rapid fall.
The market reached a key support and formed a cup & handle pattern on that.
We can expect a pullback at least to 98.09 level.
❤️Please, support my work with like, thank you!❤️

Dollar Index Holds Below 98 as Markets Await Trade Deal ProgressThe dollar index remained below 98 today, extending its two-day decline as investors watched trade negotiations ahead of the August 1 deadline. Treasury Secretary Scott Bessent said deal quality is the priority, suggesting Trump could grant extensions to countries showing real progress.
Markets are also focused on Fed Chair Powell’s speech for signals on interest rates. Despite Trump’s push for a cut, traders are not expecting action this month.
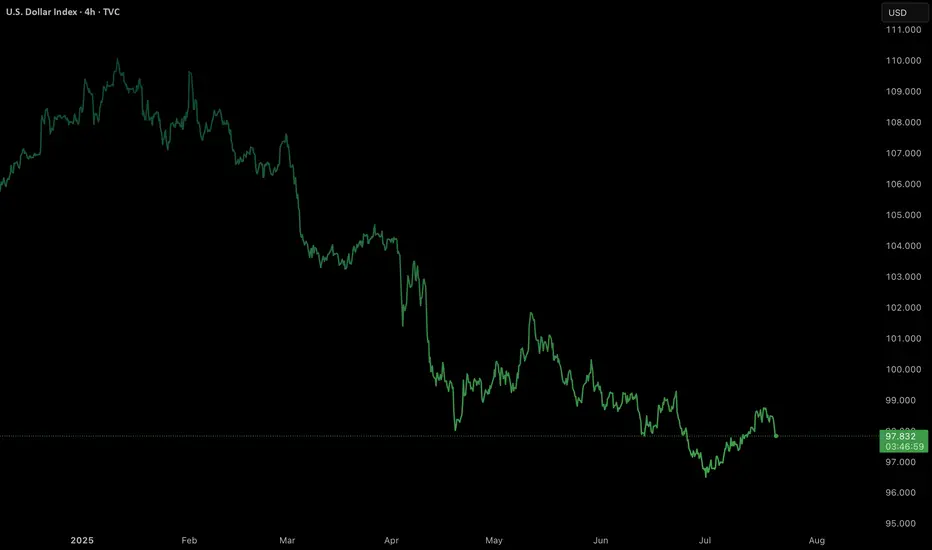
U.S. Dollar (DXY) bearish?Will dollar continue its bearish momentum or will it reverse?
Technical Summary
DXY remains in a firm bearish trend, having dropped around 11% this year. The setup is formed by a chain of lower highs and lower lows, confirming an unrelenting downtrend.
Support Level: ~97.70
Resistance Zone: 98.55–98.80
Long-Term Outlook: Bearish, unless a clear break and close over the resistance zone on the daily or weekly timeframe.
Technically, the momentum indicators remain weak, and the failure to sustain rallies above the 99.00 level also contributes to downward pressure further. The market is now consolidating within a narrow range after steep selling, which suggests probable continuation if macro catalysts are favourable.
Fundamental and Sentiment Drivers
Several macroeconomic and geopolitical drivers are underpinning the weakening of the U.S. dollar:
Federal Reserve Uncertainty:
Speculation over the ultimate fate of Federal Reserve Chairman Jerome Powell under political pressure from the executive branch has severely undermined investor confidence in the central bank’s independence. This has been manifested in increased volatility and bearish pressure on the dollar.
Trade Policy and Tariff Risks:
Ongoing trade tensions, including the possibility of sweeping tariffs (15–20%) on Chinese and European Union goods, have created a risk premium on valuations of the U.S. dollar. Market players still fear retaliation and its effects on trade stability in the world.
Fiscal Position and Credit Ratings:
The US fiscal deficit, which is approaching 7% of GDP, and recent credit rating downgrades to its outlook, have set alarms ringing regarding the structure. These fiscal developments have eroded the popularity of the US dollar as a safe-haven asset, particularly with foreign investors.
Global Monetary Landscape:
With European Central Bank and Bank of Japan maintaining policy guidance tight, and Federal Reserve already indicating that direction for a rate cut in Q4 2025 is being eyed, the falling rate differentials still maintain pressure on the dollar.
Market Outlook: Week of July 21–25, 2025
Major Geopolitical and Economic Events:
DATE : Ongoing
EVENT : U.S.- EU & U.S. — China Trade Negotiations.
MARKET RELEVANCE : High
Resolution or escalation will directly impact USD demand.
DATE : Mid-week
EVENT : Federal Reserve Speeches (including Powell)
MARKET RELEVANCE : High
Monetary policy guidance and institutional stability.
DATE : July 24–25
EVENT : Jobless Claims, Flash PMIs, New Home Sales, Durable Goods Orders
MARKET RELEVANCE : Medium–High
Labour market data, housing data, and production activity have the potential to shift rate expectations and dollar sentiment ahead of the FOMC and PCE releases.
Strategic Implications
Outlook: DXY remains structurally bearish in the short to medium term. Additional weakness below 98.80 and sustained closes below 97.70 would reassert downward momentum, risking a further retracement to the 96.00-95.50 region.
Possible Bullish Reversal Triggers:
A conclusive resolution to U.S. trade negotiations.
Unexpectedly solid economic data (particularly core inflation or employment).
Hawkish Fed commentary supporting policy tightening expectations.
Last thoughts
The U.S. Dollar Index is currently at structurally weak technical and fundamental foundations. Absent a sudden reversal of the monetary policy message or geopolitical resolution, the path of least resistance appears to remain to the lower side. Market participants need to pay special attention to upcoming economic data releases, central bank rhetoric, and trading news because any one of them could be a pivotal driver of near-term dollar behavior.
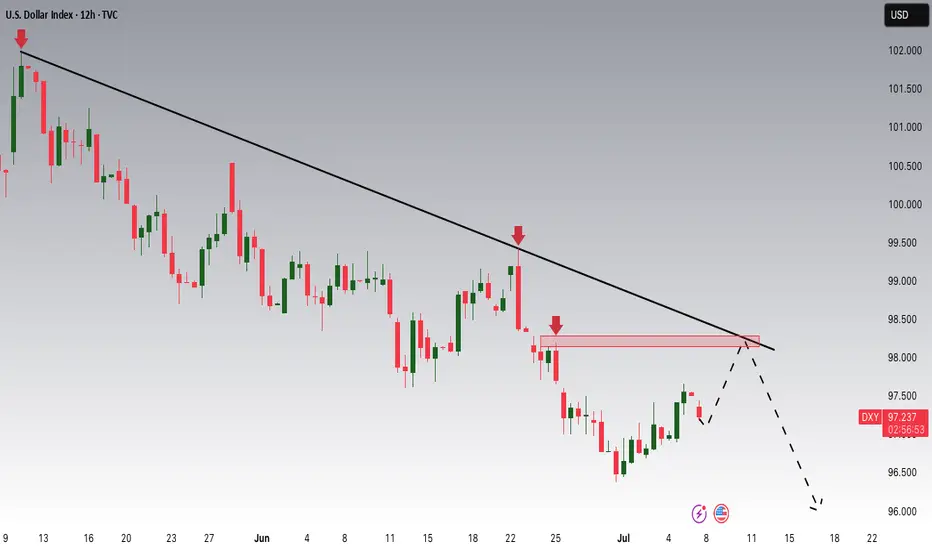
DXY Potential DownsidesHey Traders, in the coming week we are monitoring DXY for a selling opportunity around 99.000 zone, DXY is trading in a downtrend and currently is in a correction phase in which it is approaching the trend at 99.000 support and resistance area.
Trade safe, Joe.
EURUSD Buy Trade Idea: Reversal Rocket Ready to Launch!Hey Fellow Traders! 👋
The EURUSD (EU) is setting up for a massive reversal that’s got me hyped! 🚀 After nailing the lows of that descending channel like a pro, price has retraced to our expected zone and is now bouncing hard. It’s time to gear up for a potential buy trade targeting the Buyside Liquidity! Let’s break down this fire setup and get ready to ride the wave! 🌊
📈 The Setup: Reversal in the Making!
EU hit the descending channel lows as predicted, and now it’s showing some serious bullish vibes with a strong bounce off a key weekly trendline support. This isn’t just a random move—price is reacting to a weekly demand zone and a trendline that’s holding like a fortress. 🏰 I’m expecting a reversal to kick in, aiming for that juicy Buyside Liquidity up top. But hold up—don’t just dive in blindly! Let’s talk strategy. 😎
🎯 Trade Details: How to Play It Smart
Entry Zone: Look for a calculated entry in this bounce area. Key setups to watch for:
FVG (Fair Value Gap) or IFVG (Imbalance Fair Value Gap) for precision entries.
Order Blocks (OB) for high-probability setups.
Trendlines/Support Zones: Use these for confluence, as EU is respecting that weekly trendline support.
Target: We’re gunning for the Buyside Liquidity—a high-probability target where price loves to gravitate.
Stop Loss: Place your stops below the recent lows or your chosen setup (FVG/OB) to keep risk tight.
👀 Keep an Eye on DXY for Confluence
The Dollar Index (DXY) is a key player here. A weakening DXY could supercharge this EU reversal, so monitor it closely for extra confirmation. If DXY starts to roll over, it’s like pouring rocket fuel on this trade! 🚀
🧠 Why This Reversal Makes Sense
Weekly Trendline Support: Price kissed this level and is bouncing like it means business.
Weekly Demand Zone: This area has historical strength, making it a prime reversal spot.
Channel Lows Conquered: EU smashed through the descending channel lows and is now retracing for the next leg up.
⚠️ Risk Management Reminder
Don’t YOLO this one! Use proper risk management—calculate your position size, set tight stops, and only enter when your setup aligns. Whether you’re using FVGs, OBs, trendlines, or classic support/resistance, make sure your entry is calculated to avoid getting caught in a fakeout. 💪
💬 Let’s Talk Trades!
What’s your take on this EU reversal? Are you jumping in with an FVG, OB, or something else? Drop your thoughts, setups, or questions in the comments below! 👇 If this idea gets you pumped, smash that LIKE button ❤️, follow for more banger trade ideas, and share your charts with the community! Let’s keep the vibes high and the profits higher! 💰
#EURUSD #ForexTrading #BuyTrade #Reversal #TradingView

EURUSD long Lion SETUPhello everyone
the price is in a strong demand area
as liquidity has been withdrawn
and the fair value gap has been filled
but we are waiting for formation pattern on a smaller frame in order to enter an upward wave.
we also have resistance area
so in short. I expect an upside go upppp
Yen Weakness Deepens as Dollar Strength ResurfacesThe Japanese Yen continues to struggle, extending its multi-session decline against the U.S. Dollar. This morning’s weakness followed disappointing Japanese trade data, with June’s surplus falling well short of expectations due to another sharp contraction in exports, particularly to China. This trend has renewed fears that Japan may be slipping into a technical recession, which has further undermined confidence in the Yen.
Beyond trade numbers, Japan’s macro landscape is becoming increasingly fragile. Real wages have declined, inflation is cooling, and the Bank of Japan’s path to normalizing policy now appears more uncertain. Adding to the pressure, political risk is also rising ahead of the upcoming Upper House election, leaving markets without a clear direction from fiscal leadership.
In contrast, the U.S. Dollar is enjoying a resurgence. Federal Reserve members, including Williams and Logan, hinted this week that rates could remain higher for longer, particularly as President Trump’s latest wave of tariffs adds to inflation concerns. The administration’s recent clarification that there are no plans to replace Fed Chair Jerome Powell has also calmed investor nerves, restoring faith in policy stability. The result: increased demand for the dollar at the Yen’s expense.
Technical Outlook:
• Current price: Just below 148.60 resistance
• Support: 147.90 and 147.50
• Breakout potential: A decisive move above 148.60 could open the door toward 149.60 and even test the psychological 150.00 mark—last seen in March.
• Indicators: Price is supported by the 100-hour EMA with positive oscillator alignment.
Momentum remains bullish unless support at 147.90 is breached.
Takeaway: Expect continued volatility as the Yen reacts to domestic data while USD remains supported by Fed hawkishness and trade tensions.

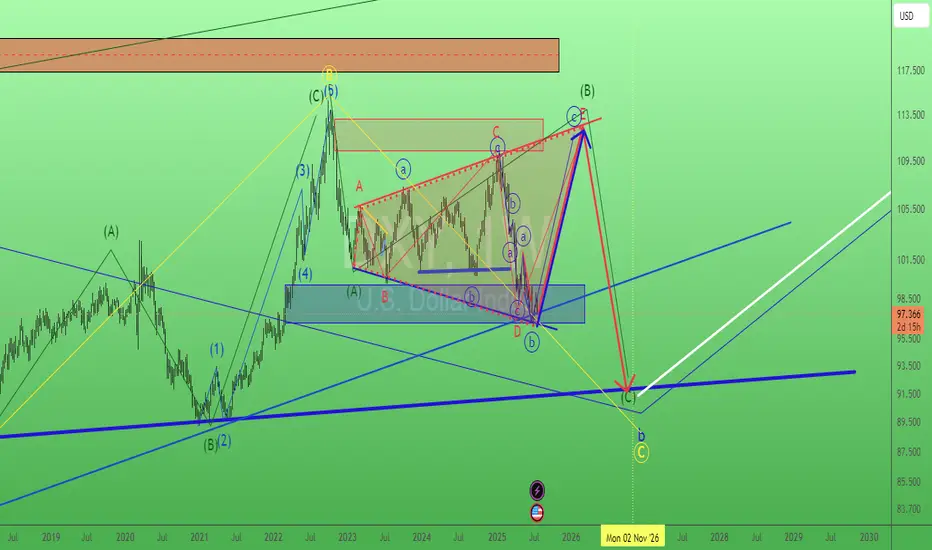
Dollar MoonHey,
Been a while that I shared a chart here, sorry for that.
I love the place where the dollar is at the moment.
The easiest plays are from these long-term value areas, and this one is also stacked with a trendline making it a bit more obvious for everyone.
The daily trend is broken since yesterday, shifting bullish long-term. I think a daily pullback is likely, perhaps even back to daily lows to fill up demand.
But long-term, I am super bullish for the dollar.
The $ has been bullish since 2008, we all see it.
Time for the next leg up.
Let's go!
Kind regards,
@ mnieveld

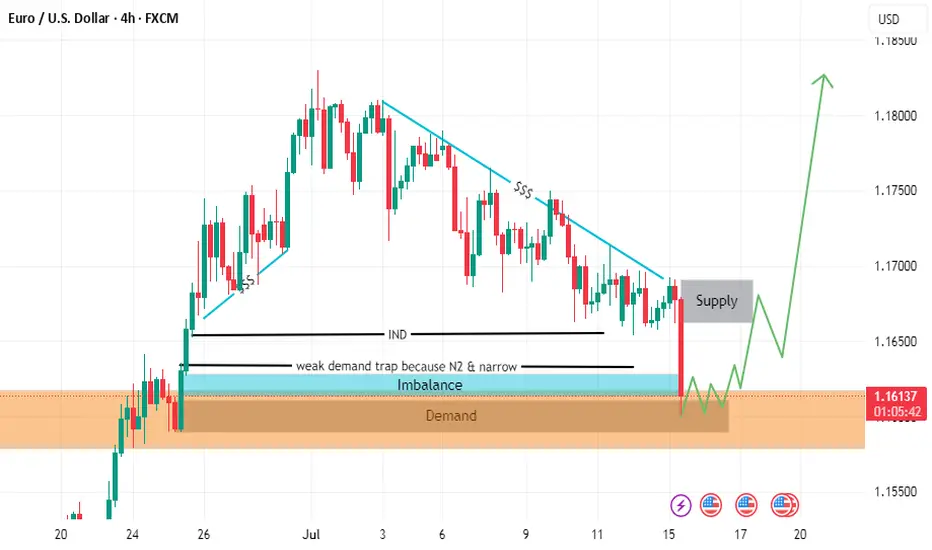
Dollar Index Having Bullish MomentumDollar Index shown good bullish momentum on previous day as we analyzed it earlier. Index has created a imbalance now the possibility for the index is to retrace back to imbalance and continue the bullish momentum and target towards the supply zone and swing high.

USDCAD LONG DAILY FORECAST Q3 D15 W29 Y25USDCAD LONG DAILY FORECAST Q3 D15 W29 Y25
Professional Risk Managers👋
Welcome back to another FRGNT chart update📈
Diving into some Forex setups using predominantly higher time frame order blocks alongside confirmation breaks of structure.
Let’s see what price action is telling us today! 👀
💡Here are some trade confluences📝
✅Daily Order block identified
✅4H Order Block identified
✅1H Order Block identified
🔑 Remember, to participate in trading comes always with a degree of risk, therefore as professional risk managers it remains vital that we stick to our risk management plan as well as our trading strategies.
📈The rest, we leave to the balance of probabilities.
💡Fail to plan. Plan to fail.
🏆It has always been that simple.
❤️Good luck with your trading journey, I shall see you at the very top.
🎯Trade consistent, FRGNT X

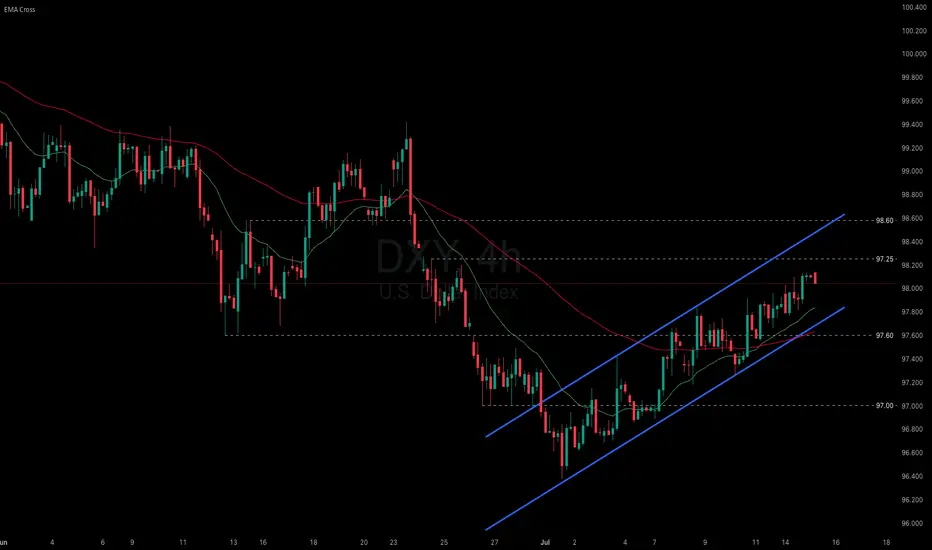
Dollar holds steady uptrend despite Trump’s tariff threats.
President Trump announced a 30% tariff on imports from both the EU and Mexico, a hike from the 20% previously imposed on the EU in April. He also warned that if no agreement is reached on the Ukraine war within 50 days, countries trading with Russia could face a 100% tariff.
Meanwhile, market volatility is being amplified by speculation over Fed Chair Powell’s potential dismissal, as attacks against him intensify from Trump and his allies. Deutsche Bank warned that Powell’s removal could trigger sharp swings in both the dollar and bond markets.
DXY has extended its two-week rally after testing the recent low, approaching the 98.00 threshold. The index remains within the ascending channel, indicating the potential continuation of bullish momentum. If DXY breaches above the resistance at 98.25, the index could gain upward momentum toward 98.60. Conversely, if DXY breaks below the support at 97.60, the index may retreat to 97.00.
DOLLAR PUSHING HIGHERPrevious week high has taken by a bullish move. Market printed a nice 4H imbalance which shows the potential of the market to go further higher.

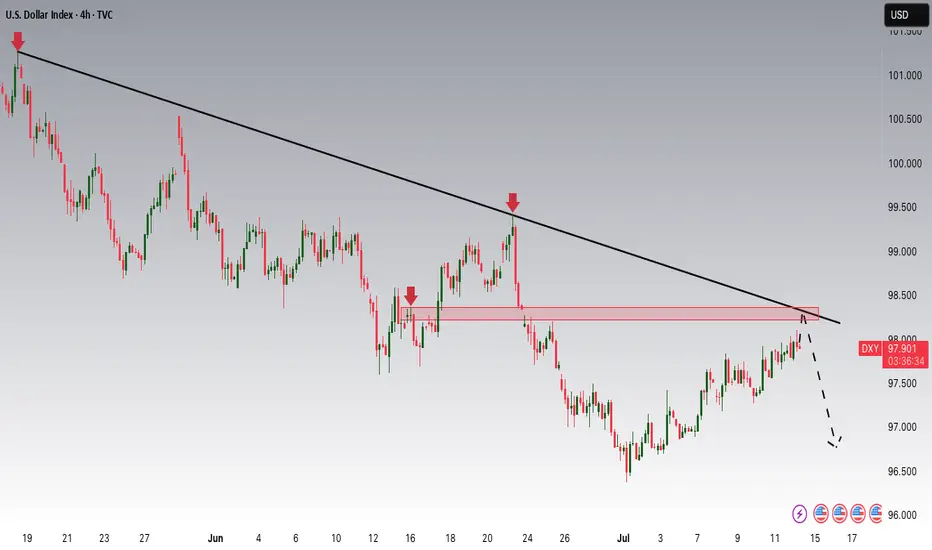
DXY Potential DownsidesHey Traders, in today's trading session we are monitoring DXY for a selling opportunity around 98.300 zone, DXY is trading in a downtrend and currently is in a correction phase in which it is approaching the trend at 98.300 support and resistance area.
Trade safe, Joe.
Gold Weekly Analysis | Will $3,360 Break or Hold? [July 14–18]In this video, I break down the recent gold price action and what to expect in the coming week. We’ll review how gold responded to last week’s FOMC minutes, why $3,360 remains a key decision zone, and what upcoming U.S. economic data (CPI, PPI, Retail Sales) could mean for price movement.
👉 If you find this content valuable, don’t forget to Vote, Comment, and Subscribe for weekly market breakdowns.
Disclaimer:
Based on experience and what I see on the charts, this is my take. It’s not financial advice—always do your research and consult a licensed advisor before trading.
#GoldAnalysis, #XAUUSD, #ForexTrading, #GoldForecast, #MarketOutlook, #TechnicalAnalysis, #FundamentalAnalysis, #GoldPrice, #FOMC, #CPIData, #PPIdata, #DollarIndex, #TradingStrategy, #WeeklyOutlook, #GoldTechnicalAnalysis, #TradeSmart, #Darcsherry

AUSSIE BANK ROBBERY: AUD/USD Bullish Breakout Confirmed!🔥 AUD/USD BANK HEIST: The Ultimate Bullish Robbery Plan (Thief Trading Style) 🔥
🌟 ATTENTION, MONEY MAKERS & MARKET ROBBERS! 🌟
💸 MISSION BRIEF:
Based on Thief Trading Style (technical + fundamental analysis), we’re executing a bullish heist on AUD/USD ("The Aussie")—time to steal those pips like a pro!
📈 ENTRY STRATEGY (The Heist Begins!)
Long Entry Trigger: Wait for Dynamic Resistance MA crossover + candle close above 0.65300 (bullish confirmation).
Pro Tip: Use Buy Stop orders above MA or Buy Limit orders on pullbacks (15m/30m timeframe).
🔔 SET AN ALERT! Don’t miss the breakout—alert up, gloves on!
🛑 STOP LOSS (Protect Your Loot!)
"Yo, rookie! 🗣️ If you’re entering on breakout, DO NOT set SL before confirmation!
📍 Thief SL Placement: Nearest 4H swing low (0.64800)—adjust based on your risk, lot size, & trade multiples.
⚠️ Warning: Deviate at your own peril—your risk, your rules!
🎯 TARGET (Cash Out & Run!)
Take Profit Zone: 0.65800
Scalpers: Long-only plays! Use trailing SL to lock profits.
Swing Traders: Ride the wave—big money moves require patience!
📰 FUNDAMENTAL BACKUP (Know Why We Robbin’!)
Bullish momentum fueled by macro trends, COT data, sentiment shifts.
🚨 Breaking News Alert: Avoid high-impact news spikes—trail SL or stay out!
💥 BOOST THE HEIST!
Hit 👍 LIKE, 🔄 SHARE & 🚀 BOOST—strengthen the robbery squad! More heists = more profits!
🤑 NEXT HEIST COMING SOON… STAY TUNED! 🐱👤

Dollar Index AnalysisTwo possibilities for the dollar index has been shown here. We can see that dollar index is showing a short term uptrend. Which is clearly visible from the chart.
1: Dxy can maintain this short term uptrend. Because it is a monthly pullback. As it has been
for last 5 months.
2: Dxy can change character and again touches to the monthly demand zone as shown in my
previous video.

Dollar Index Analysis [DXY]Market has show upper wicks for last 3 days which is the sign that there is still sell pressure. The daily candles for this week are range bound. 4H chart is showing short term uptrend which is maintaining higher highs and higher lows. We can use this range to have scalps in this range.

"DXY Bullish Setup – High Probability Trade!"🚨 "DXY DOLLAR BANK HEIST" – THIEF TRADING STYLE MASTER PLAN (HIGH-IMPACT TRADE ALERT!)
🔥 "Steal the Market Like a Pro – This DXY Heist Could Print Serious Cash!" 🔥
🌍 Greetings, Market Pirates & Profit Raiders! 🌍
🤑 "Money isn’t made… it’s TAKEN!" 💰💸
Based on the 🔥 Thief Trading Style 🔥 (a lethal mix of technical + fundamental + psychological warfare), we're executing a DXY Dollar Index Bank Heist—a high-stakes robbery where YOU get to keep the loot!
📜 THE HEIST BLUEPRINT (TRADE PLAN)
🎯 ENTRY ZONE – "BREAK THE VAULT DOOR!"
📍Key Trigger: Wait for price to SMASH through the Moving Average Wall (97.700) – then STRIKE!
🔪 Thief’s Entry Trick:
Buy Stop Orders above MA (aggressive)
Buy Limit Orders near recent swing low (smart pullback play)
DCA/Layering Strategy for max profit extraction (real robbers scale in!)
🚨 ALERT SETUP: "Don’t miss the breakout – set an ALARM!" ⏰
🛑 STOP LOSS – "DON’T GET CAUGHT!"
"Yo, rookie! If you’re entering on a breakout, WAIT for confirmation before placing SL!"
📍Thief’s SL Zone: 97.400 (30min swing low – adjust based on your risk appetite!)
⚠️ WARNING: "Place it wrong, and the cops (market) will lock YOU up!" 🚔
🎯 TARGET – "ESCAPE WITH THE LOOT!"
🏆 Primary Target: 98.350 (Take profits before the resistance police show up!)
🔄 Scalper’s Bonus: "Trail your SL, squeeze every pip!"
💡 Pro Tip: "If you’re underfunded, ride with the swing traders – teamwork makes the dream work!"
💣 WHY THIS HEIST WILL WORK (MARKET DYNAMICS)
✅ Bullish Momentum Building (DXY showing strength!)
✅ Overbought? Maybe… but thieves don’t wait for permission!
✅ Trend Reversal Potential (Big money shifting!)
✅ Police (Resistance) Trap Ahead (Escape before they catch you!)
📡 NEWS & RISK MANAGEMENT (DON’T GET BUSTED!)
🚨 High-Impact News? AVOID new trades! (Use trailing stops to lock profits!)
📊 Check COT Reports, Macro Data, Geopolitics (Smart thieves do their homework!)
💥 BOOST THIS HEIST – LET’S GET RICH TOGETHER!
👊 "Hit the LIKE & BOOST button to fuel our next heist!"
💖 "More boosts = More robberies = More FREE money for YOU!" 🚀
⚠️ DISCLAIMER (LEGAL SPEAK)
"This ain’t financial advice – just a damn good robbery plan. Trade at your own risk, and don’t cry if you ignore the SL!" 😎
🔔 Stay tuned for the next heist… The market’s our playground! 🏴☠️💰
🚀 "See you at the next breakout, thief!" 🚀
🔥 #DXY #Forex #Trading #BankHeist #ThiefTrading #ProfitPirates #MakeMoney #TradingView #SmartMoney 🔥

Dollar Index AnalysisDollar Index has been in continuous sell for last 5 Months. Has hit the demand zone and giving a pull back and short term trend in daily and 4H charts. From the 4H charts we can see that it is in short term uptrend move and has pushed higher and it is giving a pull back which is visible.

DXY Potential DownsidesHey Traders, in today's trading session we are monitoring DXY for a selling opportunity around 98 zone, DXY is trading in a downtrend and currently is in a correction phase in which it is approaching the trend at 98 support and resistance area.
Trade safe, Joe.
AUDUSD 4H: Sell Zone Confirmed📉 AUDUSD Analysis – Current Trend & Trade Opportunity
Hello Traders,
I’ve prepared an updated analysis for the AUDUSD pair.
At the moment, AUDUSD has shifted out of its previous bullish structure and has now entered a bearish trend. Based on this shift, I’m planning to enter a limit sell trade at the level shared below:
🔹 Limit Sell Entry: 0.65232
🔹 Stop Loss: 0.65576
🔹 Targets:
• TP1: 0.64591
• TP2: 0.64591
• TP3: 0.63738
🔸 Risk/Reward Ratio: 4.27
Considering the trend reversal, I’m looking to open a position from these levels.
I meticulously prepare these analyses for you, and I sincerely appreciate your support through likes. Every like from you is my biggest motivation to continue sharing my analyses.
I’m truly grateful for each of you—love to all my followers💙💙💙
