Mighty Dollar Roars Back: A Wake-Up Call for Global MarkeThe financial markets of 2024 have witnessed a surprising resurgence: the unwavering strength of the US dollar. After predictions of a decline at the year's outset, the greenback has defied expectations, surging over 4% according to the Bloomberg dollar index. This unexpected power play by the dollar serves as a stark wake-up call for investors around the globe, forcing a reassessment of global economic dynamics.
Several factors are fueling the dollar's dominance:
• Resilient US Economy: Contrary to forecasts of a slowdown, the US economy has displayed remarkable strength. Robust economic data, coupled with persistent inflation, has prompted the Federal Reserve to take a more hawkish stance. Rising interest rates in the US make dollar-denominated assets more attractive to investors, increasing demand for the currency.
• US Exceptionalism Narrative: The perception of the US as a safe haven in a world riddled with geopolitical uncertainties is bolstering the dollar's appeal. Geopolitical tensions, exemplified by the ongoing war in Ukraine, are driving investors towards reliable and stable economies. The relative stability of the US, compared to global turmoil, strengthens the dollar's position as a go-to currency during times of crisis.
• Sticky Inflation: The Federal Reserve's fight against inflation is another key driver of dollar strength. The Fed's commitment to raising interest rates, while potentially slowing economic growth, is seen as a necessary step to curb inflation. This hawkish stance stands in stark contrast to the dovish policies of central banks in other major economies, like the Bank of Japan (BOJ), which continues to maintain ultra-low interest rates. This divergence in monetary policy further strengthens the dollar's relative appeal.
The Ripple Effects
The resurgent dollar has significant ramifications for global markets:
• Currency Devaluation: A stronger dollar puts downward pressure on other currencies. This can make imports into the US cheaper but exports from the US more expensive, potentially impacting global trade dynamics. Emerging market economies, particularly those heavily reliant on foreign capital, could face currency depreciation and capital outflows.
• Equity Market Volatility: The rising dollar can create headwinds for equity markets outside the US. As the dollar strengthens, foreign investments become less attractive, potentially leading to capital repatriation and reduced liquidity in other markets. This could lead to increased volatility in global stock markets.
• Commodities Market Impact: A strong dollar generally translates to lower commodity prices. This is because most commodities are priced in US dollars, so a stronger dollar makes them relatively more expensive for holders of other currencies. This could impact countries heavily reliant on commodity exports.
The Road Ahead
The future trajectory of the dollar remains uncertain. The path of US interest rates, the evolution of global economic conditions, and the persistence of geopolitical tensions will all be crucial factors shaping the dollar's strength.
The current scenario presents both challenges and opportunities for investors. A strong dollar can create opportunities in US assets but necessitates careful portfolio diversification to mitigate currency risks. The evolving global landscape demands close monitoring and a nimble investment strategy to navigate the volatility.
The resurgent dollar serves as a potent reminder of the US economy's enduring strength and its role as a global anchor currency. As the world grapples with geopolitical and economic uncertainties, the dollar's reign is likely to continue for the foreseeable future, demanding a recalibration of global investment strategies.
Dollarindex

DXY sell after retest resistance zonehello dear trader
I think the dollar will continue to fall after filling the gap... there is a strong resistance zone above it... harmonic pattern and resistance zone and fibos... on the other hand, due to the high bank interest rate and the possibility of a bank collapse Again.. the soft landing will begin soon
i think the yello area is the best place for open the sell position
good luck

DXY Next move!(4/22/2024)In our last analysis, the DXY TVC:DXY continued its upward movement. actually due to geopolitical crisis, the market was betting on stronger dollar.
We believe that this week is going to be calm and slow market.
we are still bullish on US dollar.
Our technical view has been shown in the chart.
If you like it then Support us by Like, Following, and Sharing.
Thanks For Reading
Team Fortuna
-RC
(Disclaimer: Published ideas and other Contents on this page are for educational purposes and do not include a financial recommendation. Trading is Risky, so before any action do your research.)

DXY, Elliott wave analysis■Outlook for DXY on 1W chart.
We are in sub-wave iii of the upper degree wave C.
The sub-waves of wave iii will form a 5-wave impulse.
If the assumptions of this scenario are correct,
the sub-wave (3) of wave iii should start soon.

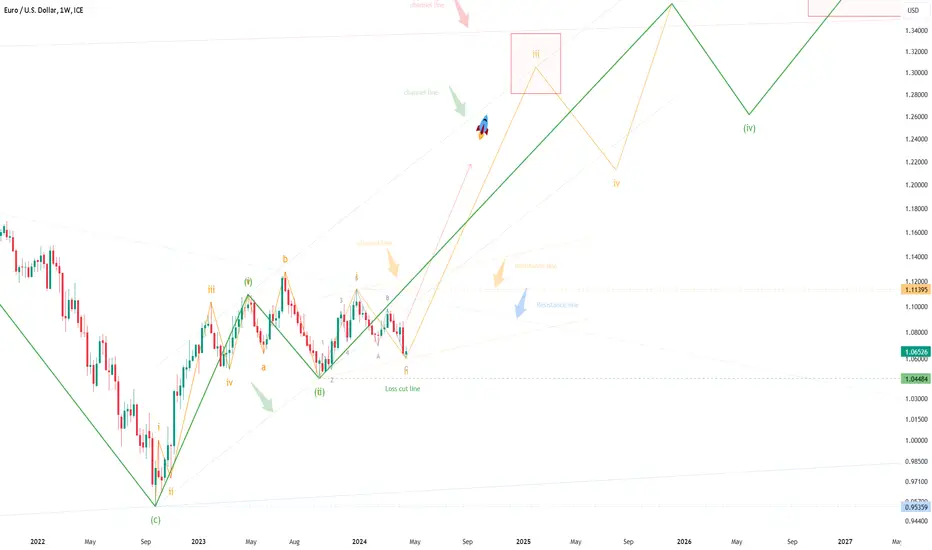
EURUSD, Elliott wave analysis■Outlook for the EURUSD 1W chart.
Currently, we are in sub-wave ⅱ of wave (ⅲ).
Sub-wave ⅱ is expected to complete soon.
After that, sub-wave ⅲ will start.
It is anticipated that sub-wave ⅲ will form a five-wave impulse.
If the assumptions of this scenario are correct, sub-wave ⅲ is likely to break through several channel lines and resistance lines, and I think the bullish trend will continue.
$DXY - Next Resistances to Watch *W & *D (tf) TVC:DXY *D (tf)
Previous Ideas of Resistance to Watch (before & after 'play button' )
(before & after 'play button' )
Next decent Resistances for TVC:DXY to face will be the 0.5 Macro Fibb Level @107.7 level .
Surpassing that via decent breakout, correction may be anticipated as a retest and
confirmation for TVC:DXY to continue Higher.
Meanwhile on the *W (tf),
TVC:DXY managed not to close its 12 Consecutive Green Weekly Candlestick.
Whats worrying is that the last Weekly Close was very Bearish in Price Action,
printing whats called ' A Topping Tail '

Fed Higher-for-Longer Strategy: Strong Dollar SqueezeThe Fed's Higher-for-Longer Strategy: A Strong Dollar Squeezes Markets
The Federal Reserve's unwavering commitment to its "higher-for-longer" interest rate policy is pushing the U.S. dollar to its limits. Chair Jerome Powell's recent pronouncements leave little doubt: rate cuts won't be coming soon. This strong dollar is creating a ripple effect across global markets, leaving other central banks and investors struggling to keep pace.
The "higher-for-longer" strategy refers to the Fed's intention to maintain elevated interest rates for a sustained period. This is a critical tool for combating inflation, which remains a top concern for the U.S. economy. By raising interest rates, the Fed discourages borrowing and investment, thereby dampening economic activity and ultimately slowing inflation.
However, this approach comes at a cost. A stronger dollar makes U.S. exports more expensive and foreign imports cheaper. This can hurt American businesses competing overseas and widen the U.S. trade deficit. Additionally, a surging dollar makes it more expensive for other countries to service their dollar-denominated debt.
The impact is already being felt globally. Here's a breakdown of the key challenges:
• Market Squeeze: Higher U.S. interest rates make dollar-denominated assets more attractive to investors. This entices capital to flow out of emerging markets and other economies, putting downward pressure on their currencies and stock markets. These economies become more vulnerable to financial instability as capital flight weakens their local markets.
• Central Bank Dilemma: Other central banks are caught in a bind. They may want to raise rates to combat inflation in their own economies, but doing so could further strengthen the dollar relative to their currencies. This exacerbates the problems mentioned above and makes it difficult for them to achieve their desired economic goals.
• Debt Sustainability: Countries with large amounts of dollar-denominated debt face a growing burden. As the dollar strengthens, it becomes more expensive for them to service their debt, potentially leading to defaults and financial crises.
Despite these challenges, the Fed is unlikely to deviate from its course anytime soon. Powell has emphasized the need to bring inflation under control, even if it means sacrificing some economic growth. This unwavering commitment to taming inflation strengthens the dollar further, potentially leading to a prolonged period of global economic strain.
However, there are some potential mitigating factors:
• Weakening Dollar: The dollar's strength may not be sustainable in the long run. If the Fed eventually signals a pause in rate hikes, or if inflation shows signs of receding, the dollar could weaken. This would provide some relief to other economies.
• Global Cooperation: International cooperation between central banks could help to ease the pressure on global markets. By coordinating their policies, central banks could find a way to address inflation without creating excessive currency volatility.
The coming months will be crucial in determining the long-term effects of the Fed's policy. While the strong dollar offers some advantages for the U.S. economy, the potential for global economic instability cannot be ignored. The Fed's navigation of this complex situation will be critical in ensuring a smooth landing for the U.S. and the global economy as a whole.

Betting on a Stronger Dollar Greenback Gets ExpensiveThe US dollar is soaring, and investors are scrambling to jump on the bandwagon. This surge in demand is reflected in the options market, where the cost of betting on further dollar appreciation has reached its highest point since November 2023. This trend highlights the growing confidence in the US economy's resilience, prompting a flight to safety in the greenback.
Several factors are fueling the dollar's current strength. Firstly, the US economy continues to demonstrate surprising resilience in the face of global headwinds. Recent data, such as stronger-than-expected retail sales figures, has prompted investors to pare back bets on aggressive interest rate cuts by the Federal Reserve. This shift in expectations has bolstered the appeal of the dollar relative to other currencies.
Secondly, the turmoil in global markets is driving investors towards safe-haven assets. Geopolitical tensions and rising inflation across the globe are creating uncertainty, pushing investors to seek the relative stability offered by the US dollar. The dollar's long-standing reputation as a reserve currency makes it a natural destination for these risk-averse investors.
This surge in demand for the dollar is evident across the foreign exchange market. The Bloomberg Dollar Spot Index, which tracks the greenback's performance against a basket of major currencies, has climbed to a five-month high. The dollar has already notched up impressive gains against major rivals like the yen, reaching a 34-year high, and strengthening significantly against the euro, pound, and several other currencies.
This bullish sentiment towards the dollar is spilling over into the options market. Investors seeking to profit from a continued rise in the dollar's value are increasingly turning to call options. However, this increased demand comes at a cost. The premium, or the upfront cost, of buying these call options has risen significantly. This surge in option prices indicates that investors are willing to pay a higher price to secure their bets on a stronger dollar.
The trend in the options market presents a mixed bag for investors. On the one hand, the rising cost of call options suggests that the market is anticipating further dollar appreciation. This could be a lucrative opportunity for those who correctly predict the dollar's trajectory. On the other hand, the higher premiums eat into potential profits, making successful bets on the dollar more challenging.
Looking ahead, the future path of the dollar hinges on several key factors. The trajectory of the US economy, the actions of the Federal Reserve, and the evolution of global geopolitical and economic conditions will all play a role in determining the dollar's strength.
Despite the uncertainties, the current trend suggests a continued period of dollar dominance. Investors, however, should carefully consider the increased costs of betting on the dollar in the options market and ensure their strategies account for these elevated premiums. This is a dynamic situation, and close monitoring of both economic data and market movements will be crucial for navigating the ever-evolving currency landscape.

DXY - Daily longFor those curious about the DXY's direction and targets, take note of the bullish movements displayed in these two legs.
The Dollar Index is showing signs that it could complete these runs and effortlessly reach the resistance zone.
Keep a close eye on these developments as the DXY approaches key levels.

Emerging Markets Struggle as the Mighty Dollar FlexesThe recent strength of the US dollar is posing a significant challenge for emerging markets around the world. Their currencies are weakening, creating a ripple effect across their economies. This article explores the reasons behind the dollar's dominance, the impact on emerging markets, and potential policy responses.
A Rising Dollar: The Driving Forces
The US dollar has been on a tear in recent months, appreciating against most major currencies. This surge can be attributed to several factors, including:
• US Federal Reserve Policy: The Federal Reserve's aggressive interest rate hikes aimed at curbing inflation are attracting investors seeking higher returns on dollar-denominated assets. This increased demand strengthens the dollar.
• Global Economic Uncertainty: As concerns about a global economic slowdown grow, investors flock to the perceived safety of the US dollar, seen as a safe haven asset during times of turmoil.
• Geopolitical Tensions: The ongoing war in Ukraine and heightened tensions between the US and China are further fueling risk aversion, pushing investors towards the dollar.
Emerging Markets Under Pressure
The rise of the US dollar presents a major headache for emerging markets. Weakening local currencies lead to several problems:
• Imported Inflation: When the local currency weakens, the cost of imported goods rises. This can exacerbate inflation in emerging markets, which are already grappling with rising prices due to global supply chain disruptions.
• Debt Burden: Many emerging market economies have significant dollar-denominated debt. A weaker local currency increases the cost of servicing this debt, putting a strain on government finances.
• Capital Flight: The strengthening dollar can trigger capital outflows from emerging markets as investors seek better returns elsewhere. This can lead to currency depreciation and hinder economic growth.
Policy Responses: Verbal Intervention and Beyond
Emerging markets are not sitting idly by as their currencies weaken. Several are exploring policy options to counter the dollar's might:
• Verbal Intervention: Central banks in some emerging markets, like Malaysia, have resorted to verbal intervention, signaling their commitment to supporting their currencies. However, this approach has limited long-term effectiveness.
• Interest Rate Hikes: Some central banks, such as Brazil, are considering raising interest rates to attract capital inflows and stabilize their currencies. However, this risks slowing down economic growth.
• Currency Intervention: Central banks may intervene directly in the foreign exchange market by selling dollars and buying local currency to prop it up. This approach can be expensive and depletes foreign exchange reserves.
JPMorgan and ANZ Weigh In: The Need for More Tools
Financial institutions are also analyzing the situation. JPMorgan Asset Management suggests that more verbal intervention may be necessary from emerging markets to manage volatility. However, analysts at ANZ bank believe that China, a major emerging market with significant influence, may need to deploy a wider range of tools, potentially including capital controls, to limit the depreciation of its currency, the yuan.
Looking Ahead: A Delicate Balancing Act
The coming months will be critical for emerging markets. Central banks face a delicate balancing act, trying to tame inflation without stifling economic growth. The strength of the US dollar will be a major factor influencing their decisions. The ability of emerging markets to navigate this challenging environment will have a significant impact on the global economic outlook.

#DXY #dollar index chart looks bullish#DXY is preparing for next step of moving up and this bullishness will bring more volatility. Bad for #crypto #btc #commodities #stocks etc. Hard price declination will be the invalidation. Not financial advice.

Time for US Dollar to cool off !The US Dollar Index is showing a bearish chart pattern after having made a strong rally since the beginning of 2021. We are now seeing a correction that will most probably end in some kind of consolidation, which should take it down near the 100 mark. In the meantime, the EUR and GBP are booking some gains against the greenback!

Dollar UP again.Dólar is going to keep risig for the next few months. I Guess untill end of May, brginning of June, surpassing the pprevious hight of 2023, but bellow the high of 2022. I dont ecpect to see GOLD to rise as it did in previous weeks with the dollar. I exepect the opposte: A correction of 8 weeks os so in gold back to 2100 -2150.

DXY (DOLLAR INDEX)The dollar index pair broke the resistance level of 1.04500 and closed the candle body above the 1.0500 level. the market gives some retracement at the 1.04500 level and further goes upward at the 1.0700 level which is a strong resistance level.

Analysis of the dollar index in the monthly time frameIn my opinion, the correction of the dollar has been completed and this index has started moving to break the level of 121 by completing the money back with the local support of the rand number 100, and this is a warning for other markets.
"Beta version whale"

Why both Gold & U.S. Dollar Index are rising ? (IMPORTANT)The Intricate Dance of Gold and the U.S. Dollar
The relationship between the U.S. Dollar Index (DXY) and Gold prices is a fascinating study in economics. Typically, these two have a reverse correlation. The reason for this inverse relationship is that gold is priced in U.S. dollars. Therefore, when the dollar strengthens, gold becomes more expensive for investors using other currencies. This can decrease demand for gold and subsequently lower its price.
However, this correlation is not set in stone. There are times when both the DXY and gold prices can increase simultaneously. This can occur due to a variety of factors such as geopolitical tensions, market uncertainty, or changes in monetary policy.
For instance, from early 2022 to the beginning of 2024, the correlation between gold and the DXY has seen periods of both synchronicity and divergence. This indicates that other factors are influencing gold prices.
Currently, despite the rising DXY, gold prices are also on an upward trend. This could be attributed to investors seeking safe-haven assets amidst economic or geopolitical uncertainty. This increases the demand for gold, driving up its price even as the dollar strengthens. Additionally, expectations of changes in monetary policy, such as interest rate cuts, can also affect gold prices.
In conclusion, while the DXY and gold prices often move in opposite directions, there are times when they dance to the same tune. This intricate dance is influenced by a myriad of factors, making the relationship between the DXY and gold prices a complex and intriguing aspect of global economics.
Prepared by : Arman Shaban

DXY is overbought, maybe a little corrections?(4/12/2024)In our last analysis, the DXY TVC:DXY moved as we had anticipated. Right now the bullish scenario is dominant, but DXY is overbought and hit a resistance.
So there is a chance that price make some retracement.
Our technical view has been shown in the chart.
If you like it then Support us by Like, Following, and Sharing.
Thanks For Reading
Team Fortuna
-RC
(Disclaimer: Published ideas and other Contents on this page are for educational purposes and do not include a financial recommendation. Trading is Risky, so before any action do your research.)

DXY - Resistance Becomes Support 📈Hello Traders !
Yesterday, The Dollar Index Broke The Resistance Level (104.976 - 104.810).
This Resistance Level Becomes a New Support Level !
So, I Expect a Bullish Move 📈.
----------
TARGET: 105.770🎯
Previous Analysis:

DXY Update - 12/04/2024As of daily chart, DXY is showing bullish momentum and next resistance will be around 107.

Dollar Index (DXY): Multiple Time Frame Analysis & Plan 💵
After a breakout of a key daily structure resistance yesterday,
Dollar Index is consolidating within a horizontal range on an hourly time frame.
For those, who are looking for an intraday signal to buy,
a bullish violation of the resistance of the range -
an hourly candle close above 105.32, will give a strong bullish confirmation.
A bullish continuation will be expected at least to 105.6 level then.
❤️Please, support my work with like, thank you!❤️

N1DAILY
Just watch, the current sideways movement has me in a daze, previous similar price dropped and melted.
4H
Let it move more before any judgements. Rejection of price from 18200 and candles direct us to look for sells.
1H
17900, our target price. Just waiting for entry prerequisites.
15Min
The impulsive bear candle just gave us the first confirmation wait for 2 more before even attempting to enter.

GBPUSD Weekly Outlook: Analyzing Potential Trends and IdeasIn this video, I'll conduct a comprehensive analysis of GBPUSD , examining it from a High Timeframe (HTF) perspective down to our Low Timeframes (LTF) . This approach will provide insights into what to expect in trading for the upcoming week.
Additionally, I'll delve into an analysis of the DXY to further enhance our understanding of market dynamics. Stay tuned for valuable insights and strategies.
Kind Regards,
The_Architect

🚨DXY Index Is Ready to Go Down by H&S Pattern🚨🏃♂️ DXY index is moving near 🔴 Heavy Resistance zone($105.88-$104.65) 🔴.
📈In terms of Classical Technical Analysis , the DXY index has succeeded in forming an Ascending Broadening Wedge Pattern and is currently completing the right shoulder of the Head and Shoulders Pattern .
💡Also, the Regular Divergence (RD-) between the right and left shoulders of the H&S Pattern is clearly visible.
🔔I expect the DXY index to continue its decline after breaking the 🟢 Support zone($104.26-$103.88) 🟢 around $103 .
U.S.Dollar Currency Index ( DXYUSD ) Analyze, 4-hour time frame⏰.
Do not forget to put Stop loss for your positions (For every position you want to open).
Please follow your strategy; this is just my Idea, and I will gladly see your ideas in this post.
Please do not forget the ✅' like '✅ button 🙏😊 & Share it with your friends; thanks, and Trade safe.
