What's is going on with the DollarDollar just hit an important and historic resistance area. I really don't think we are going to see a break up any time soon. We may see a false break up, so be careful with any bulls trap that this market loves to play out all the time (I fell in its traps many times). I think it'd need more consolidation for a break out, this appears to be just a rally. Let me know what you think.
Dollarindex

Until DXY beats this price, this is just a bear flag!Traders,
The dollar continues its journey down. So, is my H&S pattern still intact? Well, on the weekly it is. Does that count? I think so.
It's not like the dollar has turned the corner here and growing stronger. We are still very much in a downtrend. Even that right shoulder is still valid. And, like I said, on a weekly chart that neckline still holds. Once broken, the dollar is in trouble.
What would invalidate my H&S pattern? Well, if the dollar beats that 50 day moving average and then proceeds to move up and above that 103.53 level with confirmation, I might be wrong and would have to re-evaluate at that point. Until this time, the DXY has formed a classic bear flag and I expect weakness to continue. The weaker the dollar, the more dollars it takes to buy a thing. The more dollars it takes to buy a thing, the higher the prices will go to reflect what is needed. This includes stocks.
Stay tuned as we keep our eyes on this unfolding event.
Stew

Bullish Dollar = Bearish EquityThe title said it all!
I am expecting a bullish Dollar which will make everything else bearish.
Look out for confirmation....

Sell the DollarConfirmation
• Buy-side liquidity taken out.
• Break in Market structure.
Entry
• At Fair Value Gap
Target
• Below 101.910
Good luck.Trade responsibly.

USDCAD Will Rise!USDCAD will further push to the upside after taking the BSL 1.32339 to a possible rise to 1.33044

DXY update in lower timeframehello dear trader
The chart specifies everything
institutional price action ...
stop loss need for any position
good luck
mehdi

US Dollar Index Growing bullish US Dollar growing bullish and the level marked the structure of the market will be in bullish channel so the level marked, us index moved in these channel to gain strength the major pairs including Gold will be bearish, 102.321 is the key level for reversal when its breaks then market will go ahead as per channel.

Potential Rise on DXYdxy shows a strong bullish momentum candle, there is possibly for a potential rise after dxy takes out the BSL in to the demand zone with engulfing pattern expect further rise in to 102.214 zone

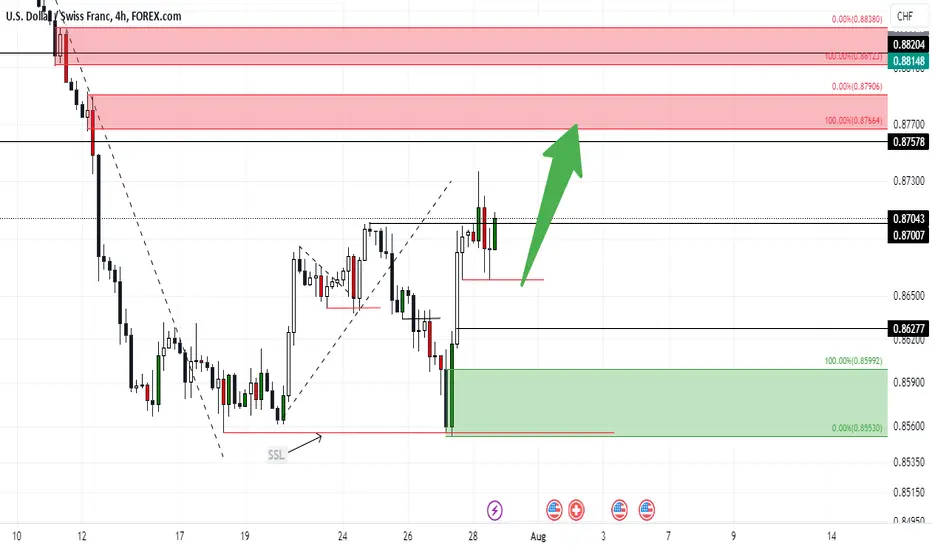
USDCHF potential BUYUSDCHF indicate a possible potential buy by indicating a bullish momentum candle, USDCHF will riseto 0.87578
DXY- BERRISH MOMENTUM Trade Idea: DXY Signal
📍 Entry: 🎯 Target: ⛔ Stop Loss: (MARKED IN CHART)
💡 RISK REWARD 1 : 2.5
💰 Risk 1% of your trading capital.
⚠️ Markets can be unpredictable; research before trading.Disclaimer: This trade idea is based on Elliott Wave analysis and is for informational purposes only. Trading involves risks; seek professional advice before making any financial decisions.Informational only! Consult a pro financial advisor

📈DXY daily chart pattern📉TVC:DXY
CAPITALCOM:DXY
⚡These two scenarios are expected to occur in the dollar index. A break or resistance of the 103.285 level is very important to determine the continuation of the trend.
Please share ideas and leave a comment,
let me know what's your idea.
CrazyS✌

Dollar Index (DXY): Important Key Levels to Watch This Week 💵
Here is my latest structure analysis for Dollar Index.
Resistance 1: 101.70 - 102.05 area
Resistance 2: 103.35 - 103.58 area
Support 1: 100.55 - 100.70 area
Support 2: 99.58 - 99.78 area
Consider these structures for pullback/breakout trading.
❤️Please, support my work with like, thank you!❤️

DXY (Dollar index): 31/07/2023: Possible scenariosHello traders.
As you can see, the price had a bullish reaction after touching the weekly support.
There is a clean FVG above the price that is a high possibility to be filled. Then we can expect another bearish move.
Please pay attention to the details.
feel free to ask questions.
💡Wait for the update!
🗓️31/07/2023
🔎 DYOR
💌It is my honor to share your comments with me💌

DXY Reversal Anticipation - Short BiasDXY reversal outlook. I believe DXY is still going to go lower.
Possibly another thrust up before the reversal. A new month is about to start so I will be anticipating the monthly Power of 3.
The bias for lower DXY is COT reports of Intermarket assets and the lowest point of DXY falling short of the Weekly FVG. This rally could just be inducing liquidity. There is trendline buyside liquidity way up, but I would be quite surprised if it gained that much strength. If it did, probably a Black Swan liquidity sweep.
The first reversal point could deeper into the Daily FVG that it tapped into, into an old NDOG.
The second reversal point could be at a Weekly Mitigation Block with a lower timeframe Order Block, at or near the 70.5% OTE level.
The third reversal point could be at the highest Daily FVG after taking out an intermediate high.
This is all anticipation. Always wait for confirmation, and always be ok with not being right in your analysis. As ICT says, you can be right in your analysis and still be unprofitable, and be wrong in your analysis and still be profitable. We are here to make money.

$DXY -Middle Range Warzone (105vs100)- TVC:DXY seems to be wanting a break-out from Resistance Trendline
coming from 114 Highs, despite failing to do so.
A Resistance Trendline that has pushed the price lower each time price has approached it.
Wether that break-out and resumption is bound to happen or not in the short term,
it is yet to be seen.
Currently, TVC:DXY is in the midst of a Middle Range War-Zone, struggling for direction.
For now, Price-Action suggest a Lower High being printed
at 104.5 , a Lower High from 114 Downtrend.
By Breaking Structure(BoS) of the most recent Lower High (LH) 104.5
would validate the Trendline break-out and suggest
furthermore uptrend continuation for TVC:DXY ,
headed for the the Range's Ceiling at 105.8 and testing the broken
macro structure Support Trendline
Move towards 105.8 range's ceiling would be quite bearish for overall Financial Market's
condition.
While a move to the range's bottom at 100 level would be quite promising for other Market Sectors
to continue performing well.
Very interesting week ahead for The Markets, especially TVC:DXY ,
which dictates Financial Markets Swings
*** TRADE SAFE
NOTE that this is not Financial Advice .
Please do your own Research before partaking on any Trading Activities
based solely on this Idea.

Dollar index sell h4 The index is selling in the medium term, but you should pay attention to related news

Dollar Index (DXY) Detailed Technical Outlook (Top-Down) 💵
Multiple time frame analysis for Dollar Index.
Price action & key levels.
Trading plan.
❤️Please, support my work with like, thank you!❤️

DXY road map for forex trading hi dear trader
i set alert on this price action level
my opinion is sell on dollar curency index ... i think we are in the End of contraction cycle ...
good luck

The dollar looks bullishI really don't think the dollar is going lower here. We've largely been moving sideway for the past 6 months consolidating.
You'll see on the chart that price action in January fell below key support. Then after that we rallied and tested the 200 DMA 3 times and have also retested support 3 times and haven't broken through. Now that price action is well above support, I think the next big move is up through the 200DMA.
The only way the dollar is going lower is if it breaks that key support. And I think we need to see a higher dollar before that support is broken.
I bought a lot of $30 UUP calls for September to express this view.


Dollar Index (DXY): Detailed Technical Analysis 💸
Top-down analysis for Dollar Index.
Daily/4h outlook.
Price action.
Key levels.
Scenarios & thoughts.
❤️Please, support this video with like and comment!❤️

DXY LONG PROJECTIONThe DXY (Dollar Index) recently experienced a false breakout below the daily support level. However, the price quickly reversed and re-entered the support area, signaling a potential accumulation of buying pressure. As a result, there has been a retracement back towards the buying zone. Anticipating a bullish scenario, we expect the DXY to rally upwards, targeting the formation of a trend line.

BluetonaFX - DXY US Dollar Fragile After FOMCHi Traders!
The US dollar is showing signs of fragility after the expected 25 basis point interest rate hike from the Federal Reserve and the FOMC press conference today due to the ongoing high inflation issues in the US economy.
This was reflected in the price action on the DXY 1D chart. The market hit the 50% Fibonacci retracement level at 101.590 to continue the bearish impulsive wave, and the US dollar index might continue down and go back under the 100 level to target the support level at 99.578.
There is further data out of the US tomorrow, and if we get further bad news from the US tomorrow, we might possibly get the break below 100.
Please do not forget to like, comment, and follow, as your support greatly helps.
We appreciate your support.
BluetonaFX
