Dollars

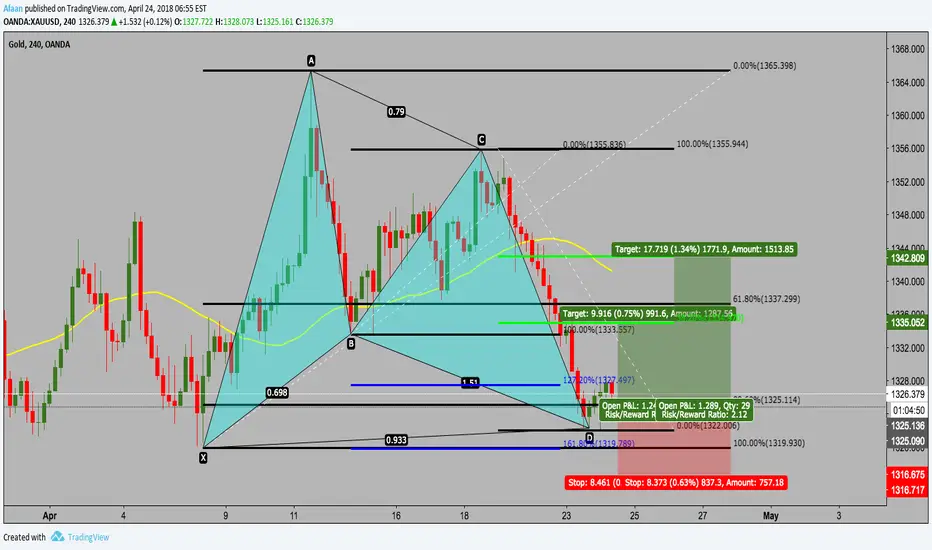
GOLD - BULL EntryBullish Gartley on Gold
TP and SL on the charts
Let me know what your thoughts are on this commodity.
Thanks
ETHUSD: Short: 550-320 5th WaveLots going on in ETHUSD now, some great strong trend lines and patterns developing as we move into what is assumed as the 4th wave of this 5 wave movement downwards...
Strong Support, Resistance and Fib Correlation
Firstly, note how both the 23.6 and 38.2 fib lines provided traces for both support and resistance as the second wave moved from (1) to (2). By tracing this movement onto the current wave 4 which runs from (3) to (4)e, we see an almost identical trend forming at this early stage. Interestingly the peak from (0) to the low at (3) formed its own support and resistance, giving two vectors or reference for a possible price movement, and this has also been applied as an assumption for wave 4.
Volume Spikes
Another great indicator to test the buy in will be the clear volume spikes that have taken place at both (1) and (3) which are circled in blue. This should act as good confirmation of a buy zone at (5), although beware the bull trap circled in red - indicator will be multiple high volume exchanges rather than just a singular spike before a continuation down.
Price Scenarios
S1 and S2 provide two different scenarios for the peak of wave 4 - considering the amount of volume exiting the market and the fact we may not see anything close flood back in over the next few days, although we would expect to reach S1 @ 1100, it may be the resistance at fib line 38.2 is strong enough to hold the price until buy pressure falters. If this is the case, we would see a double peak around S2 @ 890, before a strong movement down to confirm.
T1 and T2 are therefore some provisional targets once the final wave has taken effect. I would expect some strong support at the 61.8 fib line and therefore a scenario of T1 @550 being a possibility. However, considering market conditions again with weak volume ratios, we could be looking at a similar trend of (2) to (3) where a slight bull trap could form before a continuation down to T2 @320.
Assumption: Short
Considering the current volume mix, with significant volume leaving the market causing compressed correction waves across almost all coins at this stage, a conservative estimate would suggest a move to S2 (890) followed by a move to T2 (320) in line with the 78.6 fib level.
-------------------------------------------------------------------------
Opinion not advice
Comments welcome - 1B2rBfu9X4nms6EtuQWDQuNy87Jn9hYkJs for BTC donations if you find this helps, and want to share the love!

BAT/BTC () C&H and fundamental. Huge Profits.Fundamental is in the graphic. We are seeing here a typical C&H , with low volume while it was being formed (something that confirms it).
The raise has been calculated and the sell zone is safe. DATA:
BUY ZONE : Btw 4.5k & 6.5k
SELL ZONE : Btw 9.1k & 10.6k
STOP LOSS : 4k
Mid-Long term invest, expect reaching the target in a month (from now on: 15/1)
# Follow me if you want to see more ideas! See my succes ratio, and please dont forget to leave a like if you agree! Good luck in your invests.

Long position for SBD BTC [Steem Dollars] ~ [48% profit]There is a possibility for having same pattern like in history of SBD. Currently it is right time to buy at Fibo level 0.382 . But put your stop loss at 0.236 Fibonacci level. If the price of SBD take a surge it will go for the last high point . You can take profit at 0.786 fibonacci level which would be pretty safe . If you want to hold then its upon your choice.

DGB/BTC possible price raiseThere is not much to describe. DGB is an excellent coin; it's cheap at the moment in BITTREX:DGBBTC , with enormous potential. Maybe at the 31th of december (DGB Foundation) it prices blows up, or maybe we will see it raise in 2018, but it will raise for sure .
There is a symmetric triangle formed, which indicate us a possible raise, because DGB is on a bull trend. I have set 2 targets, according to some very strong resistances this coin has. I dont have so many faith in the second target, but it's possible. I hope this increase in the price happens in the next two weeks from now (30/12/17).
Good luck on your invests . Like if you agree!

THE FUTURE OF US DOLLARS -NO THEORY US DOLLAR NEWS-TradingViewIt is so easy to come up with profligacy or a bogus theories of what triggers dollars up moves : Hurricane Harvey = equals compassion, N. Korea's missiles launching gimmicks = weakness... oil plants evacuations influence = equals oil down - dollar up, Arabs on Holiday = equals oil weakness etc BUT! I wont discuss any theory to back up my chart - my apologies! I am giving you an assignment to figure out my chart, and if you trade it? you will thank me later.
Enjoy!

NZDUSD daily chart 0.7280 short for a swing/long timeA daily chart setup for a short swing/long trade.= enter at 0.7280 ( if you are not in the trade so calcul your RR for see if you can enter in)
SL between 0.73200 and 0.73550 at the end my target is the cluster around 0.7070 between daily uptrend line and h4 downtrend line that he broke up the 21july .
Dollars it seem to regain Power with hawkish Fomc and Yellen and its normal
Last data like trade balance are soft or bad
I dont thing RBNZ will Hike rate this year and i dont think will have a big bullish speech
Trade will be cancelled only if RBNZ hike rate by surprise or a suprise bullish speech
Also i am short wih AUDUSD for many reasons
also we have SL and our RR is not BAD

A view of dxy H4 breakout confirmed ?i think the break out is confirmed on the DXY
because he brak out the long tie tdowntrenline since almosst high 2016 then after technically he do the pullback on this t-line and bounce on sharply.
so we can say for short and middle time the dollars is back in da place
first target easy at 94.05
me i entry on since friday and i have a traling stop now.
he can go more up than 94.05 but this will dependt on ISM,PMi and nonfarm payroll this week
so the Yellen-Fomc speech start to do them effect

AUD/USD breaks to downsideThe Australian Dollar has broken out of the short term triangle pattern to the downside against the US Dollar. Due to that reason a full review of the situation on the pair’s charts has been done.
First of all it can be noted that the breakout to the downside could have been forecasted by examining the large scale situation and identifying a large scale ascending channel pattern. It is expected that a new medium term decline is about to occur. The next target for the pair would be the support cluster near the 0.7880 mark. However, before it will be reached the currency pair will face the various support levels below it.


AUDUSDNow in Zone if it break the trend than it will go Higher High
Expected 0.76500 if trend Break up side.

WTI Longs get in!!WTI looking good for a high probability trade.
Look for lower time frame confirmation (Double Bottoms/Pinbars/Inverse H&S) for entry.
A daily candle close above the 200MA will be great confirmation to ride this to the previous structure high of 52.73.
Let me know what you think.
Goodluck


Dollar Index Bullish SetupThe dollar index made a nice bounce back up from the lower green range. The Stoch Rsi indicator shows a possible bullish crossover and the Adx indicator shows a very weak bearish trend meaning that its more then likely the bulls will take over.
Because of this I see the dollar gaining some strenght this week and the dollar index attacking and breaking 100. It's most likely that this will be fueled alot by the Usd gaininst most of its strenght against the Cad and Jpy (see my Jpy chart).
If you're less bullish than I am on the Dollar then you should wait till the lower range breaks (around 99.40) and then sell the Usd


4h Timeframe + Monero + Swing = Profit.No need to explain, its just one of scenario possible in this coin.
Entry: 0.0128 Margin Long
Exit: 0.0148 then Shorting.

EURUSD: Harmoinc Pattern for LongAfter the ECB conference, the EURUSD pair dropped after reaching last week gap. I am looking for more upside unless price pass previous lows.


