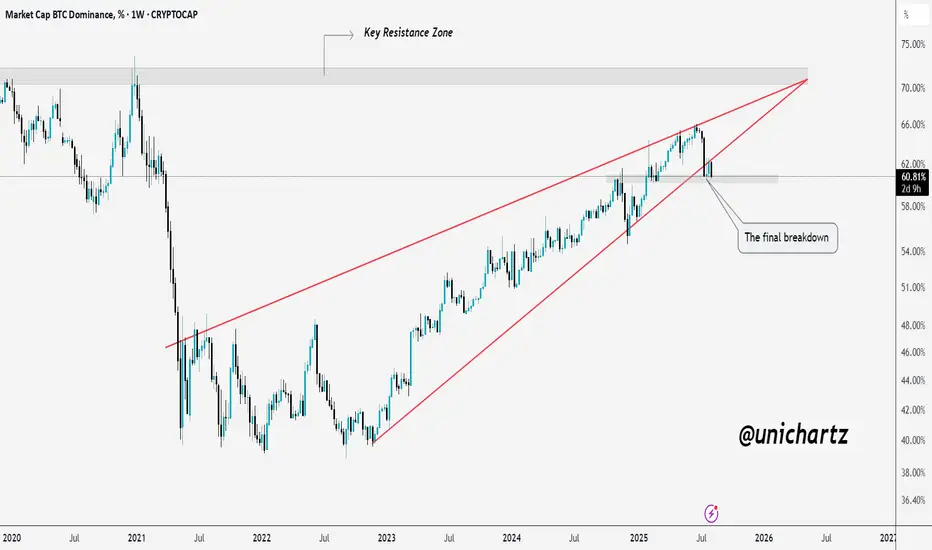
Altcoin Bulls Watching This Retest CloselyBTC Dominance has cleanly retested the breakdown from its rising wedge pattern after failing to break the key resistance zone.
This retest is a critical point if sellers maintain control here, dominance could trend lower toward the next support range, potentially sparking an altcoin relief rally.
However, a reclaim above this breakdown zone would invalidate the bearish setup and shift momentum back in Bitcoin’s favor.
DYOR, NFA
Dominanceupdate
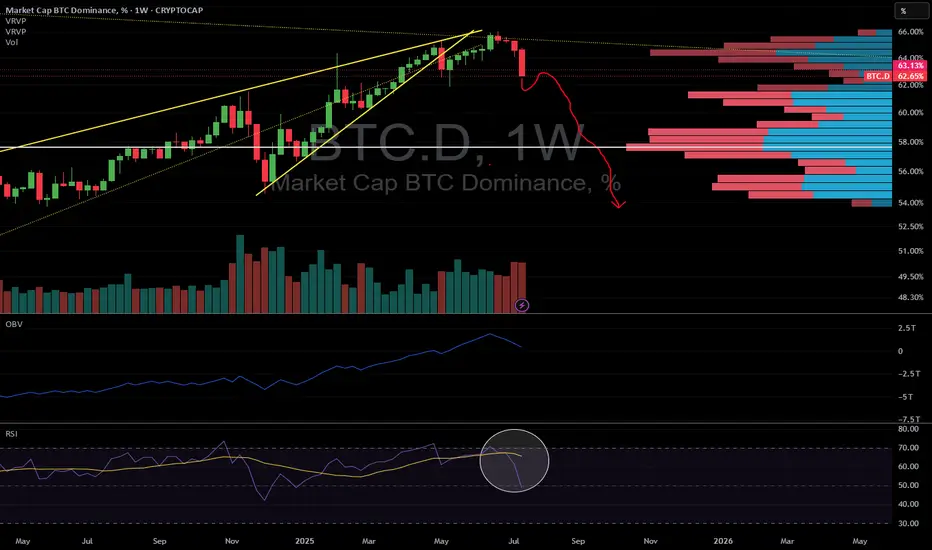
Dominance breaking down signals Altseason is here !!There is no doubt in my mind that an Altseason is now in progress !
The May2025 low has been taken out.
Now things will start accelerating.
We could have a backtest of the resistance at 63.13 % (dotted fuxia line).
But we also could not !!
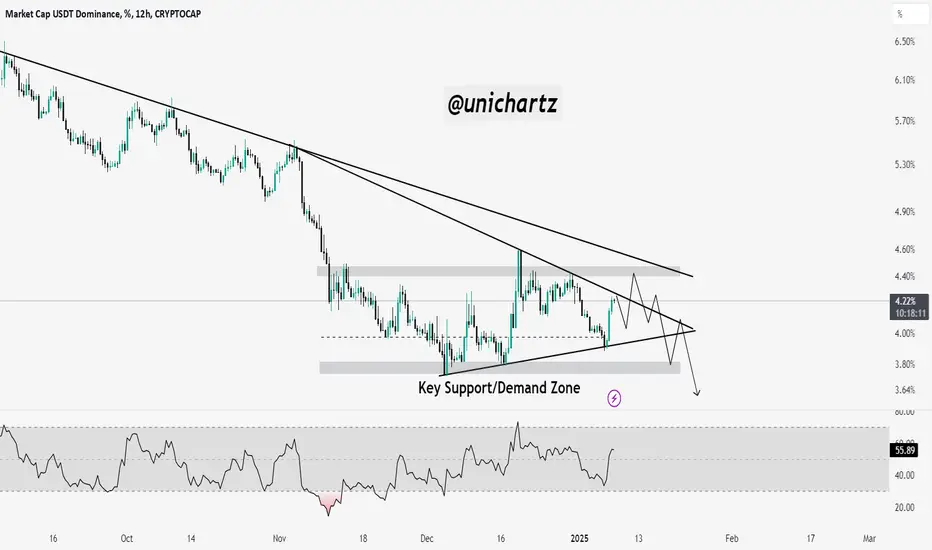
USDT.D Forecast: Time to Buy the Dip?#USDT DOMINANCE
This is what I’d like to see happen in the next 2 days.
And I believe it will. Invalidation would be a close above 4.80%.
I’m buying the dip, guys. Let’s see how this plays out.

Btc DominanceDisclaimer 👉 This is my personal analysis for educational purposes , Buy/Sell/Trade at your own risk. I am not a financial Advisor

Altcoinseason is around the corner, get ready. Hi fellow traders, BTC.D will be ready to make a wave lower from the blue box after it completes the ABC correction. When the dominance of BTC starts to decline the Altcoins will rise. The BTC.D chart could potentially go up till the green fib line within the blue box. I think this will be a good time to position yourself. Target will be the previous bottom. Good luck and trade safe!

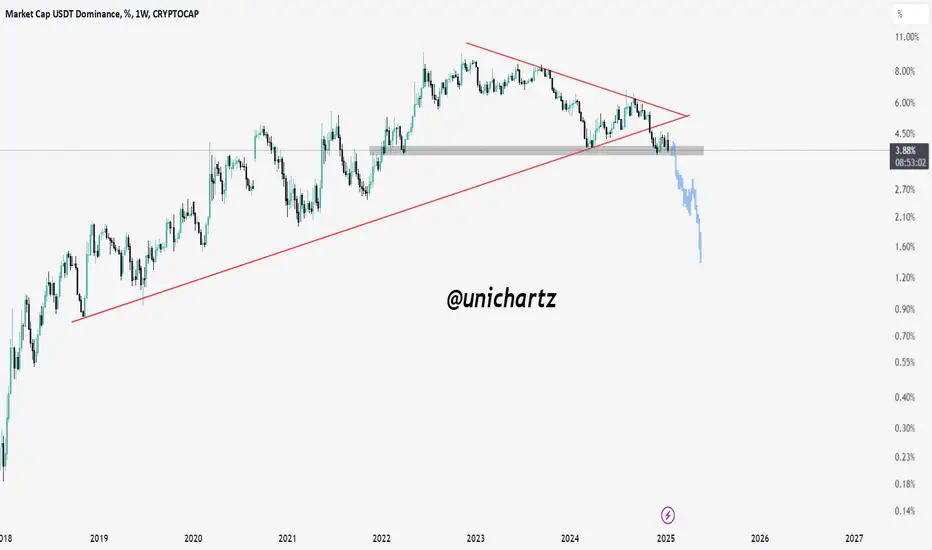
USDT Dominance Breakdown = Crypto Rally?USDT dominance has broken a long-term trendline and is now testing a critical support zone around 4.0%. If it drops below 3.8%, we could see a strong shift towards a risk-on environment, fueling a major rally in Bitcoin and altcoins.
However, if this level holds, we might see temporary consolidation before the next move. Historically, a decline in USDT dominance signals capital rotation into crypto, increasing the chances of an altseason breakout.
The coming days are crucial—watch this level closely!
Thank You!

DOMINANCE - retesting almost done!The market is experiencing a terrifyingly bearish phase, and the start of the week is concerning. However, everything will be fine soon.
We can see this through the dominance chart.
On the weekly timeframe, the pattern has broken downward, and a retest is now in progress.
This current pressure on altcoins aligns with the dominance chart retesting its breakdown.
It’s expected that dominance could rise to a maximum of 61% before altcoins break free from this nightmare and finally deliver the long-awaited profits.
Personally, I’m still holding onto my altcoins and strongly advise against selling. Everything will improve in the coming weeks.
Altcoins are currently at bargain lows that are worth buying.
Best regards Ceciliones🎯

USDT.D at Key Support: Will Altseason Ignite?USDT.D Weekly Analysis:
Key Zone: USDT.D is trading at a critical support zone, with a successful retest of the broken trendline confirming bearish momentum.
Bearish Potential: A breakdown could lead to a 48% drop in dominance, paving the way for an altseason as funds rotate out of stablecoins.
Bullish Risk: If the support holds, bearish momentum could stall, delaying the altcoin rally.

USDT.D Retests Breakdown: Is a Strong Altcoin Rally Ahead?USDT Dominance (USDT.D) has broken below its rising trendline and is trading at a key support zone after a successful retest of the breakdown. A break below this support could trigger a sharp decline, signaling capital rotation into altcoins.
This setup aligns with the potential for a strong altcoin season and an active trading period ahead.
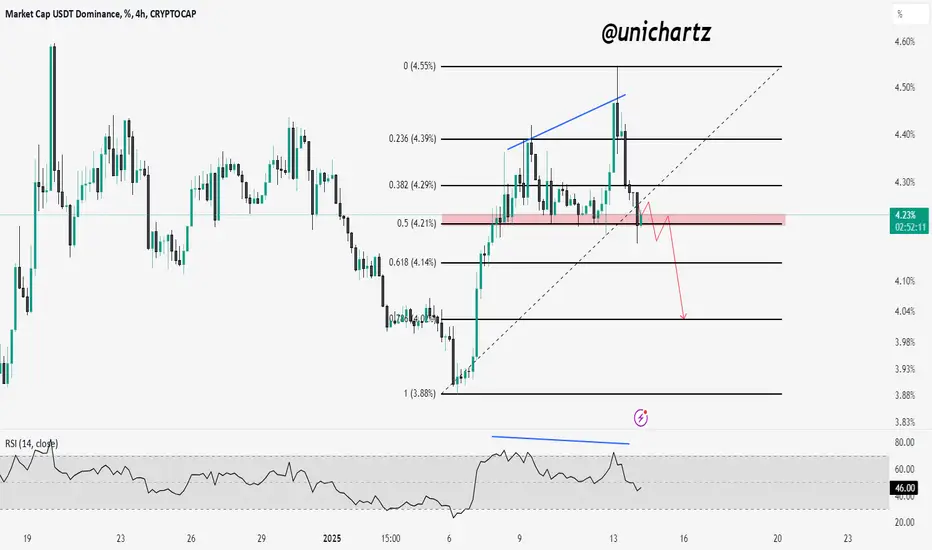
USDT.D at Key Support: Altcoin Bull Rally Ahead?USDT.D has repeatedly bounced off the marked red support zone, a strong Fibonacci level at 0.5. This support has been tested multiple times, and based on my experience, I anticipate USDT.D may break below this zone. If it does, it could trigger a bullish rally in altcoins.
I believe this is the final shakeout phase, so stay strong and focus on accumulating fundamentally solid coins. Remember to maintain discipline and practice strong money management.
USDT Dominance Rises: A Warning for Long Positions on AltsStay cautious with your long positions as USDT Dominance (USDT.D) is gaining strength, which is a bearish signal for altcoins

USDT Dominance Approaching Key Resistance – A Breakout or RejectA breakout above 4.40% could suggest a bearish shift for altcoins as funds move into stablecoins.
However, rejection at this level may lead to another test of the 4.00% support, which could boost altcoin performance.
Traders should watch for volume confirmation and RSI behavior for clearer direction.
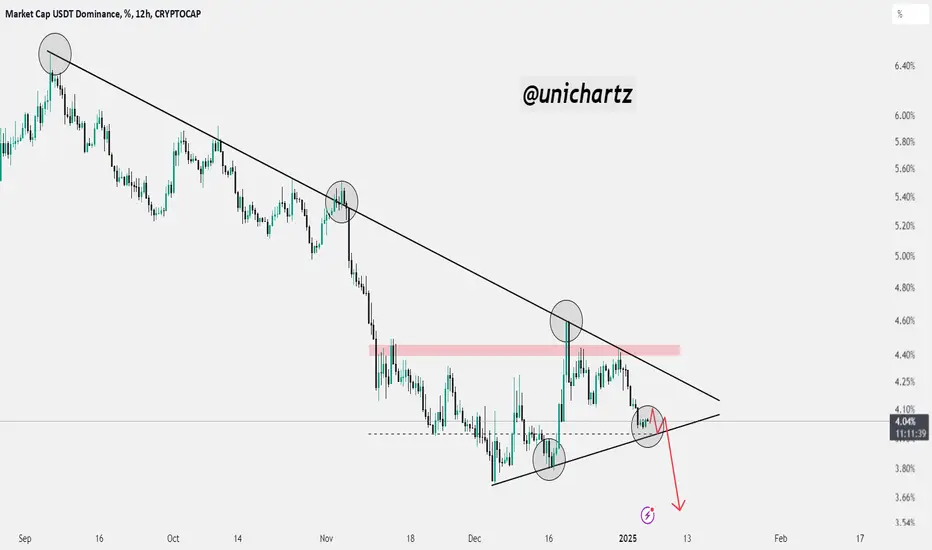
USDT Dominance at Make-or-Break Zone – Watch for Altcoin Moves!The chart shows a clear descending triangle pattern in the USDT dominance (USDT.D), with the dominance steadily declining and forming lower highs along a downward trendline.
This indicates weakening demand for stablecoins, which often correlates with increased risk appetite in the market as investors shift their funds from stablecoins to altcoins.
#USDT Dominance: Don't FOMO! Here's Why!A rejection on the daily chart has led to a strong performance in altcoins, while BTC is steadily approaching the $100K zone, currently sitting at $98K. A break below the blue EMA, which is being tested now, could result in further continuation.
However, a bounce might mark the end of this Christmas rally.
For those experiencing FOMO, it’s better to hold on and wait. Of course, you’re free to make your own decisions, but in my opinion, patience is the best approach.
I hope you're enjoying the holidays!
Make sure to reduce screen time and spend quality moments with your family and friends.
Stay tuned for more updates!
Do hit that like button if you found my updates helpful in any way.
Thank you
#PEACE

USDT Dominance Breakdown Ahead?USDT Dominance (USDT.D) has formed a bearish inverted cup and handle pattern, pointing to a big move soon!
The weekly chart of USDT dominance shows a clear bearish inverted cup and handle pattern, with a significant breakdown below the neckline. The projected target suggests a potential 60% decline, which could take the dominance to the 1.6-2% range.
This might indicate a shift in market dynamics, with capital rotating from stablecoins into altcoins or Bitcoin. A key moment to watch for crypto traders.
What’s your take on this? Could this spark an altcoin rally?

USDT Dominance Raises Caution: Time to Stay Patient in Crypto?USDT dominance is looking quite concerning right now!
It might be wiser to stay patient and wait for clearer signals before moving.
#Crypto

Dominance Breakout Done: Altseason Incoming!🚨 Bitcoin Dominance Rising Wedge Breakout Confirmed ✅
The stage is set—are you ready for the upcoming #ALTSEASON 🚀
Get your altcoin watchlist ready, because the market is primed for explosive moves.
Don't miss out on the action—follow me!

Altcoin Alert: Dominance Rising or Relief Ahead?#Dominance trending inside a rising channel!
A breakdown of below the channel support could signal relief for altcoins. However, if support holds, we may see further pressure on altcoins as dominance rises.
Keep an eye on the breakdown👀

USDT.DOMINANCE CHART UPDATE !! USDT Dominance (USDT.D) confirms the breakdown of the head and shoulders pattern, indicating a strong bearish trend. Here's a detailed log analysis:
The neckline support has been breached, confirming the pattern's validity.
The measured move suggests a target towards the 1.80%-2.00% zone, aligning with historical support.
There is a significant breakdown below the Ichimoku Cloud, with volume likely supporting the move.
This reinforces a bearish outlook, signaling a shift of capital away from stablecoins.
As USDT Dominance decreases, funds flow into risk assets, typically Bitcoin and altcoins.
This aligns with a bullish sentiment in the broader crypto market.
Resistance: 4.50%-4.80% (previous neckline and Ichimoku Cloud).
Support: 1.80%-2.00% (highlighted shaded area on the chart).
The pattern's implications suggest further downside for USDT Dominance, which could be a tailwind for crypto market growth. A breakdown continuation is likely unless dominance reclaims the neckline area.
Disclaimer: This analysis is for informational purposes and is not financial advice. Always stay updated with market movements and adjust your trading strategies as needed.
You can DM us for information on any other coin.
@Peter_CSAdmin

#DOMINANCE IS AT DO OR DIE CONDITION!#Dominance Currently at resistance, if it gets rejected, then we may see a relief in BTC and ALTS.
But in case a breakout could cause problems for both BTC and ALTS.
Be careful, and remember to set stop-loss orders!
#Crypto

Updating Channel for my Pervious Idea USDT.D + USDC.D I have updated my idea about CRYPTOCAP:USDT.D & CRYPTOCAP:USDC.D ...
We still didn't breakdown this bullish channel....
***Dollar's Dominance is opposite of CRYPTOCAP:BTC which means if USDT & USDC's dominance are up BTC will be down.***
Check it below in related ideas
Good luck

Bearish Trend and Key LevelsObserving Bitcoin dominance on a 4-hour timeframe, we are witnessing a bearish trend. The next key support level to consider is 53.
Bitcoin dominance has so far reacted to this level, but the overall trend seems to be downward. A trend reversal, indicated by a Market Trend Reversal (MTR) - marked by reclaiming its previous high - would signal the end of the bearish trend.
However, until we see such a change, a further decline in Bitcoin dominance is more probable.

#DOMINANCE AT DO OR DIE CONDITION!DAILY TIME-FRAME UPDATE FOR #DOMINANCE
As shown in the graphic, dominance is creating two patterns, one of which is a rising channel pattern and the other a symmetrical triangular pattern.
Dominance is up against the 300D strong resistance, so ideally we can anticipate a rejection from here. However, if dominance breaks this level, it will rebound to the channel's upper level, or about 8.77%.
We have support from 8% to 7.80% and 7.50%.
Disclaimer: This analysis is not financial advice. Trading cryptocurrencies involves risk, and past performance is not indicative of future results. Always conduct your research and consult with a professional advisor before making investment decisions.
Follow us for More Quality Analysis.
