Tariff Pause = Crypto Pump?USDT Dominance is testing strong resistance (5.60%–5.80%) while holding a rising support line. A break below 5.40% could signal a shift to risk-on sentiment, triggering a move into Bitcoin and altcoins.
Trump’s 90-day tariff pause may further boost market confidence, reduce demand for stablecoins, and support crypto inflows. If dominance breaks down, it could spark an altcoin rally. If it holds above 5.80%, caution remains. This is a key turning point.
Dominanceusdt

USDT dominance. (USDC is similar). 03 2025Time frame 1 week. Crypto market dominance to % USDT. I showed this for the first time on 03 2022, nothing has changed since then, everything is the same and the logic is identical.
USDT dominance. USDT pumping indicator to the market 03 2022
USDT dominance. Indicator of USDT pumping to and from the market 05 2022
✔️Stablecoin dominance is falling — the market is growing.
✔️Stablecoin dominance is growing — the market is falling.
It cannot be otherwise (capital movement), until the time when ETFs with the US dollar are not massively introduced and popular, they will draw some of the liquidity to themselves. Which will slightly change the logic of this trend itself. Comparable, in terms of impact on the market, as before the introduction of trading pairs to alts/USDT instead of BTC/alts (everyone was like that). Until then, USDT was needed.
You need to understand that the main " transitional dollar for the people ", that is, USDT , - reflects the trend of all stablecoins. In particular, the main "competitor" - USDC, all the others (a temporary phenomenon) do not matter. Until USDT exists and can be used to track the direction of the money flow, that is, the direction of the cryptocurrency market.
In 2022 09, I also showed this game of liquidity flow into ideas with the combined dominance of USDC + USDT + BTC chart. But this is already a complication, everything is already visible and clear on the dominance of USDT.
Domination of USDT + USDC and lows/maxims of BTC. Correlation 2022 09
Remember, any stablecoin is an alt. The experience with UST (Moon Falling into an Urn) has taught many not to equate stablecoins to a real dollar.
The price stability of any stablecoin depends only on people's faith in its stability. This faith is projected by marketing activity, and first of all by the real capital that stands behind the creators. Everything conceived and implemented has a beginning and an end.
Bitcoin dominance to alts.
I will duplicate my latest idea on Bitcoin dominance here once again. I used it before (it was rational), before 2020 (I used to make a lot of ideas about local zones as triggers for market reversals). Now it doesn't do much. But I see people are fixated on this, not understanding the essence, and why it was so effective before and childishly clear when the market would be reversed (there were no pairs to USDT, but only alts to BTC).
Before 2018 (100% efficiency), before 2020 (partial), the dominance of Bitcoin to other alts was such an indicator of the pump/dump of the market. As it was the main direction of money flow. Almost all alts were traded only to Bitcoin.
Доминация BTC к альткоинам. Доминация стейблкоинов и памп рынка. 07 2022
Have a plan and understand what you are doing, observing money and risk management. As a result, you will be calm and satisfied with your profit from the market, if you are an adequate person.
Alt dominance.
And this is the idea of training/work (understanding the reversal zones of the crypto market of secondary trends) in 2023 on alts. That is, the dominance of alts without stablecoins, bitcoin and ether, which take away most of the market capitalization as a whole. The dominance is growing, naturally money is pouring into alta and vice versa. There are also similar ideas (look for publications in 2023) for certain groups of assets. That is, the point is to catch the hype, by groups of candy wrappers or, on the contrary, the threshold of stopping the flow of money into another hype.
BTC dominance to altcoins. Dominance of stablecoins and market pump . 07 2022
Without pain, there is no way for someone to gain benefits in the speculative market. Who will experience pain and who will gain benefits depends only on the qualities of the person who decided to engage in trading. That is, the totality of his positive/negative qualities that project his actions in the market. Everything is extremely simple and honest.
Dollar Index.
There are a series of interrelated ideas (three, detailed explanation), about the dollar index, that is, the larger cyclicality of the markets in general, and the crypto market as a small projection. Also, all publications of 2022-2023.
DXY Dollar Index USA. Recession and Pump/Dump Market Indicator 09 2022
DXY (Dollar Index) and Pump/Dump BTC. Market Cycles . 09 2022

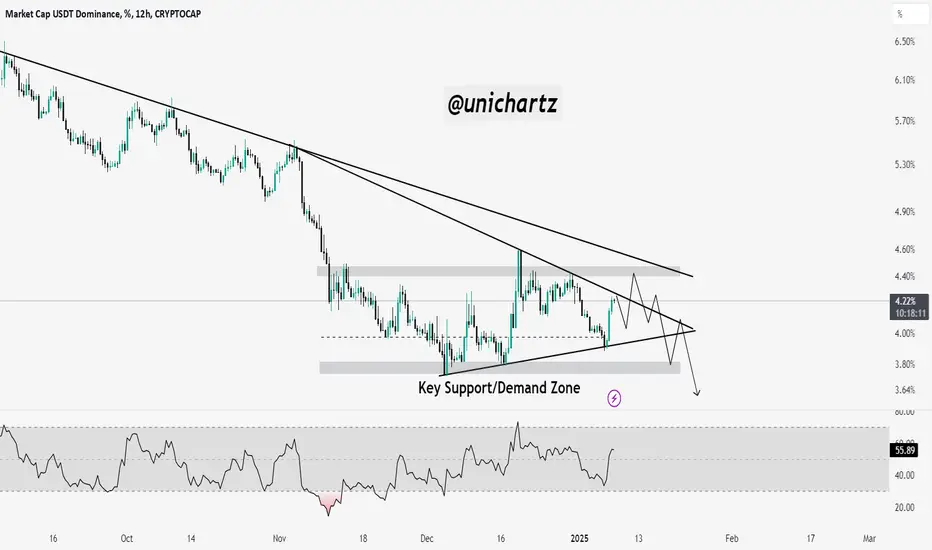
USDT Dominance Approaching Key Resistance – A Breakout or RejectA breakout above 4.40% could suggest a bearish shift for altcoins as funds move into stablecoins.
However, rejection at this level may lead to another test of the 4.00% support, which could boost altcoin performance.
Traders should watch for volume confirmation and RSI behavior for clearer direction.
USDT Dominance Chart AnalysisReaction level: 4.60%
This area acts as a key overhead resistance, highlighted by price rejection at or near this previous level. A breakout above 4.60% would signal a change in momentum towards increasing USDT dominance.
Support area: 3.71%
This is a strong demand area where the price previously bounced. If the market returns to this level, it could provide crucial support and a potential reversal area.
The chart shows a clear descending channel with the price breaking or testing the upper boundary. This indicates a potential trend reversal or an attempt to move higher.
The price interacts with the moving average (possibly the 50-day MA), which has acted as resistance several times. Sustaining above the moving average would indicate bullish momentum.
DYOR, NFA
@Peter_CSAdmin

USDT DOMINANCEHi , Dominance of Usdt confirmed bearish channel so should big pump for BTC and Altcoins .

USDT.D (Full Chart Analysis-Long-Term)Hello Friends.
How are you? Hope you always be happy and successful
Today I want to talk about USDT.D
in another words, I want to talk about the dominance of Tether.
the situation is complicated.
I want to check this item based on Ichimoku, channel line, and classic pattern. so, let's go into details.
based on Ichimoku, the future cloud is getting green(positive)
Tenkensen is above Kijunsen and it's a sign to prove us the chart is bullish.
based on the Classic pattern, we have an Ascending Triangle. As you know it's a continuation pattern. and I expect this trend to continue.
if dominance succeeds in breaking 8.21% and then 8.51%, the next target will be 9.45%.
that's a border of a huge dropping in altcoins.
if dominance is able to stabilize above 9.45%, everything will be changed and the main target of this movement will be 15%
it means that you will see a lower low in all markets.
And you should expect it to drop more than you think.
it's my favorite theory. I think it will happen soon.
let me check based on the channel line in the weekly time frame.
As you can see, we are moving in an ascending channel.
we had three hits at the top of the channel and four hits at the bottom of the channel.
it means that this channel is validated.
at this time we are moving around the midline. This move to the top of the channel is expected to be around 15%.
If these three conditions occur, everything will be changed. and you can buy for example Bitcoin for around 9800-11500 USD for the first level. and maybe cheaper.
sounds great.
who doesn't like it?
🙏🙏 Please don’t forget to like 👍, follow ✌️, and share 👌 this analysis with your friends. Thank you so much for your attention and participation 🙏🙏
Sincerely Yours
Ho3ein.mnD

USDT.D wants to drop?Hello traders, we're in a strong oB currently as for USDT Dominance, and I expect a big drop from current position of the USDT Dominance, and by USDT.D dropping, alt-coins will do a nice breakout...
Enjoy trading <3

alt season or what?the growth on the chart is more likley and since the btc.d is bearish now we can expect that alts pump one after another

USDT.D ANALYSIS (4H)Hi, dear traders. how are you ? Today we have a viewpoint to BUY/LONG the USDT.D symbol.
It seems that after Pullback, we will climb to the level of FLIP to the FVG area and this substructure will be completed
Comment if you have any questions
Thank You

USDT.D | DOMINANCE USDT | MY TARGET 11Hi traders
What I am posting here is just to take a look from another angle
NFA
@Tanjawi_ma

market cap usdt dominance shortAccording to the analysis, it responds to the first support and rises to the trend line and attacks the second support again.

🔻 ALT season coming ???USDT.D have been above the uptrend line for 130 days and now broken that trendline and shows good pullback i think next days are time for ALT coins let's see =)

🚀 which scenario will happen?Forming a new symmetrical triangle pattern in 4H time frame. I think the green scenario is more probable than the red scenario and if USDT.D goes up, BTC price will decrease to 36K let's what will happen.
thank you for attention =)

USDT.D Daily Analysis🟢USDT's dominance bounced from the uptrend line support to form a twin floor pattern and is now above the neckline of this pattern, which also acts as a support. If the retest is successful, it is expected to move upwards, which will be a sign of decline for the market because the USDT and BTC dominance are inversely related to each other.
Use the appropriate loss limit for your trades, which has a very high possibility of emotional movement in the market.
⚠ This Analysis will be updated.
Amir Hossein
📅 02.19.2022
⚠️ (DYOR)

MARKET CAP USDT DOMINANCE /1D as you can see If support is maintained, we expect growth rather than resistance 4.42%
#usdt #dominance #marketcapusdtdominance #usdtdominance #marketcap #cryptocurrency #crypto #trade #trading #technicalanalysis #analysis

Dominance USDTHello traders. I expect that after re-conquering the previous ceiling, we will have a negative divergence and its value will be corrected to 3.5%. Be profitable
