SP500 rock & roll with Trump.. 4/July/25SPX500 breaking ATH again are we in bullish stage? Or again Donald Trump "Inviting" us come to his WWE stage for his favourite "wrestling" games.. Jumping up and down or up side down.( expanding triangle) ......
Donaldtrump

TSLA bearish: Musk vs Trump! Subsidy Spotlight & Sentiment RisksIf you haven`t bought TSLA before the recent breakout:
Now you need to know that Tesla (TSLA) is sitting around $315, but the vibe is getting shakier. Elon Musk’s feud with Donald Trump — complete with jokes about “putting the DOGE on him” if deported — might feel like another meme moment, but it spotlights Tesla’s huge dependency on federal and state support.
Estimates show Tesla could face up to $48 billion in lost government contracts and incentives over the next decade if the political tide turns. With Trump’s base calling out “green subsidies” as wasteful, Tesla’s funding pipeline could get squeezed — just as competition ramps up and margins get tighter.
Key Bearish Points
1) Political Risk Is Real
Musk’s public fight with Trump is a double-edged sword: he risks losing goodwill on both sides of the aisle. If the next administration decides to gut EV credits, Tesla could take a huge hit — far more than its rivals who rely less on U.S. incentives.
2) Subsidy Dependence
Tesla’s success is partly built on a foundation of tax credits, carbon credits, and favorable policies. $48B in potential lost value is nothing to shrug off — especially when competitors like BYD are gaining ground.
3) Bearish Technical Setup
TSLA’s chart is rolling over inside a bearish channel. It recently failed to hold the $330 level and now sits around $315. A clean breakdown below $300 could open the door to your target zone at $262 — a major support area from earlier this year.
Catalysts:
Any new comments from Trump’s camp about EV subsidies
Weak delivery/margin numbers from Tesla
Broader tech/equity pullback
Musk’s crypto distractions no longer propping up sentiment
Disclosure: I am part of Trade Nation's Influencer program and receive a monthly fee for using their TradingView charts in my analysis.

MUSK on TRUMP's Bill | "outrageous, disgusting abomination"Elon Musk’s sided against the latest Trump-backed tax-and-spending package, in a plot twist between the recent partners turned enemies.
Musk called the legislation a “massive, outrageous, pork-filled Congressional spending bill” and a “disgusting abomination,” publicly shaming senators and representatives who backed it.
With such a strong opinion against it one may wonder, is this going to negatively affect Tesla?
Together with this strong reaction, the price has already been trading lower for the past few days.
The administration has defended it as the “One Big Beautiful Bill,” insisting it will stimulate growth, even though Elon Musk warned the bill would swell the U.S. budget deficit by roughly $2.3–2.5 trillion over the next decade, calling the added debt “crushingly unsustainable”.
When I first read this, it made me think of Tesla's long generated “green credits”, which in 2024 alone, brought in roughly $2.76 billion. “green credits” (officially, zero-emission or regulatory credits) work by building more clean vehicles than required and selling the excess allowances to other automakers that need them to comply with emissions mandates.
Now I'm no expert on US policy, and so I roped in GPT to help me explain how this new bill implicates TESLA's profit:
Under the Senate’s “big, beautiful” tax-and-spending bill, Tesla’s regulatory-credit business faces two assaults:
❗ Repeal of CAFE- and ZEV-mandates
The bill would eliminate penalties for automakers missing Corporate Average Fuel Economy targets and roll back zero-emission vehicle mandates that currently force legacy manufacturers to buy credits if they fall short. Remove those penalties and mandates, and there’s no structural need for credits—undercutting the very market that funds Tesla’s $2–3 billion-a-year credit-sales business
❗ End of consumer EV tax incentives
By phasing out the $7,500 new-EV credit (and the $4,000 used-EV credit) within months of enactment, the bill dampens U.S. EV demand overall. A smaller EV market means fewer opportunities for Tesla to leverage fleet-wide ZEV regulations against higher-emitting rivals—further squeezing credit prices and volume
Bottom line: Without CAFE/ZEV obligations and with EV purchase subsidies gone, Tesla’s “green-credit” line—a major profit driver in recent quarters—would likely collapse, removing a key buffer against manufacturing and pricing pressures.
This could be the beginning of a bear market for Tesla lasting throughout the rest of the Trump administration.
________________________
NASDAQ:TSLA

DEFI altcoin - The Trump Crypto ConnectionThe relationship between decentralized finance (DeFi), the Trump family, and Kevin O’Leary in 2025 centers around their public involvement in the crypto and blockchain space, particularly highlighted by their participation in events like DeFi World 2025 and specific DeFi projects tied to their names or influence.
The Trump family, notably Donald Trump Jr. and former President Donald Trump, has increasingly engaged with DeFi and cryptocurrency. Donald Trump Jr. spoke at the DeFi World 2025 Conference in Denver on February 26, alongside Kevin O’Leary, signaling a growing interest in blockchain’s potential to shape finance. Posts on X from DeFi confirm their appearances, with Trump Jr. scheduled at 3:00 PM and O’Leary at 3:45 PM, reflecting a shared platform to promote DeFi’s future. Beyond this event, the Trump family is linked to World Liberty Financial (WLFI), a DeFi project launched in September 2024. WLFI aims to democratize crypto lending and borrowing while reinforcing the U.S. dollar’s dominance, operating on Aave’s v3 protocol.
Kevin O’Leary, a Canadian investor and “Shark Tank” star, has been a vocal DeFi advocate since at least 2021, when he invested heavily in DeFi Ventures (later renamed WonderFi), targeting 4.5–8% yields on crypto assets. His participation in DeFi World 2025 alongside Trump Jr. underscores his ongoing commitment. O’Leary sees DeFi as a way to bypass financial middlemen, predicting it could transform trading within years. His practical involvement contrasts with the Trump family’s more symbolic and policy-driven engagement, though both share a bullish stance on crypto’s future.
Fully diluted Market Cap of only $2.64Mil.

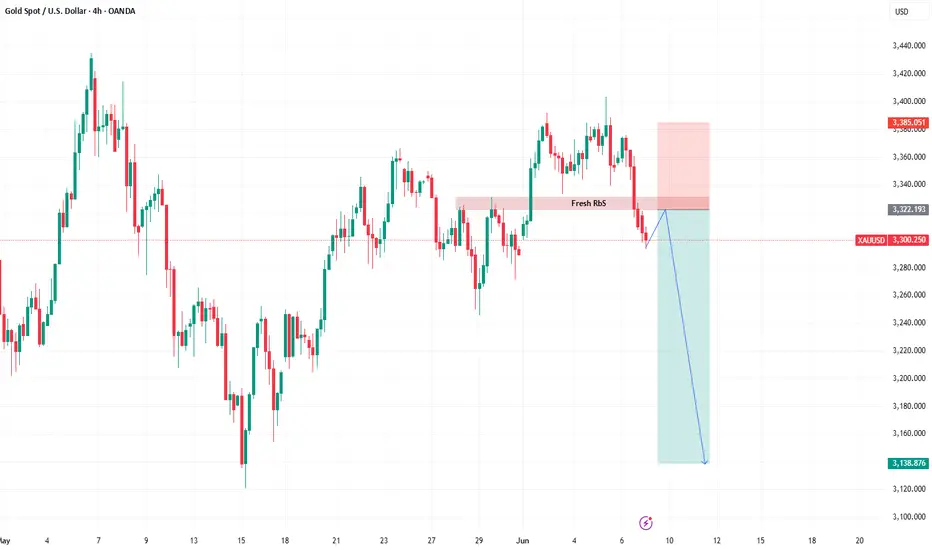
XAUUSD after NFPBased on chart
Price already break the RbS area
So for now the plan is to wait the price to retest the RbS area then drop
TSLA SellOff ! Elon Musk vs Donald Trump ! Beginning of the End?If you haven`t bought the dip on TSLA:
Now you need to know that TSLA Tesla experienced a significant drop of 14% today, marking its worst single-day performance in over four years. This decline erased approximately $150 billion in market capitalization, bringing the stock down to $284.70.
The immediate cause of this downturn is the escalating feud between CEO Elon Musk and President Donald Trump. Musk's public criticism of Trump's tax legislation, labeling it a "repugnant abomination," prompted Trump to threaten the revocation of government contracts with Musk's companies. This political clash has introduced significant uncertainty regarding Tesla's future government support.
Beyond the political arena, Tesla's core business metrics are showing signs of strain. The company reported a 9% decline in quarterly revenues and a staggering 71% drop in profits. Additionally, Tesla has lost its leadership position in the electric vehicle market to China's BYD, indicating increased competitive pressure.
cincodias.elpais.com
Investor sentiment is also waning. A Morgan Stanley survey revealed that 85% of investors believe Musk's political activities are negatively impacting Tesla's business fundamentals. This perception is further exacerbated by declining sales in key markets, such as a 17% drop in Model Y registrations in California.
thestreet.com
Elon Musk and Donald Trump have publicly clashed, escalating a feud that has unraveled their once-close relationship. The dispute centers on several issues:
Republican Tax and Immigration Bill: Musk criticized a sweeping Republican domestic policy bill backed by Trump, calling it a "disgusting abomination" on X. Trump claimed Musk initially had no issue with the bill, accusing him of being upset over the removal of an electric vehicle tax credit.
Epstein Files Allegation: Musk alleged Trump's name appears in classified Jeffrey Epstein files, escalating tensions. Trump has not directly addressed this claim but responded by threatening to cut government contracts with Musk's companies.
Personal and Financial Accusations: Musk argued Trump would have lost the 2024 election without his financial support, accusing him of ingratitude. Trump countered, saying he was "disappointed" in Musk, claiming he asked Musk to leave the administration and accused him of "Trump Derangement Syndrome."
Government Contracts and Tariffs: Trump threatened to cancel "billions and billions" in government contracts with Musk's companies, like SpaceX, amid the feud. Separately, Musk reportedly made personal appeals to Trump on auto tariffs, which Trump noted might involve a conflict of interest.
Cabinet Clash: Reports indicate Musk clashed with Trump’s cabinet, including Marco Rubio, over spending cuts related to the Department of Government Efficiency (DOGE), with some describing Musk's behavior as disruptive.
Given these challenges, a price target of $215 for TSLA appears justified. The combination of political entanglements, deteriorating financial performance, and eroding investor confidence suggests that Tesla's stock may face continued downward pressure in the near term.
Disclosure: I am part of Trade Nation's Influencer program and receive a monthly fee for using their TradingView charts in my analysis.

Everything we know about the Trump - Musk divorce (so far)
Elon Musk publicly criticised Trump’s “One Big Beautiful Bill” as a “disgusting abomination” that would explode the U.S. deficit and “bankrupt America.” The bill is projected to add $2.5 trillion to the U.S. deficit over 10 years.
Musk claimed Trump wouldn’t have won the 2024 election without his support, calling the backlash “such ingratitude.”
Musk then alleged on X that Trump appears in the Epstein files. This marks a serious escalation (but we all thought this before Musk confirmed it right?)
Trump followed up on Truth Social by calling Musk “crazy” and hinting at cancelling federal contracts with his companies. Trump wrote that cancelling subsidies for Musk’s companies “could save billions,”.
Tesla has wiped out ~$100 billion in market value. Tesla now politically exposed?
Musk floated the idea of creating a new centrist political party, criticising both Democrats and MAGA Republicans. “We need a party that actually represents the interests of the people. Not lobbyists. Not legacy donors. Not extremists.”

Netflix (NFLX) – A Safe Haven Amid Tariff UncertaintyKey Supporting Arguments
Amidst the unpredictability of Donald Trump's tariff policies, Netflix might serve as a defensive play.
Positive consumer sentiment, a surge in subscriber growth, and strategic hikes in subscription prices are poised to power robust results for the first quarter of fiscal year 2025.
Investment Thesis
Netflix (NFLX) is a global leader in video streaming, offering a vast library of original and licensed content to subscribers worldwide. With over 95% of its revenue stream coming from subscriptions, the company secures a solid foundation against the whims of market volatility. NFLX’s nascent foray into advertising contributes a mere 3% to its revenue, ensuring that any tremors in the macroeconomic climate have a minimal ripple effect.
Netflix's business model, anchored in subscription revenue and expansive geographic diversification, shields the company from the whims of unpredictable tariff policies. Amidst the relentless cycle of tariffs being slapped on and lifted from a variety of products and the growing tide of protectionism, streaming platforms such as Netflix, which thrive on subscription-based models, emerge as devensive assets. This is largely because they steer clear of the tumultuous world of physical goods production, importation, and exportation. The sustainability of the company’s streaming empire is anchored in its formidable user engagement—clocking in at around 2 hours per household daily—paired with historically low subscriber churn and entertainment value that punches well above its price tag. These elements collectively mitigate NFLX’s risk profile in the face of a potential recession. While advertising revenue may take a hit if trade tensions intensify and trigger an economic downturn, it is worth noting that ads only contribute to about 3% of Netflix's total revenue. Despite its worldwide footprint, the company still rakes in a hefty slice of its revenue—around 40-45%—from the U.S. market, offering a protective buffer against possible international sanctions or restrictions. Meanwhile, its strategic geographic diversification across Europe, Latin America, Asia, and the Middle East not only mitigates risks but also fortifies the sustainability of its business model.
Netflix is poised to potentially exceed expectations in its Q1 2025 earnings report. In Q4 2024, the company shattered expectations by pulling in a recordbreaking 19 million new users, a surge we anticipate will roll into 2025, powered by its rich and diverse content lineup. By the year's end, Netflix strategically hiked prices in the U.S. and UK, a move poised to bolster its Q1 2025 revenue. With a bold target of 29% growth for 2025, the company is banking on buoyant consumer spending and these subscription price upticks to hit the mark. Netflix projects a free cash flow of no less than $8 billion, creating a strategic opportunity for potential share buybacks.
Our target price for NFLX over the next two months is pegged at $1,080, paired with a "Buy" recommendation. We suggest setting a stop-loss at $880.

TESLA | Monthly Analysis After NASDAQ:TSLA hitting its ATH target, 87% - 90% retracement is next target
start of 2027 = will be a buying signal for tesla unless there's some issues involving with Elon Musk, then tesla could experience under performance
Long term investors - prepare for down side inside buying channel

USDJPY SHORT LIVE TRADE AND EDUCATIONAL BREAKDOWNUSD/JPY tumbles below 147.00, awaits US CPI for fresh impetus
USD/JPY has come under intense selling presure and drops below 147.00 in the Asian session on Thursday. The US-China trade war escalation and the divergent BoJ-Fed policy expectations underpin the Japanese Yen and weigh heavily on the pair amid a renewed US Dollar downtick. US CPI awaited.

XAU LONG LIVE TRADE AND EDUCATIONAL BREAKDOWN Gold extends rally to $3,050 area as safe-haven flows dominate markets
Gold preserves its bullish momentum and trades near $3,050 in the second half of the day. Further escalation in the trade conflict between the US and China force markets to remain risk-averse midweek, allowing the precious metal to capitalize on safe-haven flows.

Thanks to STUPID TRUMP the downward trend continuesDo you agree with me that Trump is a narcissistic and crazy man who has decided to destroy the world economy, or is he discrediting powerful people and just lying

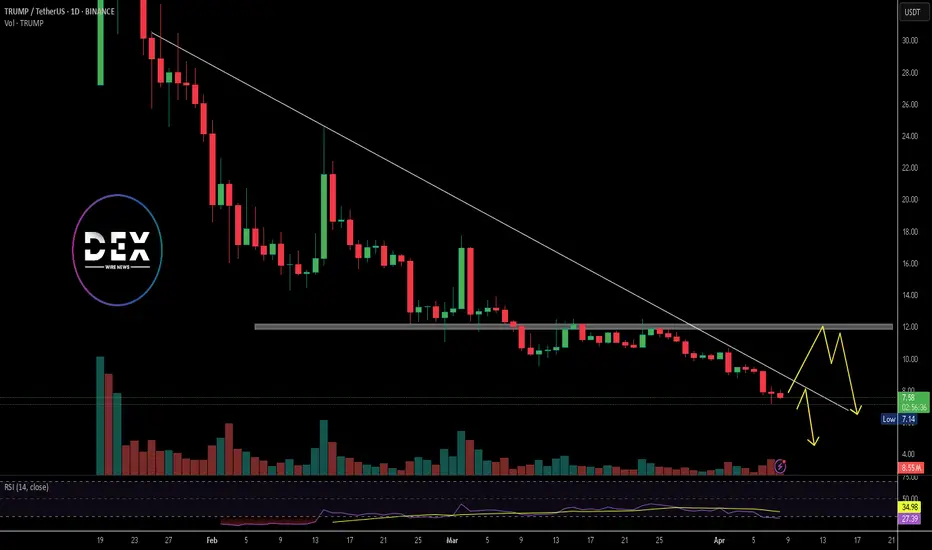
$TRUMP token Crumbles as Major Support Breaks, Is an ATL Next? TRUMP, the meme token inspired by former President Donald Trump, is currently priced at $7.52. The token has gained 5.03% in the last 24 hours. Its market capitalization stands at $1.5 billion, with a daily trading volume of $415.5 million, a drop of nearly 60.12% in the last 24 hours.
TRUMP was launched to commemorate Trump’s viral "FIGHT FIGHT FIGHT" moment in July 2024. That day, he survived a deadly incident and raised his fist in defiance. The moment triggered a movement that birthed this meme token. It symbolizes resilience and leadership, attracting thousands to its growing community. The token is now freely tradable on the blockchain, with increasing interest in both trading and long-term holding.
Technical Analysis: Price Faces Trendline Rejection and Heavy Resistance
TRUMP has been in a strong downtrend since reaching highs at $77. A descending trendline continues to cap upward moves, with the price breaking below key support at$12. Resistance is seen around the descending trendline and the horizontal support at $12. This level was previously a support and is now acting as a ceiling for price recovery. The daily RSI is currently at 27.19 indicating oversold conditions. This could trigger a short-term bounce toward $10–$12.
However, the trend remains bearish. The price has failed multiple times to break above the downtrend line. If the price breaks below $7 with volume, further drop could follow. A successful bounce might lead to a retest of $12.
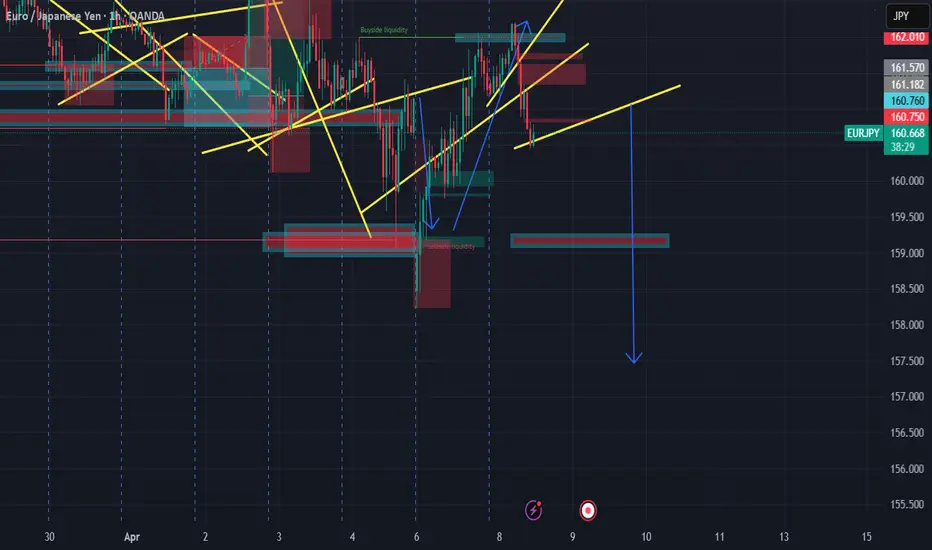
expecting eur jpy to take a FULL SLIDE TO THE DOWNSIDE158.461 DOWNSIDE TARGET for eur jpy im expecting a full liqudity slide
on structure until we see some sell side exhaustion in price action
Jaguar Land Rover Temporarily Halts U.S Shipments Amid TariffsJaguar Land Rover (JLR), owned by Tata Motors, has paused shipments to the U.S. market this April. The move follows a 25% import tax on vehicles imposed by U.S. President Donald Trump. JLR described the U.S. as a vital market and stated it is now adjusting to new trade rules with business partners.
The pause is a short-term step. The company aims to finalize longer-term strategies to manage the new tariffs. Analysts believe other British carmakers may soon follow this approach. Britain's auto sector faces pressure from falling domestic demand and the costly transition to electric vehicles.
David Bailey, a University of Birmingham professor, predicts more stoppages. He said automakers will reassess their plans amid rising costs and trade uncertainty. Recent data shows U.K. car production fell 13.9% last year to 779,584 units. Over 77% of these vehicles were exported.
The Society of Motor Manufacturers and Traders (SMMT) voiced concern. CEO Mike Hawes said the timing worsens an already challenging period. He urged swift trade talks to protect jobs and growth. The SMMT has stayed in regular contact with the U.K. government to seek solutions.
To soften the tariff’s impact, carmakers rushed to build inventories in the U.S. JLR was among them. U.K. car exports to the U.S. jumped 38.5% in Dec, 12.4% in January and 34.6% in February.
According to official figures, British automakers shipped £8.3 billion ($10.7 billion) worth of cars to the U.S. in the 12 months through September. Cars remain Britain’s largest goods export to the U.S. However, goods make up a smaller portion of overall trade. Services account for 68.2% of the £179.4 billion ($231.2 billion) in total U.K.-U.S. trade during the same period.
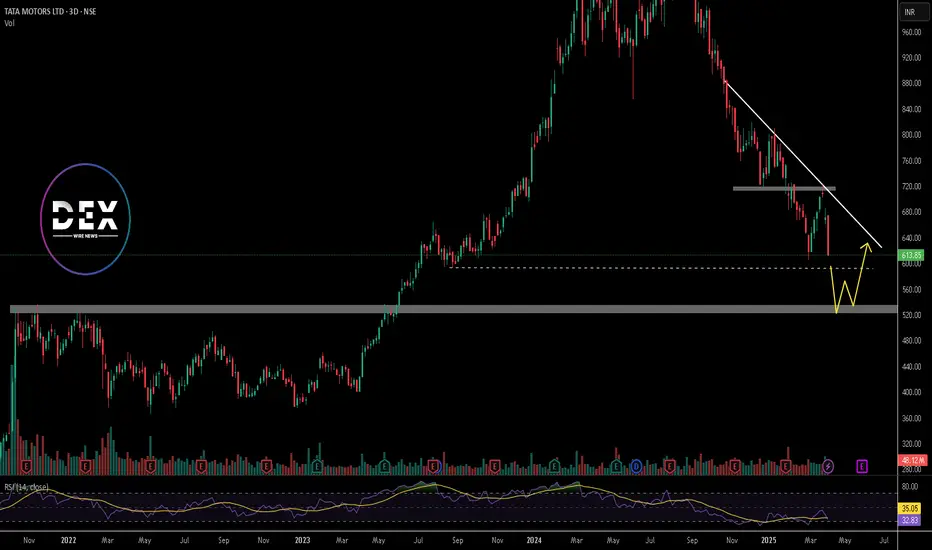
JLR is not independently listed. But looking at the parental company, Tata Motors (TATAMOTORS.BO) trades on India’s BSE. Its stock closed at INR 613.85 on April 4th, 2025 (6.15%).
Technical Analysis: Bearish Momentum Since July 2024 Highs
Tata Motors stock peaked at INR 1179 in July 2024. Since then, it has shown a sharp downtrend. It has surged in bearish momentum and has been breaking major support levels. In late January 2025, the price broke below key support at INR 715 and has retested it in March 2025. Currently, it trades lower and is approaching the next support at around INR 591.
If this level fails to hold, the price may fall to INR 525. The downtrend has persisted for months, indicating sustained bearish pressure in the market. The weekly RSI now reads 32, derived from deep bearish sentiment. If the RSI dips further, it may signal oversold conditions. However, the current momentum suggests the stock could still drop.
If INR 591 holds, a short-term bounce may follow, with a short-term recovery phase that could push the stock toward the descending trendline. Still, bears maintain control for now, and a break below 591 may accelerate further losses.
Tesla Stock Drops 9%+ After Q1 Deliveries Drop to Three-Year LowTesla (Nasdaq: NASDAQ:TSLA ) is trading at $242.52 as of 1:04 PM EDT on April 4th, down 9.26%. The stock fell $24.76 after reporting weak Q1 2025 results. This came two days after Tesla closed its worst quarter since 2022, shedding 36% in market value. The company delivered 336,681 vehicles in Q1, missing analysts’ expectations of 360,000 to 377,590. This marked a 13% drop compared to Q1 2024, when it delivered 386,810 units. Production also fell to 362,615 vehicles from 433,371 in the prior year.
Tesla produced 345,454 units of its Model 3 and Model Y. Deliveries for those models stood at 323,800. Other models, including the Cybertruck, accounted for 12,881 deliveries. The quarter saw partial factory shutdowns to upgrade lines for a redesigned Model Y.
CEO Elon Musk said this model could again be the world’s best-selling car in 2025. But now the question is, will it?
Looking at it, Tesla faces several challenges, including increased EV competition and reputational damage tied to Musk’s political involvement. Of late, the CEO’s position in Trump’s Department of Government Efficiency (DOGE) has drawn backlash.
Protests, boycotts and vandalism against Tesla facilities and vehicles spread across the U.S and Europe. In Germany, Tesla’s EV market share dropped from 16% to 4%. Across 15 European countries, market share fell to 9.3% from 17.9%.
China also posed challenges. Tesla sold 78,828 EVs in March, an 11.5% year-on-year decline as domestic competitors like BYD increased their market presence. In Canada, Tesla claimed 8,653 EV sales during a January weekend to qualify for subsidies. The transportation ministry froze the payments and launched a probe into the claim.
Technical Analysis: Price Approaches Key Support Zone
Tesla’s price has declined sharply since hitting an all-time high of $488 in late December 2024. Since January, the stock has been in a downtrend, respecting a descending trendline. In early February, it broke a key support level at $290 and retested the level in late March before continuing downward.
Currently, the stock is approaching support at $190, a critical level for short-term price action. If it holds, the stock could attempt to break the descending trendline and move toward the $290 resistance.
If Tesla's bearish bias persists and breaks below $190, the next support sits at $140. This aligns with the head of a previously completed head-and-shoulder pattern. Breaking this level could trigger further losses.
The next few weeks will determine if it rebounds or slides deeper, with earnings report expected on Apr 22nd, 2025.

Will the Fear Gauge Flash Red?The Cboe Volatility Index (VIX), Wall Street's closely watched "fear gauge," is poised for a potential surge due to US President Donald Trump's assertive policy agenda. This article examines the confluence of factors, primarily Trump's planned tariffs and escalating geopolitical tensions, that are likely to inject significant uncertainty into the financial markets. Historically, the VIX has proven to be a reliable indicator of investor anxiety, spiking during economic and political instability periods. The current climate, marked by a potential trade war and heightened international risks, suggests a strong likelihood of increased market volatility and a corresponding rise in the VIX.
President Trump's impending "Liberation Day" tariffs, set to target all countries with reciprocal duties, have already sparked considerable concern among economists and financial institutions. Experts at Goldman Sachs and J.P. Morgan predict that these tariffs will lead to higher inflation, slower economic growth, and an elevated risk of recession in the US. The sheer scale and breadth of these tariffs, affecting major trading partners and critical industries, create an environment of unpredictability that unsettles investors and compels them to seek protection against potential market downturns, a dynamic that typically drives the VIX upward.
Adding to the market's unease are the growing geopolitical fault lines involving the US and both China and Iran. Trade disputes and strategic rivalry with China, coupled with President Trump's confrontational stance and threats of military action against Iran over its nuclear program, contribute significantly to global instability. These high-stakes international situations, fraught with the potential for escalation, naturally trigger investor anxiety and a flight to safety, further fueling expectations of increased market volatility as measured by the VIX.
In conclusion, the combination of President Trump's aggressive trade policies and the mounting geopolitical risks presents a compelling case for a significant rise in the VIX. Market analysts have already observed this trend, and historical patterns during similar periods of uncertainty reinforce the expectation of heightened volatility. As investors grapple with the potential economic fallout from tariffs and the dangers of international conflicts, the VIX will likely serve as a crucial barometer, reflecting the increasing fear and uncertainty permeating the financial landscape.

From MAGA to DEFI: The Trump Crypto ConnectionThe relationship between decentralized finance (DeFi), the Trump family, and Kevin O’Leary in 2025 centers around their public involvement in the crypto and blockchain space, particularly highlighted by their participation in events like DeFi World 2025 and specific DeFi projects tied to their names or influence.
The Trump family, notably Donald Trump Jr. and former President Donald Trump, has increasingly engaged with DeFi and cryptocurrency. Donald Trump Jr. spoke at the DeFi World 2025 Conference in Denver on February 26, alongside Kevin O’Leary, signaling a growing interest in blockchain’s potential to shape finance. Posts on X from DeFi confirm their appearances, with Trump Jr. scheduled at 3:00 PM and O’Leary at 3:45 PM, reflecting a shared platform to promote DeFi’s future. Beyond this event, the Trump family is linked to World Liberty Financial (WLFI), a DeFi project launched in September 2024. WLFI aims to democratize crypto lending and borrowing while reinforcing the U.S. dollar’s dominance, operating on Aave’s v3 protocol.
Although Donald Trump and his family are not direct operators of WLFI, the project leverages the Trump brand, with 70% of its token supply held by insiders and 75% of revenues directed to DT Marks DEFI LLC, a Trump-connected entity. Trump himself has pushed pro-crypto policies, including banning central bank digital currencies and exploring a national crypto stockpile, aligning with DeFi’s ethos of decentralization.
Kevin O’Leary, a Canadian investor and “Shark Tank” star, has been a vocal DeFi advocate since at least 2021, when he invested heavily in DeFi Ventures (later renamed WonderFi), targeting 4.5–8% yields on crypto assets. His participation in DeFi World 2025 alongside Trump Jr. underscores his ongoing commitment. O’Leary sees DeFi as a way to bypass financial middlemen, predicting it could transform trading within years. His practical involvement contrasts with the Trump family’s more symbolic and policy-driven engagement, though both share a bullish stance on crypto’s future.
I`m extremely bullish on this coin at this level.

What Rules the Skies Now?In a landmark decision reshaping the future of aerial warfare, Boeing has secured the U.S. Air Force's Next Generation Air Dominance (NGAD) contract, giving rise to the F-47, a sixth-generation fighter poised to redefine air superiority. This advanced aircraft, succeeding the F-22 Raptor, promises unprecedented capabilities in stealth, speed, maneuverability, and payload, signaling a significant leap in aviation technology. The F-47 is not conceived as a solitary platform but as the core of an integrated "family of systems," working in concert with autonomous drone wingmen known as Collaborative Combat Aircraft (CCAs) to project power and enhance mission effectiveness in contested environments.
The development of the F-47 directly responds to the evolving global threat landscape, particularly the advancements made by near-peer adversaries like China and Russia. Designed with a focus on extended range and superior stealth, the F-47 is specifically tailored to operate effectively in high-threat regions, such as the Indo-Pacific. Years of clandestine experimental flight testing have validated key technologies, positioning the F-47 for a potentially accelerated deployment timeline. This next-generation fighter is expected to surpass its predecessors in critical areas, offering enhanced sustainability, supportability, and a reduced operational footprint, all while potentially costing less than the F-22.
The designation "F-47" itself carries historical and symbolic weight, honoring the legacy of the World War II-era P-47 Thunderbolt and commemorating the founding year of the U.S. Air Force. Furthermore, it acknowledges the pivotal role of the 47th President in supporting its development. Design elements observed in early visualizations hint at a lineage with Boeing's experimental aircraft, suggesting a blend of proven concepts and cutting-edge innovation. As the F-47 program moves forward, it represents not only a strategic investment in national security but also a testament to American ingenuity in maintaining its dominance of the skies.

Just In: $TRUMP Dips 5% Down to $10.86 Pivot Trump token a coin created in the start of the year 2025 that saw a noteworthy uptick surging from a low of $3 to almost $80 dips 5% today retracing to the $10.888 support point amidst general crypto landscape.
The 78.6% Fibonacci retracement point is acting as support point for $TRUMP a break below that level could lead to the 1-month low axis as the RSI is weak presently at 37.
Similarly, a break above the 38.2% Fibonacci retracement point could spark a bullish reversal move or a temporary reprieve albeit the crypto market is volatile at the moment.
OFFICIAL TRUMP Price Live Data
The live OFFICIAL TRUMP price today is $10.84 USD with a 24-hour trading volume of $476,149,181 USD. OFFICIAL TRUMP is down 5.55% in the last 24 hours, with a live market cap of $2,167,125,027 USD. It has a circulating supply of 199,999,527 TRUMP coins and a max. supply of 999,999,993 TRUMP coins.

BITCOIN — THE SUPPORT LINEBitcoin’s ultimate support for bulls lies between the two black lines shown above.

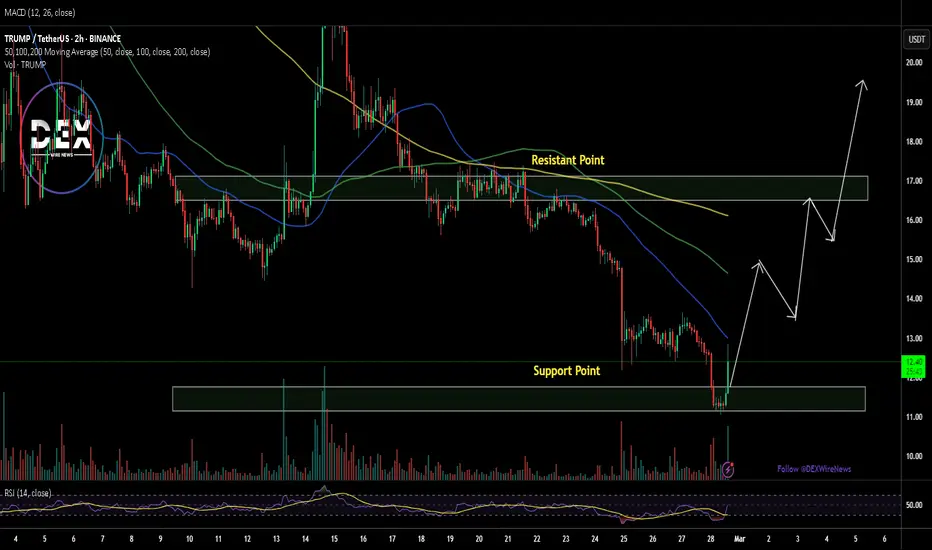
$TRUMP Coin on the Verge of a Major Breakout: Can It Reach $30?The cryptocurrency market is buzzing with excitement as $TRUMP coin approaches a critical resistance level. Currently trading near $17, the token has already broken a significant Break of Structure (BOS), hinting at a potential bullish surge. If $TRUMP successfully breaches this resistance point, technical indicators suggest a remarkable 200% rally, pushing the price toward $30.
Technical Analysis
A closer look at $TRUMP’s daily chart reveals key bullish signals:
The $17 mark has proven to be a significant resistance level. A confirmed breakout could trigger a strong uptrend, with $30 as the next major target. The Relative Strength Index (RSI) is currently at 48, indicating neutral momentum. However, with buying pressure increasing, RSI could soon move into the bullish zone, reinforcing the uptrend.
The token's recent candlestick formations suggest a bullish engulfing pattern, which often precedes a strong rally. The $11 price point has emerged as a crucial support level. If this level holds, bulls could maintain momentum. However, a break below $11 may lead to a strong sell-off.
Trump Organization’s Metaverse & NFT Plans
The Trump Organization has officially filed a trademark application for 'TRUMP' to launch a metaverse and NFT trading platform. This development aligns with the growing trend of Web3 adoption by prominent figures and institutions.
A metaverse and NFT ecosystem tied to the Trump brand could significantly increase interest in $TRUMP coin, driving speculative demand and institutional involvement. If the project gains traction, it could serve as a major long-term growth factor for the token’s valuation.
What’s Next for $TRUMP Coin?
With both technical and fundamental indicators aligning, $TRUMP coin is at a pivotal moment. The key level to watch remains the $17 resistance. A decisive breakout could ignite a major rally toward $30, while failure to hold above support at $11 might trigger a correction.
Trump's Golden RatioTrump has launched his own personal token that he will use solely for his own benefit for bribes and money laundering. He's not a politician, he's a businessman who knows how to make money. Creating his own cryptocurrencies is direct proof of that. The $TRUMP token plays a role as the president's personal token for the Republicans to donate to him and a legal way to get money from other politicians. The whole saga with his token is just beginning, it is one of the few steps in building the Trump family the greatest business ever.
As far as the chart is concerned, we should wait for a bounce into the golden section area. Now there was a FUD regarding the ByBit hack, it's like a fake attempt to panic the crowd, but it didn't work with smart people. Only the strongest are left here, who have survived everything they can.
Horban Brothers.
