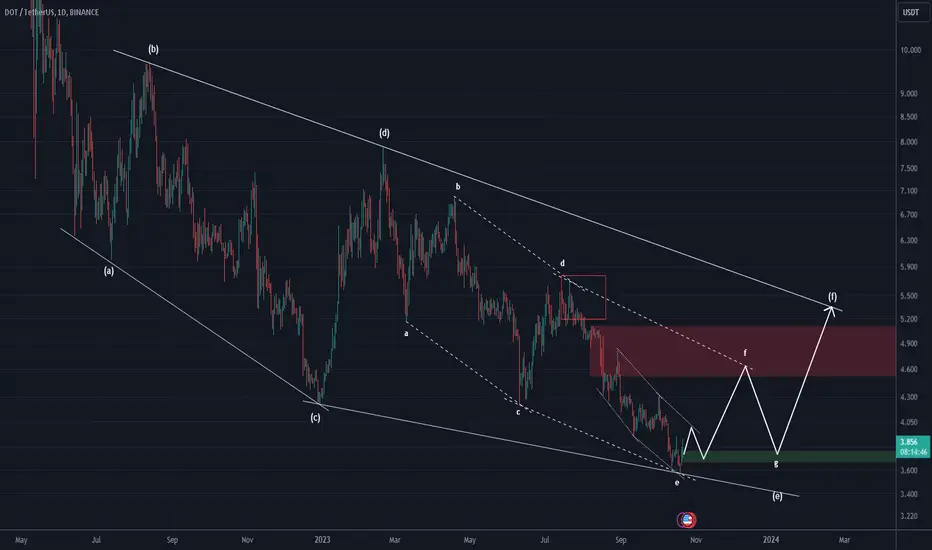
Second movement formationIn the failure of the line of Ron and powerful candle, you can expect to have the second movement width to form, it is very high, so you can enter according to my image and idea with capital management.
DOT

DOT Future Outlook 🚀One cryptocurrency that is lagging behind in my opinion is Polkadot.
Our last limit order for DOT didn't get filled. After close scrutiny, it appears to be a completed Wave (a), with the formation of Wave (b) underway or just completed. There might be a brief upward move, but I don't anticipate it surpassing the level of Wave 1. A Flat pattern, whether Regular or Expanded, seems likely, potentially for wave (c) retracing precisely to the wave (a) level or just below it.
Considering this as a Wave 2 scenario, a wide stop-loss is advisable for added safety. A target around $7 would represent a 50% retracement, while pushing to $8 could mean a 67% gain. 📈

6 Altcoins that could POP as soon as this weekend!Traders,
Just wanted to cover my current trades/trade strategy as well as some potential winners. I have picked out a short list of coins that could pop as soon as this weekend or into next week.
If you don't want to watch the whole video the coins are: DOT, GODS, Powr, APE, Storj, and JASMY.
Best,
Stew

DOT/USDT 1HInterval ChartPlease see the chart of DOT in pair with USDT. First, we will use the blue lines to mark the downward trend channel, where the price is moving in the upper range, but in this channel, the yellow lines can be used to define the local upward trend channel.
Going further, we can move on to marking support areas when we start a larger correction. And here the first support is at the current price level of $5.23, then we have a support zone from $5.12 to $5.03, and then we have a strong support zone from $4.81 to $4.65.
Looking the other way, we see that the price has reached the resistance zone from $5.33 to $5.40, which it does not have the strength to break yet. However, if it manages to come out on top and out of the downtrend channel, it must overcome the zone from $5.50 to $5.63.
Please look at the RSI indicator, which indicates a rebound with room for the price to drop to a lower level, while if we look at the STOCH indicator, we will see that it is moving at the lower limit, which resulted in a slowdown in the correction and may result in a temporary price rebound.

DOT Polkadot Price TargetIf you haven`t sold DOT here:
Then you need to know that Binance, along with its CEO 'CZ,' has confessed to federal charges and committed to settling fines amounting to $4.3 billion.
The crypto exchange “admits it engaged in anti-money laundering, unlicensed money transmitting and sanctions violations"!
The question arises: from where will these substantial funds be derived?
One possible source is Binance's Proof-Of-Reserves, which reportedly exceeds 100%.
Among the tokens impacted is DOT Polkadot.
I've set a short-term price target for DOT Polkadot at $0.41.
Looking forward to read your opinion about it!

DOT target 712h time frame
-
DOT broke the downtrend line and creating a small bullish flag(lower time frame). Also, DOT might start following the Dow's theory to go above previous high at 6, then this breakout will be validated. With Fibonacci analysis, we can have target at 7 and 8
TP: 6.8~7.3 / 8.2
SL: 4.77

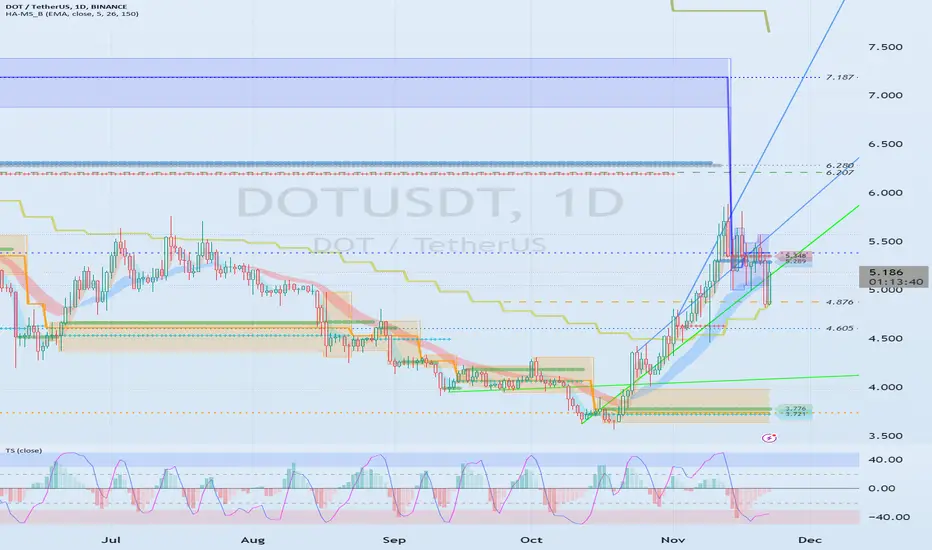
See if it can rise above 6.207-6.280Hello traders!
If you "Follow" us, you can always get new information quickly.
Please also click “Boost”.
Have a good day.
-------------------------------------
(DOTUSDT chart)
DOT corresponds to a coin that is expanding the coin ecosystem.
And, it is one of the coins that has not yet risen above the MS-Signal indicator on the 1M chart.
Accordingly, the key is whether the price can rise above 9.262 and maintain the price above the MS-Signal indicator on the 1M chart.
(1W chart)
To break out of the bottom zone, the price must rise above 6.207 and remain there.
However, the section where a full-fledged upward trend begins is expected to occur only when the price rises above 9.262-10.1307.
(1D chart)
Currently, the M-Signal indicator on the 1M chart is located above 7.187.
Accordingly, it is necessary to check whether the price can be maintained by rising above 5.382.
If that happens, it is expected to lead to an attempt to touch the M-Signal indicator on the 1M chart by rising to around 6.207-6.280.
If not, you should check for support around 4.876.
If it falls below 4.876, it will fall into the mid- to long-term investment area, that is, the bottom, so be careful.
--------------------------------------------------
- The big picture
The full-fledged upward trend is expected to begin when the price rises above 29K.
This is the section expected to be touched in the next bull market, 81K-95K.
-------------------------------------------------- -------------------------------------------
** All explanations are for reference only and do not guarantee profit or loss in investment.
** Trading volume is displayed as a candle body based on 10EMA.
How to display (in order from darkest to darkest)
More than 3 times the trading volume of 10EMA > 2.5 times > 2.0 times > 1.25 times > Trading volume below 10EMA
** Even if you know other people’s know-how, it takes a considerable amount of time to make it your own.
** This chart was created using my know-how.
---------------------------------
DOT/BTC , Accumulation zone?The price has been pushed to the plinth, the information space regarding the active is silent!
Will the formation of the accumulation zone or the reaction and food news, consistently upward growth?
The price is down 88.22% from its high.
We've been in a downtrend for 722 days.
Is it all that bad? I suggest you also watch the DOT/USDT publication.
Crab pattern.
(Create the illusion of a commodity that has no price. Buy what is based on your analysis, do not be manipulated! They turn your head in the other direction, in the direction of the spectacle, while backstage they are preparing the next scene for you!).

DOT/USDT , Accumulation zone?Indicates the average price before the asset pumps in 2020
The price is down 93.53% from its high.
We see each time on the weak reaction of the coin (breaking the resistance line of 434 days by 58.72%).
Now is in a descending channel of 462 days , the reaction to work out the wedge +42.40% - into the resistance of the upper boundary of the channel
The price is down to low values, pushing down, there is no positive news, is it all bad?
(Creating the illusion of a commodity that has no price. Buy what is based on your analysis, don't be manipulated! They turn your head in the other direction, in the direction of the spectacle, while the backstage is preparing the next scene for you!)

DOT/USDT Potential Bullish Trajectories? 👀 🚀 DOT Today analys💎 Paradisers, turn your attention to DOTUSDT as it showcases intriguing dynamics, currently positioned within a demand zone, hinting at high probability of a bullish trajectory.
💎 In recent developments, DOT managed to break free from a descending pattern, embarking on an upward trend. However, it faced resistance at the 4.622 supply level. The prevailing sentiment suggests a potential bullish push from the 4.285 demand zone.
💎 Yet, if the DOT doesn't maintain this momentum, it might find support and initiate a bullish trend from the 4.022 demand level.
💎 A breach below the 4.022 demand level could signal a bearish downturn. It's worth noting that while some newcomers might be inclined to go long, it's crucial to stay vigilant and remain a step ahead in the market.

DOTUSD request analysisThis chart are update from my previous analysis.
Right now DOT still channel up pattern, and already touch fibonacci support at channel up support, and broken channel down pattern with a strong candle.
Bullish will continue to reach previous resistance at $5.74
and we also have new bullish target at $6.41 as fibonacci 1.618 projection
*I draw path line, if $5.74 still hold bullish, our new support level at channel up support.

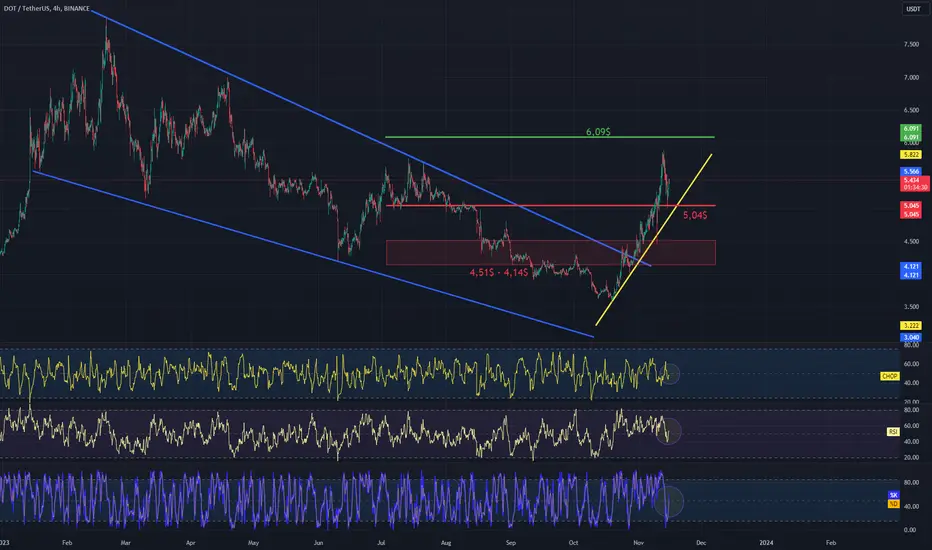
DOT/USDT 4H Interval ChartI invite you to review the chart of DOT in pair with USDT. First, we will use the blue lines to mark the downward trend channel from which the price emerged with dynamic upward movements, moving along the locally created upward trend line.
Going further, we can move on to marking support areas when we start a larger correction. however, here we have significant support at the level of $5.04, which has kept the price from further declines for now, only after it is broken, we can see the price return to the support zone from $4.51 to $4.14.
Looking the other way, for now, an important level for further increases is the resistance at the price of $6.09; only after it is overcome and positively tested will we be able to see attempts at further increases in the DOT price.
Please look at the CHOP index, which indicates that there is still energy to make a move, the RSI indicator shows a visible rebound, adding the STOCH indicator, which shows a reflection from the lower end of the range and visible room for growth, we can see a continuation of the upward movement before the upcoming correction.
Polkadot - Mid / Long term price targetsPrice points
$4.05
$4.195
$5.77 (Mid/Long term target)
Polkadot (DOT) is a prominent blockchain project that operates as an open-source, sharded multichain protocol. It has several key features and components that set it apart in the blockchain space:
Multichain Protocol: Polkadot's primary function is to connect and secure a network of specialized blockchains, making it possible for these blockchains to interact and share data or assets across chains. This interoperability is not limited to tokens but encompasses any data or asset types.
Web3 and Decentralized Internet: Polkadot is often associated with the concept of Web3, which envisions a decentralized internet of blockchains. It provides the foundation for creating a more decentralized web where users have control and data can be shared seamlessly.
Layer-0 Metaprotocol: Polkadot is sometimes referred to as a "layer-0 metaprotocol" because it serves as the basis for a network of layer-1 blockchains known as parachains. These parachains operate in parallel and can be customized for specific use cases.
On-Chain Governance: Polkadot features an on-chain governance system that allows it to autonomously and forklessly update its codebase. This system operates based on the preferences of the token holder community, giving them a say in the network's evolution.
DOT Token: The native cryptocurrency of the Polkadot network is the DOT token. It serves three primary purposes:
Staking for Security: DOT tokens can be staked to secure the network and participate in block validation.
Network Governance: DOT holders can participate in governance decisions, including proposed protocol upgrades and changes.
Bonding for Parachains: DOT tokens are used to bond parachains to the Polkadot network, allowing these specialized chains to connect and interact with the wider ecosystem.
Polkadot's architecture comprises four core components:
Relay Chain: Often referred to as the "heart" of Polkadot, the Relay Chain facilitates consensus, interoperability, and shared security across the network. It plays a crucial role in connecting various parachains.
Parachains: These are independent chains within the Polkadot network that have their own tokens and can be optimized for specific use cases. Parachains can be connected to the Relay Chain to leverage its benefits.
Parathreads: Parathreads are similar to parachains but follow an economical pay-as-you-go model. They offer flexible connectivity, making them a cost-effective option for projects with varying connectivity needs.
Bridges: Bridges enable parachains and parathreads to connect and communicate with external blockchains, such as Ethereum. This connectivity enhances interoperability by allowing data and assets to flow between different blockchain ecosystems.
Polkadot's design and features make it a significant player in the blockchain industry, as it aims to address the challenges of interoperability and scalability, while also offering a governance mechanism that allows its community to shape the network's future.

SasanSeifi 💁♂ DOT ⏩ 5.50$ / 6$Hey there! In the weekly time frame, considering the break of the downtrend, the price managed to grow to the 4.80 range. In the medium term, the expectation is that the price will continue to grow towards the supply areas of 5.50 dollars/6 dollars. In case of growth, for a better understanding of the trend's continuation, observe how the price reacts to the resistance levels. The support range is at 4 dollars and 3.50 dollars. 📈💹🚀
🟢 Keep in mind that these are just scenarios, and it's important to conduct your own analysis and consider other factors before making any trading decisions 😊📈📉
❌ (DYOR)
⭕Of course, if you have any more inquiries or require further clarification, don't hesitate to reach out. I'm here to assist you!
🔹If you found this analysis helpful, please show your support by liking and commenting. Thank you! 🚀😊 🙌

DOTUSDT.1DBased on the market data provided, the DOT/USDT pair is currently trading at 5.119 USDT. Let's analyze the technical indicators:
Relative Strength Index (RSI): The 4-hour RSI is at 58.85, indicating a slightly bullish momentum. The daily RSI is at 78.94, which is in the overbought territory and suggests a possible price correction. The weekly RSI is at 52.69, indicating neutral momentum.
Moving Average Convergence Divergence (MACD): The 4-hour and daily MACD are positive, suggesting bullish momentum. However, the weekly MACD is negative, indicating bearish momentum.
Bollinger Bands (BB): The price is near the lower band in the 4-hour timeframe, indicating potential oversold conditions. In the daily and weekly timeframes, the price is closer to the upper band, suggesting overbought conditions.
Support and Resistance Levels: The immediate support levels are at 5.008 and 4.792 in the 4-hour timeframe, and 4.531 and 4.021 in the daily timeframe. The immediate resistance levels are at 5.233 and 5.514 in the 4-hour timeframe, and 5.977 and 6.700 in the daily timeframe.
In conclusion, the technical analysis suggests mixed signals. While the 4-hour and daily timeframes indicate bullish momentum, the weekly timeframe suggests a bearish trend. The RSI is overbought on a daily basis, suggesting a potential price correction. However, the price is near the lower Bollinger Band on the 4-hour chart, suggesting potential oversold conditions. Traders should be cautious and consider both short-term and long-term trends while making decisions. This is not financial advice, and market conditions can change rapidly.

POLKADOT helloo dear trader
polkadot breakout downtrend channel and ready for pump
Dot is always pumped first, then chainlink , but in this bullish market 2023 , the link is pumped first, then dot will be pumped,
polkadot will soon be above 10 dollars.
polkadot one of the best crypto currency project
goodluck

DOT Polkadot Technical Analysis And Trade IdeaWelcome to our DOT/USDT Technical Analysis and Trade Idea. In this video, we will delve into the charts, focusing on the prevailing bearish sentiment found in the weekly (1W) and daily (1D) timeframes. Notably, our charts signal that Polkadot is currently on the verge of a resistance level, a pivotal turning point for this crypto asset. Throughout this discussion, we will explore the fundamental tenets of technical analysis, encompassing vital aspects such as analyzing the ongoing market trend, price dynamics, market structure, and other critical elements of technical analysis. As we progress through this analysis, we will meticulously examine a potential trading opportunity within the NAS100 index.
It is important to note that the insights we share in this presentation are intended solely for educational purposes and should not be construed as financial advice. Participating in the stock market and cryptocurrency trading carries a significant level of risk. Therefore, it is imperative to prudently incorporate robust risk management strategies into your trading plan to effectively navigate these challenges.

DOT/USDT 4HInterval ChartThird, we will check the DOT chart on a four-hour interval. As we can see, the price has broken the downtrend lines, creating a current uptrend which we used the blue lines to describe.
Let's start by marking support points for the price and we can see that first we have a support zone from $4.73 to $4.51, however, if the price drops lower, we can see the price return to a very strong support zone from $4.15 to $3 $.89.
Looking the other way, we can similarly determine the resistance areas that the price must face. And here we see that the price is currently fighting against a strong resistance zone from $4.92 to $5.29, and when it manages to break out of it, it will be able to move towards the resistance at $5.76.
The CHOP index indicates that there is a lot of energy for movement, on the RSI indicator we are approaching the upper limit again, and on the STOCH indicator we will soon exceed the upper limit, which should result in a rebound for the price.

Is It Finally Time To Buy DOT As Polkadot 2.0 is Coming? hello dear trader and investors
do you know( polkadot v2) faster than sol and kadena?
Is It Finally Time To Buy DOT As Polkadot 2.0 is Coming?
it is time for polkadot ’s rally
Polkadot 1.0 vs 2.0 —
A comparison between Polkadot 1.0 and Polkadot 2.0 highlights significant differences. The transition from slot leasing to a cumulative asset model will enable smaller projects to access Polkadot’s infrastructure without committing millions of dollars or locking up tokens for extended periods.
The number of available parachain slots is expected to increase from a limited 50 to a range of 500 to 1,000 cores, further expanding Polkadot’s capacity to onboard projects.
Polkadot 2.0 Launch Date —
Gavin Wood, Polkadot’s founder, has been actively involved in developing Polkadot 2.0.
While the technology is expected to be ready by late 2023, the official upgrade and release will occur in early 2024.
This timing aligns with the end of the major DOT unlock events, potentially setting the stage for a new wave of positive sentiment.
Polkadot 2.0’s new system for allocating block space could increase liquidity for the DOT token. Revenue generated from core time sales will be channeled into the Polkadot Treasury, and token holders will have a say in how these funds are distributed through governance. Periodic token burns are also being considered, which could make DOT deflationary and positively impact its price.
good luck

Will DOT break out?
DOT's price action retests the upper limit of it's 18 month downward channel...
Is momentum slowing down & swinging to the up side?

Polkadot - Potential breakoutThe cryptocurrency polkadot is about to do a break out of the downtrend and my first target is at 7$. Keep a eye on this asset, I think it could explode much higher in the coming euphoria bull market.

DOT/USDT Upward Momentum ?? Polkadot Analysis Today💎 DOT has certainly piqued our interest, achieving a breakout from the Descending Channel with a notable ascent. It would be beneficial for DOT to undergo a retesting phase initially, ensuring a stable corrective movement.
💎 Without this, DOT might reach the supply zone only to face rejection, subsequently descending to retest at the demand level or the resistance trendline of the former descending channel. However, should it manage to breach the supply zone promptly, DOT probability could advance towards its next milestone, the Bearish OB region.
💎 In the scenario of a strategic retest, it's imperative for DOT to exhibit a bounce or a sign of rejection, striving to re-engage with the supply zone and solidify its position above, thereby validating the breakout.
💎 Conversely, if DOT fails to rally, a troubling development might unfold, where DOT is unable to hold its ground at the demand zone, compromising the subsequent level. This occurrence would signify a false breakout, potentially steering DOT into a downward trajectory towards a robust support zone.

What will be the fate of DOT?We have a large diametric that has been a Polkadat symbol within this diametric for several years.
We are now in branch E of this diametric. The branch E has become a diametric itself. Now we seem to be in the F branch of E. We expect movements similar to what I drew on the chart.
For risk management, please don't forget stop loss and capital management
Comment if you have any questions
Thank You