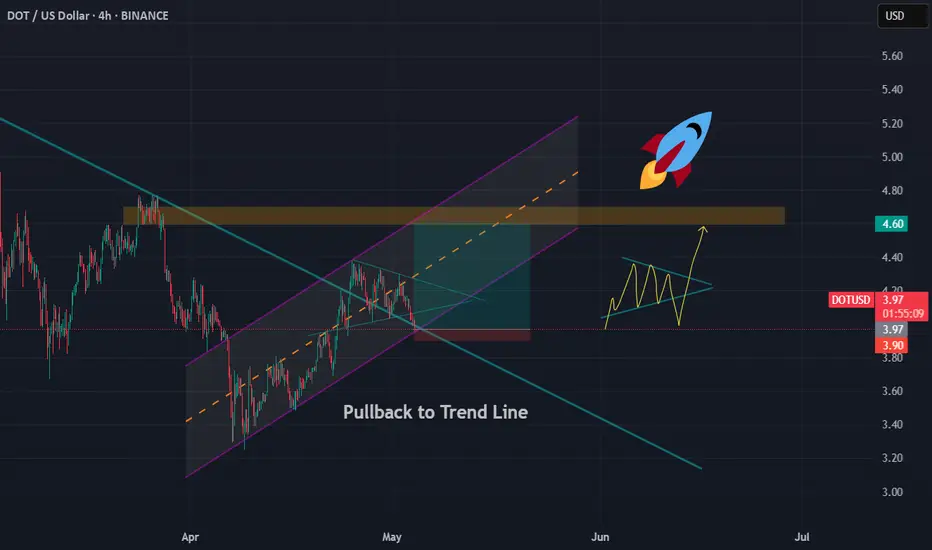
DOT : Long PositionEverything is clear..
We can get a long position because price break the trend line and is up of It.
DOT
Polkadot Setup Unfolding - Wait for the Breakout!🔍 Polkadot (DOT/USDT) Technical Breakdown
Currently analyzing DOT/USDT, and when we zoom out to the higher timeframes (📆 weekly and daily), it’s clear that price remains in a macro bearish trend 📉. We’ve recently seen a deep retracement into the upper end of the range — a region I would classify as premium pricing 💰.
Despite the recent bullish momentum 🔼, I'm exercising caution when it comes to long positions. From a value perspective, this isn’t where I want to be buying. Instead, my bias leans bearish — but only if specific criteria are met. ✅
I'm watching closely for a clear break of the current range, ideally with:
1️⃣ A market structure break
2️⃣ Strong price displacement (to confirm intent)
3️⃣ A shift in order flow and momentum to support a downside move 🚨
These concepts are influenced by a blend of Wyckoff theory and ICT (Inner Circle Trader) principles 🧠, which I walk through in detail in the video.
📚 As always, this is for educational purposes only — not financial advice. 💼❌

DOT/USDT 1H Chart UpdateDOTUSDT broke its Long-Term Resistance last week!
After consolidating in a Redistribution phase (similar to mid-April), Polkadot is now testing the $4.00 support zone.
▸ Bullish Target: If $4.00 holds, we could see a climb to $4.50 or higher!
▸ Bearish Risk: A breakdown below $4.00 might push the price to $3.90 or lower.
Eyes on $4.00 — will the bulls defend this level? Let’s talk!

DOTUSDT 1D AnalysisDOT ~ 1D Analysis
#DOT Buy when re -testing this support with a short -term target of at least 10%+ from here.

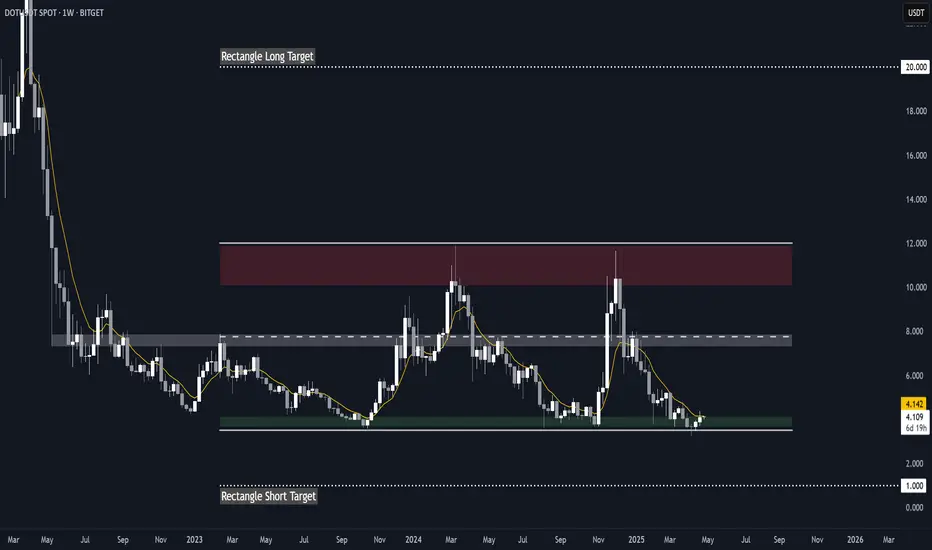
DOT RectangleBITGET:DOTUSDT has been trading in a rectangle since October 2023, with important key levels dating all the way back to May 2022. It also recently broke support, swept liquidity to $3.3 and reclaimed the demand zone, setting itself up for a potential rebound.
Key Levels to Watch
• $3.5-$4.0: Main demand zone
• ~$7.5: Rectangle midline + key S/R dating back to May 2022, could act as a strong resistance
• $10-$12: Main supply zone
Potential targets
Measured rectangle targets
• Breakout: $20
• Breakdown: $1.0
Other Considerations
Another laggard, similar to Filecoin ( ).
While it's still unclear whether these coins are rebounding or heading for a breakdown, they could offer some of the highest R/R potentials for longs, and they have very clear invalidations.
Triggers
• My long trigger for Polkadot would be a break above the 50-day EMA and the demand zone (~$4.0).
• Invalidation (and short trigger) would be a sustained break below $3.5 or a lower low below $3.3.
DOTUSDT - U should have some DOT in ur portfolio3D chart shows breakout a falling wedge pattern after a drop of 70% ... this is a strong buy signal
so keep ur eye on it! ... target is 12$
Best regards Ceciliones🎯

DOT the most important historical support!DOT / USDT
The price just toke the liquidity and come back above the most important suppprt level in dot chart with long green wick (strong buy action)
As long as the price continues to close above the current level we think for strong bounce in the coming weeks
However, if and only if the price lose this level on HTF DOT will make new lows
Conclusion: this support acts as DO or DIE for future price action … bullish as long as it stay above it but if it lost on HTF it will into strong bearish
Note: many coins have same chart
Best of wishes

DOTUSDTIt should be at $6 and then a correction and a rally to $12 and then a stronger correction and finally a major rally to $24.210
Market geometry is doing its job

#DOT/USDT#DOT
The price is moving within a descending channel on the 1-hour frame, adhering well to it, and is heading towards a strong breakout and retest.
We are seeing a bounce from the lower boundary of the descending channel, which is support at 4.05.
We have a downtrend on the RSI indicator that is about to be broken and retested, which supports the upward trend.
We are looking for stability above the 100 moving average.
Entry price: 4.08
First target: 4.10
Second target: 4.15
Third target: 4.20

DOT: The Bullish Reversal#DOT has been presenting a corrective structure since Oct 2023, likely forming a major corrective bullish wave within a broader bearish trend.
The count below suggests a potential bullish reversal soon within that larger structure.
#Polkadot

Polkadot Vs Bitcoin —Augmented Reality—1,000X Better Than Fiat!DOTBTC peaked in May 2021, it will soon be exactly four years.
The bear market bottom and lowest price was hit 3-February 2025. This week, we have a double-bottom.
A double-bottom is a bullish signal and points to a change of trend. There is another bullish signal hidden within this signal.
The low 3-Feb. was set at 0.00004134, this week (14-Apr.) it was 0.00004167, slightly higher.
The 3-Feb. session closed as a hammer, a reversal signal on its own.
The current session is also a hammer and the week closes tomorrow. Current prices or higher and a very strong bullish signal is confirmed. Lower prices wouldn't change anything, the bottom is in.
There isn't much data before 2021. The 2021 bull market here was cut short. It is hard to make any predictions and projections about how high prices can go for this pair. I can be making a huge mistake by underestimating the market, but there is nothing to go by as I work with the chart.
Here we have almost 12X potential. This wouldn't be too surprising for a Cryptocurrency trading pair within a bull market, it would be somewhat normal to see this kind of growth. That's why the mistake can be aiming too low but soon we will know.
Compared to USDT pairs, here we have to buy and hold and wait to see how the market will develop because anything goes. It can happen that these pairs peak before Bitcoin and then Bitcoin produces a final run which ends the bull market, or, these pairs produce a correction while Bitcoin prints its All-Time High, when the ATH is in, the Altcoins vs Bitcoin pairs produce a final run bigger anything we've seen before. Since Bitcoin is now worth trillions, when this money moves around the Altcoins can blow up. The second scenario is the prefered but I don't have any way of knowing which one of the two will be the case. It can happen that some pairs follow the first scenario and other pairs the second one; the ones following the second one will be the luckiest one, these can ending reaching highs in proportions that are very hard to understand. 30, 40, 50 or even 60X.
Right it is early because we are literally at bottom prices, but this wont' be forever the case. In just a few months, the sentiment will be so different that it will be hard to recall the feeling you are having today. You will be so high and feeling nice, that you might end up making more commitments than the ones you can handle, that is how good things will get.
It will become really good, make no mistake. It will be awesome. I can't wait to show you, you will be surprise and you will be so happy with the results, you will be so happy, that you will love Cryptocurrency for years to come. You will be able to hold through the entire bear market and you will be able to participate in each cycle for as long as the Internet is on. This will be our bank account, trading will be our job. Easy passive income with maximum growth.
Cryptocurrencies pay at least 1,000 times more than fiat currencies.
Thanks a lot for your continued support.
Namaste.

It's disappointing !!!Do you think this will happen, or do you see DOT below $3.5 in the future?
Give me some energy !!
✨We spend hours finding potential opportunities and writing useful ideas, we would be happy if you support us.
Best regards CobraVanguard.💚
_ _ _ _ __ _ _ _ _ _ _ _ _ _ _ _ _ _ _ _ _ _ _ _ _ _ _ _ _ _ _ _
✅Thank you, and for more ideas, hit ❤️Like❤️ and 🌟Follow🌟!
⚠️Things can change...
The markets are always changing and even with all these signals, the market changes tend to be strong and fast!!

DOT About to Break Down? Don’t Fall for the TrapYello Paradisers! Could this "bullish" pump on DOTUSDT be leading traders straight into a bear trap?
💎DOTUSDT is currently forming an ascending channel, which is historically a bearish pattern. These setups often lure in breakout traders before reversing sharply, shaking out weak hands and triggering stop-losses.
💎The price is now approaching a critical resistance zone, where the Fibonacci golden pocket overlaps with the 200 EMA — a powerful confluence. If DOTUSDT grabs liquidity above the recent highs, it would significantly increase the probability of a bearish reversal from that region.
💎For safer, more conservative traders, the best strategy here is to wait for confirmation of a bearish pattern within this area. That would offer a stronger risk-to-reward ratio while allowing more control over trade execution. Patience pays, especially when the market tempts you with low-conviction breakouts.
💎However, if price breaks out and closes decisively above the invalidation level, then the entire bearish idea becomes invalid. At that point, it’s essential to step back and reassess the structure rather than forcing a trade.
Discipline is what separates professionals from gamblers. This setup demands patience, a level head, and an understanding of risk management.
MyCryptoParadise
iFeel the success🌴

Short-Term Short Position DOT/USDT🔴 DOT/USDT – Approaching Key Short Zone
Polkadot (DOT) has formed a rising wedge after rebounding from local lows. Price is now facing a critical short zone near 3.897 – 3.985, where sellers may step in if DOT cannot sustain upward momentum.
Chart Formation: The rising wedge often indicates potential bullish exhaustion; a break below wedge support confirms a bearish bias.
Volume Consideration: Look for a surge in sell volume near entry levels to validate a short entry.
🔴 Short Position DOT/USDT
🎲 Entry Levels
Entry 1: 3.897
Entry 2: 3.985
✅ Take-Profit Targets
TP1: 3.798
TP2: 3.648
TP3: 3.472
TP4: 3.256 (extended downside if momentum persists)
❌ Invalidation Level: 4.131+
(A strong close above 4.00+ invalidates the short setup.)
🧠 Narrative: This wedge suggests a potential bearish retest if DOT fails to break higher. A rejection at 3.89 – 3.98 may send price to lower supports.
Market Context: Overall market sentiment and Bitcoin’s trend can influence DOT’s movement; a strong BTC rally could negate this setup.
⚠️ Risk Management: Place stops just above 4.131+, size positions carefully, and stay flexible if price action indicates continued strength above the wedge.
"Take Care of Risk Management for Your Account"

Polkadot: 580% An Easy WaveThis one here for Polkadot in the coming months would be an easy wave. A bullish wave that reaches 580% profits from the current level, why is that?
The Cryptocurrency market is set to enter uncharted territory. We still don't know how things will play out.
Will the market really produce the classic 6-12 months bull market after such a strong bearish cycle? Or, will the market enter a new period where Cryptocurrency becomes a new monetary standard, the default global medium of exchange?
Can a Cryptocurrency project grow for 2 years, 3 years or 10 years straight?
Are there any laws in finance or nature that prohibits the market from growing really strong?
Is there anything in this world that says, "Crypto mustn't grow!"?
The truth is that such force existed and it was pretty obvious. When this force was live and active, Cryptocurrency was having a hard time just trying to survive. While surviving, Cryptocurrency still managed to grow and did so strongly.
Right now things are different, we have the support of the biggest power in the world. Instead of surviving, we are entering a thrive phase. We are going up and it will huge, wild; who is to say that the bull market cannot extend?
Anything goes. Everything is possible, that's why 580% is an easy target for this pair.
Since the next All-Time High will go off this chart, such an easy target should happen within months, say within 90 to 120 days.
That's it. The market will grow.
Accept it and enjoy bottom prices. The best time to buy is when prices are low.
Prices are low now.
The time to buy is now.
You will be happy with the results.
Namaste.

PolkaDot DOT Is Ready For BounceHello, Skyrexains!
Looking at the dominance charts recently we predicted the altcoins run-up in the upcoming weeks and BINANCE:DOTUSDT will definitely take part in this bounce.
Let's take a look at the daily chart. Here we cans see that impulse could be already finished. We have 5 waves, true divergence between waves 3 and 5. The only one thing is that price has not reached the wave 5 target area inside the green box. But momentum is already reversing and if we will see the third green column on Awesome Oscillator it's going to be the huge confirmation for reversal. It's difficult to say if this is bear market bottom or not, but the bounce to $6.5 is very likely in April.
Best regards,
Skyrexio Team
___________________________________________________________
Please, boost this article and subscribe our page if you like analysis!

ALTCOINS | ALT Season | Buy Zones PART 2💥 SUI / BINANCE:SUIUSDT
SUI ideal buying points, weighing heavier towards the lower zone:
💥 SHIBA / BINANCE:SHIBUSDT
SHIB ideal buying zone is approaching, but ideally the lower zone is the better buy:
💥 DOT / BINANCE:DOTUSDT
Dot worries me for the reason that it has retraced nearly all the way to 2021 prices. Therefore I'll keep trades small, with modest TP zones.
BUY zone for a swing, not accumulation:
💥 PEPE / BINANCE:PEPEUSDT
PEPE buy zone seems far away, but considering how hard alts can drop in only a few days, I'd be ready with the orders, hanging heavier towards the lower zone:
💥 BINANCE / BINANCE:BNBUSDT
BINANCE shows promising swings. Ideal BUY zones include:
For the next cycle, in other words long term target, I'd watch the 1.618 at least:
This would make it an accumulation buy.
________________

DOT - Strong bounce from the ultimate low ?Bounced each time for consequent gains around 3.75, so I expect the same now
placed a SL a bit wide, a good fuel could be the 2.0 update of Polkadot but didn hear any news about it to be honest
In the other hand, lower would means I'll quit this asset for a mid/long term hehe,
Cheers

Polkadot: Shaky SupportPolkadot remains weak, barely holding onto the round $4 mark on Friday. Primarily, we soon expect another sell-off below the support at $3.67 and into the orange Target Zone between $2.40 and $1.07. Once the low of the magenta wave is reached down there, the next major impulsive movement can start and carry the price back above the resistance at $5.38. If Polkadot turns sustainably upward now and directly breaks through the $5.38 mark, the next magenta impulse wave alt. will begin prematurely. In this 20% likely alternative scenario, the corrective structure (still ongoing according to the primary scenario) would have already been completed with the low of March 11.

DOTUSD: There is no better buy entry than this.Polkadot has been inside a huge Rectangle pattern since the October 19th 2023 Low that created the S1 Zone, a wide consolidation pattern whose top is the R1 Zone. The 1D RSI is already on a HL bullish divergence, identical to both prior bottom formations on the S1 Zone. Since the 1D MA50 has already been breached, we estimate that the price will start the new bullish wave soon. There is no better buy entry than the current level. Aim for the bottom of the R1 Zone (TP = 11.500).
## If you like our free content follow our profile to get more daily ideas. ##
## Comments and likes are greatly appreciated. ##

DOT & LTC TRADE SET UPDOT LONG
Entry Price 1: $4.60
Entry Price 2: $4.40
Stop Loss: $4.10
Take Profit 1: $4.80
Take Profit 2: $5.00
Take Profit 3: $5.20
Take Profit 4: $5.50
Status: ACTIVE
LTC NEUTRAL WAITING FFOR BREAK OUT

DOT in coming days ...The pattern has broken, and now I expect the price to rise to $5.3.
Give me some energy !!
✨We spend hours finding potential opportunities and writing useful ideas, we would be happy if you support us.
Best regards CobraVanguard.💚
_ _ _ _ __ _ _ _ _ _ _ _ _ _ _ _ _ _ _ _ _ _ _ _ _ _ _ _ _ _ _ _
✅Thank you, and for more ideas, hit ❤️Like❤️ and 🌟Follow🌟!
⚠️Things can change...
The markets are always changing and even with all these signals, the market changes tend to be strong and fast!!

#DOT/USDT#DOT
The price is moving within a descending channel on the 1-hour frame, adhering well to it, and is heading for a strong breakout and retest.
We are seeing a bounce from the lower boundary of the descending channel, which is support at 4.40.
We have a downtrend on the RSI indicator that is about to be broken and retested, supporting the upward trend.
We are looking for stability above the 100 Moving Average.
Entry price: 4.43
First target: 4.50
Second target: 4.57
Third target: 4.64
