DOT/USDT Bullish Scenario💎 DOT has recently broke its support level and is currently in the phase of retesting, where the former support might act as a new resistance. There's a potential for the price to descend toward the demand zone ranging between $4.4 - $4.65.
💎Within this demand zone, there's a likelihood of the price experiencing a bounce, propelling it into an upward trajectory targeting the supply zone between $6.5 - $7.
💎However, if DOT swiftly reclaims its previous support-turned-resistance area, there's a chance it might not touch the demand zone and instead, ascend directly to challenge the resistance trendline and the supply region.
Paradisers, keep your eyes peeled for these pivotal movements! Stay informed and trade wisely. 🌴
DOT

1D: $DOT; AMAZING VALUE- PatienceMIL:DOT
If this isn't value i dont know what is. Retracing nearly ..... 100%!! as it just sleeps and sleeps until one day, DOT has RISEN. These plays are what makes your life change IF one can wait. If there is new people here, trust me when I say this..... DON'T be scared and FOOLED by the masses. They wan't you to think and somber about how crypto is dead and will never come back. Those same people are the ones massing mega bags at the darkest depths of the market.
Don't let FEAR and MANIPULATION take over your mind. We know what market's do and what history shows us. Look LEFT! Do you see a common theme?
Been there before and we rise once again!
weeeeeeeeeeeeeeee

Polkadot upward momentum !🚀 🔥 DOT today analysis
💎 It's currently hovering around a key support zone, having touched it twice, indicating potential moves on the horizon.
💎 Presently, Dot is nestled within a demand zone. If it sustains above this zone, we could witness a seamless bullish trajectory. However, if it falters, a bullish move might only materialize after a retest of the lower order block.
💎 Digging deeper, we've noticed a shift where demand transitioned into supply, leading to a notable downward shift in price. Ahead, there's a clear supply zone accompanied by bearishOB. It's highly probable that it will embark on a bullish journey to address this imbalance.
💎 In the dynamic world of crypto, staying informed and adaptable is key. Stay tuned for more updates and enjoy your trading journey

DOT. Still...?My attitude towards Polkadot is neutral. I just don’t understand where to use it and whether it makes sense. There was a lot of noise, capitalization caught up with a multi-billion $, but is it justified...? So far, it's hard to say, at first glance, no. The only thing that comes to mind is a tweet from Polkadot's official twitter that they are not a security. It seems that Gavin Wood himself wrote it in ecstasy.

DOTUSDTWith the completion of the previous trend, which was the beginning of the stop of the downward trend, here we have to wait for a break from the top to the next red zone

DOTUSDT Short Setup!DOTUSDT Technical analysis update
Short level: $5.120 - $5.150
Stop loss : $5.25
Take Profit 1 : $5.01
Take Profit 2 : $4.85
Take Profit 3 : $4.66
Always Keep Stop loss
Thanks
Hexa

Keep an eye on $DOT/USDTDid you find this crypto market analysis helpful? Stay updated about the latest crypto market update.
Please continue to follow my analysis and feel free to ask any queries, you may have. I am here to assist you.
TradingView: @FarmanBangashh

DOTUSDT 1HDOT/USDT
Watching these levels can be useful to identify potential entry points: it is currently showing supports at 5,162 and 5,119. This indicates that these are the price levels at which buying pressure has historically entered and reversed a downward trend.
Considered short-term targets or points to consider taking profits:
On the resistance side, we see hurdles at 5,238 and 5,258.
The MACD , a trend-following indicator that shows momentum, is pointing down. This can indicate a downtrend or a loss of momentum in the uptrend.
The RSI , an indicator of momentum, shows exhaustion of selling forces. This could suggest that price action may start to reverse into an uptrend if there are no more bears to push the price lower.
The Chop indicator is at 43.17 which is below 50 which is generally considered a trending market. So, although there is some degree of consolidation, the price is still moving significantly.
Given the "needle" move (a quick downward price move followed by an equally quick rebound) it is possible that price action is bouncing back, these moves are quite common on Sundays in the cryptocurrency market.

DOT one of the most perfect chartsHi Everyone;
Today we have DOT, one or the most respected chart
DOT is respecting the TA and have a potential very good growth
as you see the risk to reward is around 400 time the risk
which make it one of the best option to Invest
good luck every one

DOTUSDT 1DInterval ReviewHello everyone, I invite you to review the DOT chart in pair to USDT, on a one-day timeframe. First, we will use the yellow line to mark the uptrend line, from which, as you can see, the price breaks out at the bottom.
Moving on, we can move on to marking support areas when we start a larger correction. And here the price stays ahead of the first support zone from $5.16 to $4.97, then we have a second very strong support zone from $4.79 to $4.53, and when the price goes lower we have support at 4.20 $.
Looking the other way, we see price bounce off the $5.27 resistance, then $5.60 resistance, a third resistance at $5.94, then a fourth resistance at $6.39.
Please look at the CHOP index, which indicates that we have a lot of energy for the upcoming move, the RSI is moving around the middle of the range, while the STOCH indicator indicates crossing the lower limit, which can give a temporary sideways trend for the price or a rebound.


Review Chart DOT/USDT 4HHello everyone, I invite you to review the DOT chart in pair to USDT. First, we will use the blue lines to mark the downtrend channel where the price is moving in the upper range. And when we turn on the EMA Cross 200, we see that the price has stayed on this line, which indicates that the uptrend that was started earlier is being maintained.
Moving on, we can move on to marking support areas when we start a larger correction. And here the first support is at $4.98, then we can mark the support zone from $4.58 to $4.25, however, when the price falls below this zone, we can see a drop to around $3.93.
Looking the other way, we see that the price has reached an important resistance zone from $ 5.35 to $ 5.65, which so far has no strength to break. However, if it manages to exit the descending channel upwards and break through the resistance zone, the next resistance will appear at $6.04, and then the price can move towards the resistance at $7.20.
Take a look at the CHOP index, which indicates that the energy is starting to regain strength, the MACD indicates that we are in a local uptrend, while the RSI is back to the middle of the range, which gives room for the price to go a little higher.

Will the wind blow us down?Trading in this area is risky. Where are the risk takers in the world?
A small growth of 5% or 8% is possible, but the power is falling.
If it can grow and stabilize above the hammer price, then it is ready to fly.
Tell us your thoughts

BTCUSDT 4H Chart AnalysisBTCUSDT 4H Chart Analysis
Overview:
Bitcoin (BTC) has been experiencing range-bound trading for the past 18 days, with traders eagerly awaiting a breakout from this consolidation phase. In this report, we analyze the key levels and targets to watch for potential breakout opportunities.
Breakout Targets:
Upward Target after breakout: $38,000
Downside Target after breakdown: $27,000
Breakout Areas:
Upward Breakout Point: $31,250
Downside Breakout Point: $29,800
Technical Analysis:
BTC has been consolidating within a range, indicating indecision among market participants.
The upward breakout point at $31,250 represents a significant resistance level that needs to be surpassed for a bullish breakout to occur.
Conversely, the downside breakout point at $29,800 acts as a crucial support level that, if breached, could trigger a bearish breakdown.
Implications:
A successful upward breakout could lead BTC towards the upward target of $38,000, providing potential profit opportunities for traders.
Conversely, a downside breakdown below the $29,800 level may push BTC towards the downside target of $27,000, offering opportunities for bearish positions.
Risk Management:
It is important to note that breakouts can be accompanied by increased volatility and sudden price movements. Traders should implement proper risk management strategies to protect their capital.
Consider setting stop-loss orders and closely monitoring the price action during the breakout phase.

DOT Polkadot Double BottomIf you haven`t sold DOT here:
Now DOT (Polkadot) has exhibited a promising chart pattern with the formation of a double bottom, signaling a potential bullish reversal. This pattern suggests that the selling pressure has been absorbed, potentially paving the way for an upward price movement.
With the double bottom formation in place, DOT has the potential to experience a significant rally, and your first price target of $6.25 seems attainable. As market sentiment improves and buying interest increases, DOT could see notable upward momentum.
Looking forward to read your opinion about it!

Polkadot DOT price completing the formation of "Double bottom" ?Today's idea will be described based on the assumption that the DOTUSDT price has been forming a global trend reversal through "the Double Bottom" pattern for the past six months
Looking at the chart, we can say that DOT was actively bought around $4 in early 2023, in June 2023, and in the fall of 2020 just before the start of the bull run.
However, at the moment, the DOTUSD price has rebounded from "the bottom" relatively weakly, so buyers still have a lot of work ahead of them.
The first stage of the struggle between buyers and sellers may start around $6
The second stage, which is probably the most difficult, is to break through and fix the price of the Polkadot token above $8
The third stage is the daily dynamic growth of the DOT price in the range of $8-15. On the growth, on increased trading volumes, the "big money" will sell at least part of their DOT stocks, and the "little money" will buy and buy them. Why? Maybe because there will be a new series of news about the latest super application of parachains from Polkadot or something like that)
However, it will take at least a few more months for our rather optimistic assumptions described above to come true.
_____________________
Did you like our analysis? Leave a comment, like, and follow to get more

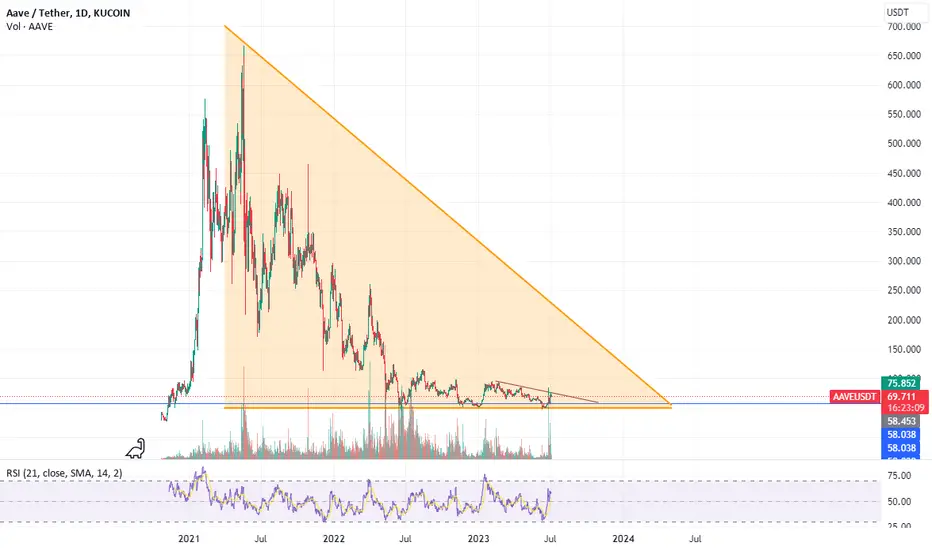
this is aave from beginingyou can see aave chart from begining BINANCE:AAVEUSDT as you can see we are in support line, this is for almost all altcoins. dont worry about futere,if you love crypto and if you believe to crypto, buy at thic prices, altcoins for examples, BINANCE:SOLUSDT , BINANCE:ADAUSDT , BINANCE:DOTUSDT , BINANCE:DASHUSDT , and,,, worth to buy now for this prices.
Finally Dot Looks Ready Seems Like Almost Ready For Massive Recovery Falling Wedge Breakout Has Already Confirmed While Macd Crossover Also Confirming Bulls Strength Decent Volume Coming In Expecting 250%+ Bullish Wave In Midterm

PolkaDot Chart Analysis Polkadot Update
Good news for #DOT enthusiasts! Despite a dip below the 20-day Exponential moving average at $4.95 between June 27 and June 30, the bulls held strong positions, indicating strategic buying at a lower price. MIL:DOT
The current focus for #PolkaDot bulls is to break and sustain the crucial resistance level of $5.56. Once this barrier is conquered, the DOT/USDT currency pair is expected to soar towards $6/$7/$8.
However, reaching $5.564 may attract substantial short-selling pressure. Nonetheless, as long as the bulls prevent the price from dropping below $4.70, the chances of a rebound towards the downward trend line significantly increase.

The 4.605-5.408 section corresponds to the buy sectionHello?
Traders, welcome.
If you "Follow", you can always get new information quickly.
Please also click "Boost".
Have a good day.
-------------------------------------
(DOTUSDT chart)
The 4.605-5.408 section corresponds to the buy section.
Therefore, it is necessary to check whether it is supported and rises in the 4.605-5.408 section.
However, since the HA-Low indicator on the 1M chart is formed at the 6.640 point, it is recommended to take an aggressive buying approach.
1st: 6.280-6.640
2nd: 7.530-7.860
3rd: 9.262
Split selling is possible when there is resistance around the 1st - 3rd above.
-------------------------------------------------- -------------------------------------------
** All descriptions are for reference only and do not guarantee profit or loss in investment.
** Even if you know other people's know-how, it takes a considerable period of time to make it your own.
** This is a chart created with my know-how.
---------------------------------

DOT 4Hinterval ReviewAs the third, we will check the DOT chart on the four-hour interval. As we can see, the price is above the uptrend line marked in yellow.
Let's start by marking the price support spots and we see that we first have support at $4.84 but if the price goes lower then we have another support at $4.72 and then we have a very strong support zone at $4.60 $ to $4.42.
Looking the other way, we can similarly determine the places of resistance that the price has to face. And here we see that currently DOT does not have enough strength to break the resistance zone from $5.04 to $5.27, but when this happens, we have another very strong resistance at $5.56, only after a positive test of this resistance we will be able to see a further price increase.
When we turn on the EMA Cross 200, we will see an attempt to return the price to a strong uptrend, but at the moment the price is fighting to maintain this trend.
The CHOP index indicates that there is still a lot of energy to be used, the MACD indicates a return to the local downtrend, while the RSI is in the process of recovering and we are approaching the lower end of the range, which may indicate the imminent end of the current recovery.

