DOT

Bullish Momentum and Important Resistance LevelsThe resistance range of $5.14 - $5.37 is being examined for DOT. If the price surpasses $5.37 level, it indicates a bullish signal, propelling it towards the resistance zone of $5.6-$6.00.
The supports are 4.70 and 4.37 levels.
The RSI level for DOT is currently at 68. The RSI is a momentum oscillator that measures the speed and change of price movements. A value of 68 suggests that DOT is experiencing relatively strong momentum and may be approaching overbought conditions. Traders and investors often consider RSI levels above 70 as an indication that an asset may be overbought and due for a potential price correction.


📉 Descending Broadening Wedge Spotted on $DOTHey traders! Today, I want to share an exciting chart pattern I've identified on MIL:DOT (Polkadot). Let's explore the descending broadening wedge and its implications for potential price action. 📊💡
Pattern: Descending Broadening Wedge 📉🔽
Symbol: MIL:DOT 💰
Overview:
A descending broadening wedge is a distinct chart pattern characterized by expanding price swings within converging trendlines. This pattern suggests increased volatility and the potential for a reversal. Let's dive into the descending broadening wedge pattern on MIL:DOT and assess its significance. ⚡💹
Key Features of the Descending Broadening Wedge on MIL:DOT :
Expanding Price Swings: Notice the widening price swings within the converging trendlines, creating the broadening pattern. This indicates growing volatility and potential market dynamics shift. 📈📉
Reversal Potential: Descending broadening wedges are often considered as reversal patterns, indicating a possible trend change. It's crucial to monitor price action for confirmation. 🚀📈
Trading Strategy:
Entry Point: Consider entering a position once MIL:DOT breaks out above the upper trendline of the descending broadening wedge. This breakout could signal a potential reversal and the beginning of an upward move. ⬆️💰
Stop-Loss: Implement a stop-loss order below the lower trendline to manage risk and protect against potential downside. ⛔️📉
Target Levels: Identify key resistance levels or previous swing highs as profit targets. Adjust your position size and take profits accordingly. 🎯📈
Risk Management:
Maintain proper risk management techniques, including position sizing, setting stop-loss orders, and adhering to your trading plan. Be aware of the risks associated with trading cryptocurrencies like $DOT. ⚠️💼💡
Disclaimer: Trading cryptocurrencies involves risks, and it's essential to conduct thorough analysis and seek professional advice before making any investment decisions.
#DescendingBroadeningWedge #DOT #Polkadot #Cryptocurrency #TrendReversal #TradingStrategy #TechnicalAnalysis #Volatility #RiskManagement
In conclusion, the descending broadening wedge pattern identified on MIL:DOT indicates a potential reversal in the making. However, it's crucial to wait for a confirmed breakout above the upper trendline before considering any trades. Stay tuned for further updates on $DOT! 💹🚀
(Note: This post is for informational purposes only and should not be considered as financial advice.) 💡💼📚

Polkadot going to $0,50? Polkadot dead?Polkadot is one of the worst performing altcoins.
On top of being a poor performer during the bullrun (compared to other coins), it is also the worst performer during the bear market.
It appears interest for polkadot has disappeared.
Polkadot has been in a downtrend for nearly 2 years. Downtrends tend to continue trending down until they continue up. There are no signs of a reversal. Based on the past history, it is possible polkadot will drop another 90% from its current valuation.
The chance of polkadot reaching its old all-time-high is, based on current situation, only 0.1%.

DOT/USDT 1DInterval Resistance and SupportHello everyone, I invite you to review the DOT chart in pair to USDT, on a one-day interval. First, we will mark two places where the price tried to break out of the EMA Cross 200 line upwards, unfortunately, both attempts ended in failure.
Further, using the yellow line, we will mark the uptrend line from which the price broke out at the bottom, we are currently moving in the downtrend channel since the beginning of the last correction.
Moving on, we can move on to marking the support spots, as we can see a strong correction caused the price to drop down to a very strong support at $4.22, in a situation where the current support did not hold the price, we could see a strong drop to around $2.
Looking the other way, we see that the price has turned around and is heading towards the $5.07 to $5.61 resistance zone. If I manage to break the first zone, I will move towards the second stronger zone from $6.06 to $6.49 and then towards resistance at $7.13.
Please look at the CHOP index, which indicates that the energy has been used, the MACD indicates that despite the current increase, we are moving in a downward trend, while the RSI, after a strong rebound, we can observe the beginning of an increase.

DOTUSDT.1DHello dear friends,
*Mars Signals Team wishes you high profits*
This is a one day time frame analysis for DOTUSDT.1D
We are in the daily time frame. As you can see, the scenario of our previous analysis is valid. And the price has managed to break into our first support zone. According to the previous candle and the compression of the price on the support zone, we expect the price to be able to move towards our first resistance line. But if that penetrates and stabilizes below our support line, we expect further decline. But as long as it fluctuates above our support line, we don't expect a price drop scenario.
Warning: This is just a suggestion and we do not guarantee profits. We advise you to analyze the chart before opening any positions.
Take care

Bearish Trend Breaks Support, Await Signs of ReversalOver the past month, the price of DOT (Polkadot's currency) has faced considerable downward pressure, moving between the support level of $5.15 and the resistance level of $5.60. However, the price recently broke below the lower boundary of Polkadot's currency range channel, indicating a bearish trend. This selling pressure was so strong that it briefly dipped below the price floor of $4.23, which had been established at the end of 2022.
Interestingly, the price of Polkadot found significant monthly support within the range of $4.24 to $3.98 and responded positively to this support level. This suggests that there is a potential for a trend reversal and upward movement in price if we observe encouraging signs of a positive reaction and a change in the trend on the daily and four-hour time frames within this support range. These signs could indicate a reduction in selling pressure and a renewed demand for DOT.
However, at present, we do not see these favorable indications on the mentioned time frames. It may be necessary to wait for signs of a trend change in the short-term, particularly for lower time frame trades. For example, on the 15-minute time frame, if the resistance level between $4.53 and $4.57 is broken, it could serve as a signal for a short-term trend reversal. It is important to closely monitor how the market responds to this monthly support level, as a strong positive reaction could result in the price of Polkadot fluctuating within the range of $4 to $5 for a certain period of time.
Considering the current market conditions, it is crucial to remain cautious and wait for confirmation of a positive trend change before making any significant trading decisions. The RSI (Relative Strength Index) value of 34 on the 4-hour timeframe suggests that the market is in a slightly oversold condition, but further analysis and confirmation are necessary to determine the direction of the price movement.

DOTUSD: Piercing Line at Shark PCZ with MACd Bullish DivergenceWe have a Piercing Line with Potential MACD Bullish DIvergence at the PCZ of a Bullish Shark on DOTUSD

DOT📊 #DOTUSDT
⏱ TIME: 1W
📝It is reaching very important areas for spot purchases, and you can make purchases in a gradual and managed manner. It has also been checked for fundamental analysis and is a sustainable and strong project for the future.
📍The initial buying limit: 4.4 $
📍The second buying limit: 3.8 $
📌TP1: 7.5 $
📌TP2: 10 $
📌TP3: 23 $
📌TP4: 54 $

DOTUSDTThe dot is approaching the important support of $5, and near this point we see candles that stick together for a long time, which many of you know as the Smart Money concept. The purpose of this concept is to engage sellers and buyers before the main movement begins. In this case, we can see that first a fake upward move is planned, then many buyers liquidate. The next move will most likely be creating a fake downward move and liquidate the sellers. But the main move after that and It will be up. When both buyers and sellers are out of the game and enough liquid is provided for the main movement. I think $5 can be a good price to open a long position with risk management.
⚠️ "Daily crypto market analyses I provide are personal opinions & not financial advice. Trading carries risks, so do your own research & seek advisor's help."

DOT/USDT 1DInterval Resistance and SupportHello everyone, I invite you to review the DOT chart in pair to USDT, on a one-day timeframe. First, using the yellow line marked with the uptrend line from which the price broke down, and then we move in the channel marked with blue lines from which the price also goes down.
When we turn on the EMA cross 200, we can see that we are below this line as to the actual downtrend, while with the Ema cross 10 and 30, the downtrend is also visible.
Going further, we can move on to marking the place of support in a situation when we increase the correction. Here you go very strong support is at $4.98, if the support doesn't hold the price we can see a drop in the area and very strong support at $4.26.
Watching the other side of the picture that the price has rebounded off the $5.53 resistance which is still the first first resistance for the price, then we have the second resistance at $5.91, then the third resistance at $6.22, then the price of the change in the direction of return at the level of $6.53.
Please enter the CHOP index, which shows that there is still energy for the next move, MACD shows that you are on the verge of returning to the downtrend, while on the RSI we have a rebound and we are approaching the border of the border which may also indicate that a correction is coming till the end.

dot bullishAlts are looking very bullish than Btc so im taking long in DOT because 4h FVG and also hidden bullish divergence on 1H time frame. I have used fibb levels for perfect entries.

DOT longDOT bounced off the lower boundary of horizontal channel. Bullish movement to resistance level at 5.425 is possible.

Polkadot - In accumulation phase - Best time to buyPolkadot is in a big accumulation phase. This is when you buy into the ticket and wait. Depending on asset it could take months to years. In this case I would consider years. Eventually it will break up above 12$ and the recovery phase will begin.
Right now polkadot is very undervalued due to whats being built on their chain.

DOT/USDT 4HInterval Resistance and SupportHello everyone, I invite you to a review of the DOT chart in pair to USDT, on a four-hour interval. First, we will use blue lines to mark the local channel of the sideways trend, from which the price is trying to go up. At this point, however, it is worth paying attention to the EMA Cross 200, from which the price clearly rebounded.
Moving on, we can move on to marking support areas when we start a larger correction. And here, the first support is at $5.46, the second support is at $5.40, the third support is at $5.35, and then we have a strong support zone from $5.30 to $5.23.
Looking the other way, we see that the price has reached an important resistance at $ 5.50 and to the place of the previously mentioned EMA Cross 200, which so far has no strength to break. However, if it manages to break above, the second resistance will be at $5.60, then the third resistance at $5.73 and the fourth resistance at $5.90.
Please look at the CHOP index, which indicates that the energy has been used, the MACD indicates that we are moving in a local uptrend, while on the RSI, after breaking the upper limit of the range, we got a quick price rebound, but further the room for increases is limited.

✴️ Polkadot Set To GrowWe have a double bottom on the Polkadot (DOTUSDT) chart, a strong support level has been activated.
✔️ If this support level breaks, we can get something like Dec./Jan., support recovery.
✔️ If this support level holds, we can get straight up and hit a new high compared to February this year.
It doesn't matter which if shows up, Polkadot Is Set To Grow!
Namaste.

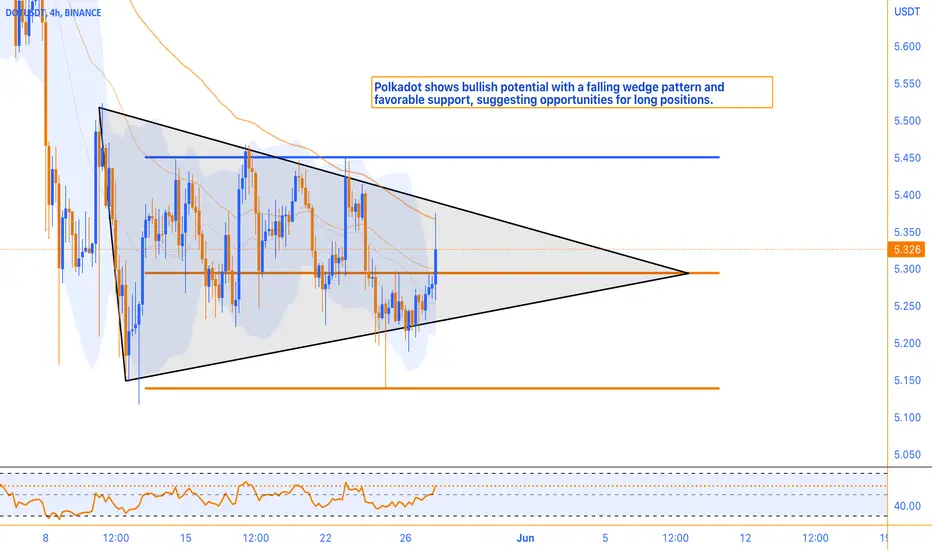
Falling Wedge Pattern, and Moderate Bullish MomentumPolkadot is currently being traded within a significant support zone, presenting a favorable trading opportunity. On smaller timeframes, a falling wedge pattern has emerged, indicating the potential for an imminent breakout from this triangular formation. Moreover, the Relative Strength Index (RSI) is currently at the 58 level, suggesting moderate bullish momentum in the stock. This implies that buying pressure is stronger than selling pressure, yet it has not reached an overbought condition. With these factors in mind, traders can consider building a long position at the support level while implementing proper risk management techniques. This analysis indicates a potential upward movement in DOT's price in the near future.
dotusdt are you rdy? 400%🧨😉400% profit for dot cryptocurrency
Be ready for a sweet long and spot purchase of currency for currency.
Entry target $4,630 and desired targets
The first target is $9,579, the second target is $19,379, and the third target is $23,466 for 2023.
The time period for these targets can be said to occur in a week to several weeks because everything is done explosively in the digital currency market.

DOT/BTC - Polkadot: Triangle_&_Wedge◳◱ Our analysis has revealed a Triangle & Wedge pattern on the MIL:DOT / CRYPTOCAP:BTC chart, signaling a period of consolidation as the price moves within the confines of this pattern. The next resistance key levels are at 0.0002012 | 0.0002053 | 0.0002129 and the major support zones are respectively at 0.0001936 | 0.0001901 | 0.0001825. A potential trend change could emerge upon a breakout from this pattern. As such, we may consider buying at the current price and aim for higher levels above the breakout level.
◰◲ General info :
▣ Name: Polkadot
▣ Rank: 13
▣ Exchanges: Binance, Kucoin, Huobipro, Gateio, Poloniex, Mexc
▣ Category/Sector: Infrastructure - Smart Contract Platforms
▣ Overview: Polkadot is a blockchain network designed to support various interconnected, application-specific sub-chains called parachains (short for parallelized chains). Each chain built within Polkadot uses Parity Technologies' Substrate modular framework, which allows developers to select specific components that suit their application-specific chain best. Polkadot refers to the entire ecosystem of parachains that plug into a single base platform known as the Relay Chain. This base platform, which also leverages Substrate, does not support application functionality but instead provides security to the network's parachains and contains Polkadot's consensus, finality, and voting logic.
◰◲ Technical Metrics :
▣ Mrkt Price: 0.0001997 ₿
▣ 24HVol: 36.868 ₿
▣ 24H Chng: 0.352%
▣ 7-Days Chng: -2.09%
▣ 1-Month Chng: -12.91%
▣ 3-Months Chng: -20.98%
◲◰ Pivot Points - Levels :
◥ Resistance: 0.0002012 | 0.0002053 | 0.0002129
◢ Support: 0.0001936 | 0.0001901 | 0.0001825
◱◳ Indicators recommendation :
▣ Oscillators: NEUTRAL
▣ Moving Averages: NEUTRAL
◰◲ Technical Indicators Summary : NEUTRAL
◲◰ Sharpe Ratios :
▣ Last 30D: -3.20
▣ Last 90D: -1.79
▣ Last 1-Y: -0.51
▣ Last 3-Y: -0.01
◲◰ Volatility :
▣ Last 30D: 0.39
▣ Last 90D: 0.58
▣ Last 1-Y: 0.76
▣ Last 3-Y: 1.60
◳◰ Market Sentiment Index :
▣ News sentiment score is 0.44 - Bearish
▣ Twitter sentiment score is 0.63 - Bullish
▣ Reddit sentiment score is 0.49 - Bearish
▣ In-depth DOTBTC technical analysis on Tradingview TA page
▣ What do you think of this analysis? Share your insights and let's discuss in the comments below. Your like, follow and support would be greatly appreciated!
◲ Disclaimer
Please note that the information and publications provided are for informational purposes only and should not be construed as financial, investment, trading, or any other type of advice or recommendation. We encourage you to conduct your own research and consult with a qualified professional before making any financial decisions. The use of the information provided is solely at your own risk.
▣ Welcome to the home of charting big: TradingView
Benefit from a ton of financial analysis features, instruments and data. Have a look around, and if you do choose to go with an upgraded plan, you'll get up to $30.
Discover it here - affiliate link -

DOT short testing Alpha PhantomHello friends, I'm testing my first phantom indicator, be patient, hopefully it will work well and by itself, it's on a 15min timeframe, so I'll be surprised, I'm not dealing with SL for now, I'll do it with pyramiding and moderate leverage with a low deposit.

are you ready for jump $dotWe are waiting to receive for long or short, but the reviews give more possibility of growth, so let's be optimistic.

DOT/USDT 1DInterval Resistance and SupportHello everyone, I invite you to review the DOT chart on a one-day interval. At the beginning, we will mark with blue lines a downward triangle in which the price is currently moving.
Now we will move on to mark the price support spots and we can see that the price has dropped below the strong support at 0.618 FIB and is now facing a very strong support at $5.02, if it goes lower then the next support is at $4.24 .
Looking the other way, we can similarly determine the places of resistance that the price has to face. And here we see that first the price will have to break the resistance zone from $5.78 to $6.18, then the second resistance zone from $6.51 to $6.84, only after breaking above these two zones will we be further increases could be observed.
The CHOP index indicates that there is energy for the next move, the MACD indicates the transition to an uptrend, while the RSI is at the lower limit, thanks to which we have room for the price to start rising.
