Is Polkadot better than Ethereum? hello dearc trader
Is Polkadot better than Ethereum?
Ethereum requires many validators per shard to provide strong validity guarantees while Polkadot can provide stronger guarantees with fewer validators per shard
you can buy in this area for mid and longterm ...
However, the Trading Beasts believe that it will stick to around $44 by the end of 2023
DOT


Is KSM Bottoming After H&S ?After recently completing a classic head and shoulders pattern KSM seems to be attempting to bottom. The recent low is a relevant area to the December move up, though I was hoping to visit my lower OB, I think with how oversold we are and being in relevant support. This could be a good area to begin scaling in, keeping in mind we are still waiting for confirmation of BTC bottoming as it will greatly influence alts.
Just some food for thought!

🔥DOT IS AT STRONG SUPPORT: 2 TARGETS AFTER THE KEY LEVEL TEST🔥Hi, friends! DOT reach the strong support level and already make a false breakout which shows the price strength.
📊 TRADING PLAN FOR DOT:
1. the false breakout of the key level(already happened)
2. volume growth at the bottom
3. bullish BTC is a must-have for altcoins growth
✅ THE MAIN TARGETS FOR DOT:
🔥 $6.2-6.4 - the value area and strong resistance
🔥 $7 - the key level
💻Friends, press the "boost"🚀 button, write comments, and share with your friends - it will be the best THANK YOU.
P.S. Personally, I open an entry if the price shows it according to my strategy.
Always do your analysis before making a trade.

DOTUSDT.1DHello dear friends,
*Mars Signals Team wishes you high profits*
This is a one day time frame analysis for DOTUSDT.1D
We are in the one day time frame. As you can see, the price is fluctuating towards the first static support line. We expect it to once again support the price and start moving towards the first resistance line. But if it penetrates and stabilizes below the first support line, we expect more fall.
Warning: This is just a suggestion and we do not guarantee profits. We advise you to analyze the chart before opening any positions.
Take care

Polkadot DOT. Maybe it's time to start growing, or not?)Dot's price was in the "group of leaders" that were the first to break out of the prolonged downward trend.
However, "the winner music didn't last long", after a 2-month rise in the DOTUSDT price with a result of +90%, consolidation has been going on for the 3rd month.
Roughly speaking, there is nowhere to fall below the price of the Polkadot token. The critical level from below is $4.83.
If we model Elliot waves on the current trading situation on the DOTUSD chart, we can assume that wave (2) is close to completion.
The next wave is an upward wave (3), with the most conservative targets for its growth ranging from $10-10.50 to $12.30.
_____________________
Did you like our analysis? Leave a comment, like, and follow to get more

DOT/USDT 1D Interval ReviewHello everyone, let's look at the DOT to USDT chart on a one-day time frame. As you can see, the price is moving below the downtrend line.
Let's start with the support line and as you can see the first support in the near future is $5, if the support is broken then the next support is $4.72, and then the third support at $4.50.
Now let's move on to the resistance line, as you can see the first resistance is at $5.56, if it is broken then the next resistance will be at $5.83, the third at $6.05 and the fourth at $6.27.
Looking at the CHOP indicator, we see that the energy is gathering strength, the MACD remains in a downward trend, while the RSI is moving at the lower limit, which affected the slowdown of the correction.

Peaks and ValleysThe value of Polkadat has exhibited a consistent decline over the course of the past month. Notably, the currency experienced a significant decrease of 26% in its price, responding unfavorably to resistance encountered at the precise level of $7. Subsequently, the previously established price floor of this currency was temporarily breached within the $5.15 range, followed by a positive recovery within said range.
A promising long-term scenario emerges if the resistance levels of $5.62 and $5.80 are successfully surpassed, indicating a potentially bullish trend within the 4-hour time frame for this currency. In such an event, buyers may set their targets within the price range of $6, $6.30, $7, and $8 to $8.40.
Currently, there is an observed corner pattern occurring between the upper limit of the medium-term descending channel and the descending trend line. Thus, breaking through these resistance levels would confirm the pattern.
Considering the short term, it is worth noting that a former robust support has now transformed into a formidable resistance, while a lower support range remains strong. Consequently, there exists the possibility of a range-bound trend.


DOT Watchout for Resistance LvelDOT is near its Resistance level at $5.65. There is 2 Possible scenarios, Yellow and Red.
Yellow: DOT created double top pattern and if $5.65 Resistance will be broken it can move to its next Resistance as a trend line + EMA 200 from where I am expecting a continuation of bullish trend.
Red: Coin's price will keep moving inside the triangle until we eventually will see a break out.
In both scenarios DOT has the next target at $7.3.
Trade safely.

polkadot usdt target 6 7 8 10 usdt polkadot 6 usdt target lekar chalo or 7 8 usdt bhi jayega sl lgana 5.1 ka target 6 doler ka lekar chalo

Polkadot [DOT] to rebound from March lowPolkadot breached the previous support zone of $5.60 - $5.87 (cyan). But the drop eased at the March low of $5.15. The March low level is also a daily bullish order block (white) formed on 10 March.
Both the RSI and CMF were negative. But CMF had an uptick - evidence of capital inflows.
If the March low holds, DOT could rally to $6.05, a key resistance level in January and February. More ambitious targets are $6.6 and $7.
A drop below $5.1 will invalidate the idea.
Entry: $5.40 (above March low)
Target: $6.05 (support-cum-resistance)
Stop loss: $5.096 (below March low)
RR: 2

POLKADOT: Classic Accumulation, Rally Phase NextBINANCE:DOTUSDT
Hi Traders, Investors and Speculators of the Charts 📈📉
Ev here. Been trading crypto since 2017 and later got into stocks. I have 3 board exams on financial markets and studied economics from a top tier university for a year.
In today's analysis, POLKADOT presents a great buying opportunity with a low risk and high reward setup. Currently trading in accumulation phase of the Wyckoff Method market cycle phases, you may still get another chance to buy lower BUT expect the price to continue trading in the accumulation zone ranges (within the support zone and resistance one pointed out in the green box) . The timeframe of six months is significant because most market cycles / phases start to show signs of change after 6 months of a specific trend being observed as in this case, a bearish trend was observed for about 6 months.
After successfully confirming a bottom on both the chart as well as on the Technical Indicator, flashing an oversold with the built in RSI, it seems that the most logical next phase is the upwards phase, however you might need some patience as to "when" this rally will happen.
_______________________
📢Follow us here on TradingView for daily updates and trade ideas on crypto , stocks and commodities 💎Hit like & Follow 👍
We thank you for your support !
CryptoCheck

POLKADOT heloo dear traders
Polkadot is known as a layer-0 metaprotocol because it underlies and describes a format for a network of layer 1 blockchains known as parachains (parallel chains). As a metaprotocol, Polkadot is also capable of autonomously and forklessly updating its own codebase via on-chain governance according to the will of its token holder community.
Polkadot provides a foundation to support a decentralized web, controlled by its users, and to simplify the creation of new applications, institutions and services.
The Polkadot protocol can connect public and private chains, permissionless networks, oracles and future technologies, allowing these independent blockchains to trustlessly share information and transactions through the Polkadot Relay Chain (explained further down).
Polkadot’s native DOT token serves three clear purposes: staking for operations and security, facilitating network governance, and bonding tokens to connect parachains .
good luck

DOT/USDT 1DInterval Resistance and SupportHello everyone, let's look at the DOT to USDT chart on a one-day time frame. As you can see, the price is moving below the downtrend line.
Let's start with the support line and as you can see the first support in the near future is $ 5.30, if the support is broken then the next support is $ 4.83 and $ 4.24.
Now let's go to the resistance line, as you can see the first resistance is $ 5.78, if you manage to break it, the next resistance will be $ 6.04, $ 6.26 and $ 6.48.
Looking at the CHOP indicator, we see that there is still a lot of energy to continue the move, the MACD remains in a downtrend, while the RSI is approaching the lower end of the range, which may indicate the imminent end of the correction in the coming days.

Dot Looking Good For decent recovery Has Already Bottomed Out Falling wedge breakout Has Already Done Retesting In Process Incase Of Successful Retest Expecting Decent Recovery Expecting 240 to 270% Bullish Move

W10-33 DOT BULLISH IDEAPotential Bullish Entry Dow Theory In Place -
Higher High and Higher Low Expected in Place
Formation of double bottom coupled with bullish divergence (Bullish reversal pattern)
Entry, SL & TP Levels are defined.

DOT/USDT 4HInterval Resistance and SupportHello everyone, let's look at the DOT to USDT chart on a one-day time frame. As you can see, the price is moving below the uptrend line.
Let's start with the support line and as you can see the first support in the near future is $ 5.66, which currently held the price, if the support is broken then the next support is $ 5.33 and $ 4.85.
Now let's move on to the resistance line, as you can see the first resistance is $ 6.04, if you manage to break it, the next resistance will be $ 6.31, $ 6.54 and $ 6.76.
Looking at the CHOP indicator, we see that most of the energy has been used, the MACD indicates an ongoing downtrend, while the RSI has a visible rebound and we are approaching the lower limit, which may change the trend.

[polkadot] by qikoBehold DOT,
Embarking from $ 2, soaring to its zenith at $ 55, DOT boasts a remarkable 2673% escalation.
Mirroring numerous counterparts in the market, we've traced five descending waves, delineating the market's novel trend.
Anticipate a profound retracement to $4.5 within the local timeframe, prior to an inversion culminating Wave C. Subsequent to Wave C's completion, the downward trajectory shall persist.
Wave B Target: 4.50
Wave C Target: 13.50

DOT/USDT 4HInterval ReviewHello everyone, let's look at the DOT to USDT chart on a 4-hour timeframe. As you can see, the price is moving below the downtrend line.
Let's start with the support line and as you can see the first support in the near future is the support zone from $5.93 to $5.75, if the support is broken then the next support is $5.61, $5.46 and $5.26.
Now let's move on to the resistance line, as you can see the first resistance is $6.2, if you manage to break it, the next resistance will be $6.47, $6.69 and $6.90.
Looking at the CHOP indicator, we see that most of the energy has been used, the MACD indicates a local uptrend, while the RSI is approaching the upper limit, which may also slow down the current upward movement.

DOTUSDT - 1HDOTUSDT - 1H
Bullish trough formed, at this moment the DOT is heading towards the upper edge of the trough which is at 6,276. There was an update regarding the DOT stake, among the resolutions is
• Increase the minimum number of tokens to create a nomination pool from 200 DOT to 500 DOT;
• Polkadot now supports fast unstake! Nominators can use the quick unbundle if the bet has not been active in the BondingDuration era in the past to unbounce their funds without waiting for the unbinding period.
Here are the supports and resistances:
Support 6098 / 6004
Resistances: 6,216 / 6,274
RSI: Exhaustion Buyer Forces
MACD: Positive
EMAS : Pointing upwards

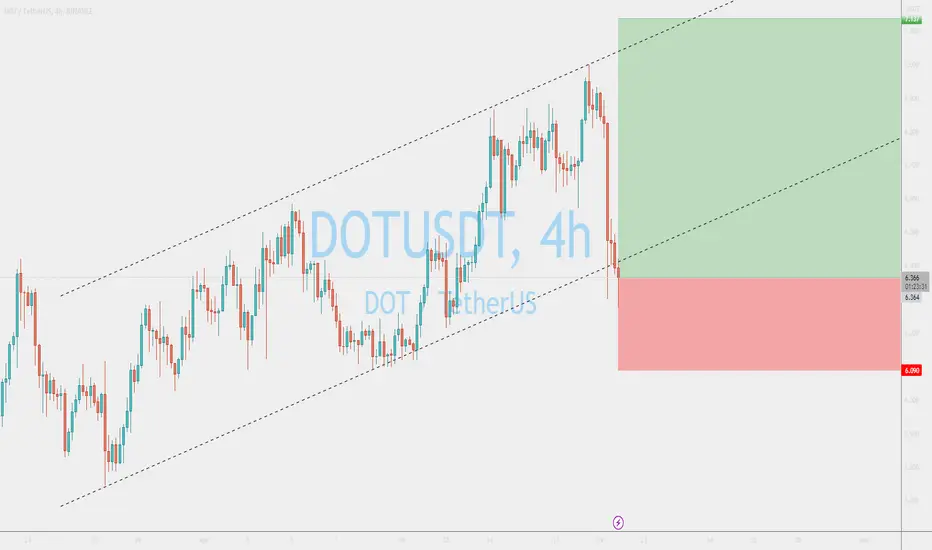
DOTUSDT interesting price actionDOTUSDT is currently trading at the bottom of the ascending channel. A very interesting buying opportunity indeed. We are certainly taking this one serously.
Polkadot Mid-Range Decisions DOT, great potential with SEC considering labeling the coin as a commodity. When looking I feel neutral about the chart, we see a change of structure & yet not much impulsiveness during the April alt-coin rally. A test of lower support seems probable if the BTC retracement is coming in the following months and maybe even new lows.
