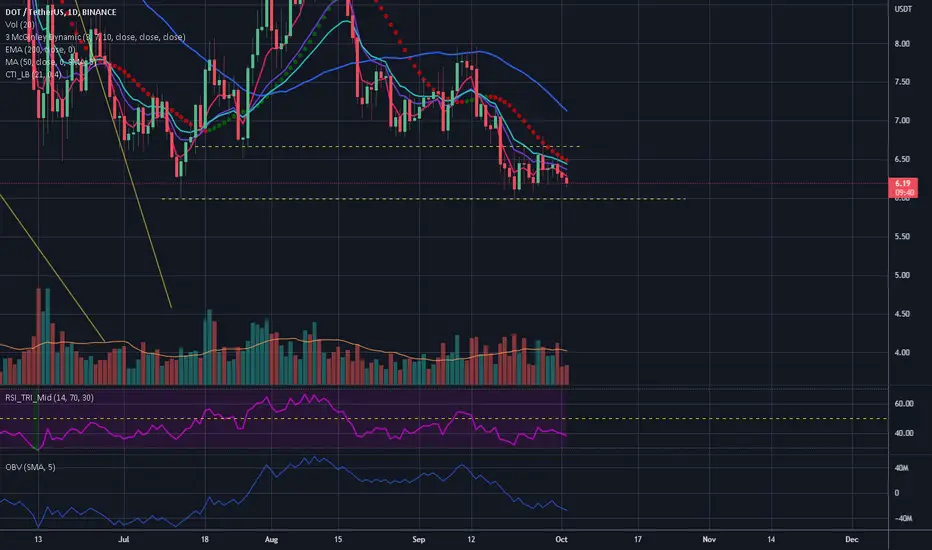
1D DOTUSDT ReviewHi everyone, let's take a look at the 1 day DOTUSDT chart.
Let's start with the fact that for some time the dot price has been moving in the channel marked with blue lines, which can be potentially used for short-term plays.
But let's see that the bottom of the current channel is also a support zone for the price from $ 6.28 to $ 6.13.
If it is possible to exit the current channel upwards, the price has to cross two important resistance zones, the first one is from $ 6.75 to $ 7.00, and let's note that the price has already turned back in this zone. Next we have a second important resistance zone from $ 7.25 to $ 7.60.
It is worth mentioning that looking at the long term, the price moves in the triangle marked with yellow lines and at this point entering the first resistance zone or breaking it would also leave the current triangle.
Now let's look at the CHOP indicator which shows that we have a lot of energy in the 1-day interval, but the MACD indicates that we are still in a downward trend. When the MACD shows a clear cross between the red line and the blue line from below, it may be a confirmation of a shift from the long-term trend to an uptrend.
DOT

DOT.Usdt (Y22.P4.Video1).short term trading apportunitiesWe look at the overall situation for DOT now and how it fits into the bigger picture from a Elliot wave count and formation perspective. We also apply our fibonacci levels.
For more confluence, add your MA and use the indicators of your choice.
All the best,
S.SAri

DOT USDT SHORTHere is DOTUSDT short signal
Stoploss is must
There is 2 entries if someone miss the firat they can join from second entry
Hopefully you like this

DOT ascendingThe end of the broken triangle is up
The first and most important resistance is 6.80
The second and important resistance is 7.30
There is a high possibility that it will go up to 8.80

Polkadot (DOT) - October 5Hello?
Welcome, traders.
By "following", you can always get new information quickly.
Please also click "Boost".
Have a good day.
-------------------------------------
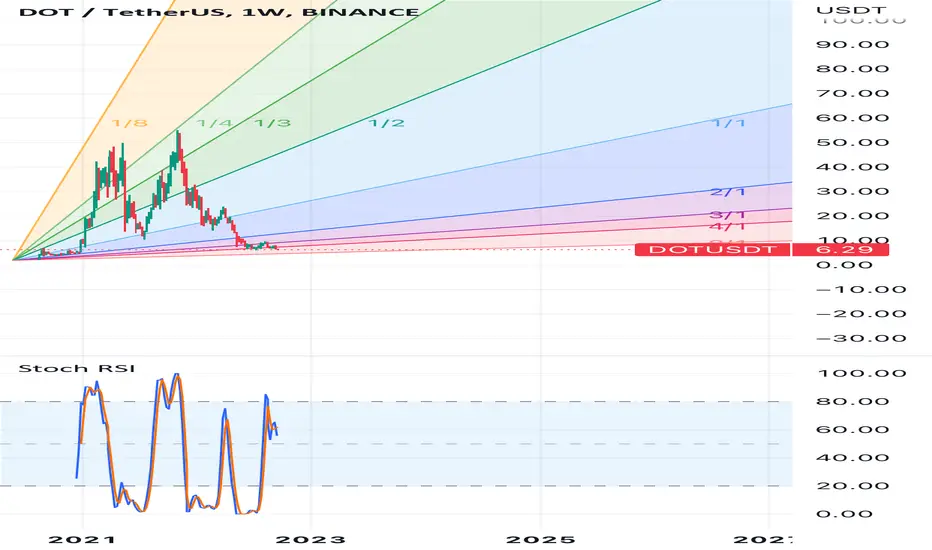
(DOTUSDT 1W Chart)
Whether or not it can move higher than 7.16 is the key.
(1D chart)
1st resistance: 7.16-7.74
2nd resistance: 9.26-10.13
A volume profile section is being formed around 6.28.
So, the key is whether we can find support and move up around 6.28.
If it fails to move higher, it is expected to move towards the 5.11 area.
------------------------------------------------------------ -------------------------------------------
** All descriptions are for reference only and do not guarantee a profit or loss in investment.
** If you share this chart, you can use the indicators normally.
** The MRHAB-T indicator contains indicators that indicate support and resistance points.
** SR_R_C indicators are displayed as StochRSI(line), RSI(columns), CCI(bgcolor).
** CCI indicator is expressed as overbought range (CCI > +100) and oversold range (CCI < -100).
(Short-term Stop Loss can be said to be a point where profit and loss can be preserved or additional entry can be made through split trading. It is a short-term investment perspective.)
---------------------------------

DOT / USDT 4H CHART - Targets and Stoploss!Hello everyone, let's take a look at the 4H DOT to USDT chart as you can see that the price is moving in the channel marked by the yellow lines and that we are at the upper end of that channel.
Let's start by setting goals for the near future that we can consider:
T1 = $ 6.46
T2 = $ 6.76
T3 = $ 7.01
T4 = $ 7.26
and
T5 = $ 7.60
Now let's move on to the stop loss in case of further market declines:
SL1 = $ 6.38
SL2 = $ 6.28
SL3 = $ 6.14
and
SL4 = $ 5.96
Looking at the CHOP indicator, we can see that in the 4H range we still have a lot of energy for movement, and the MACD indicator shows a local upward trend.

🚀🔥Long on DOT: same situation as with XRP before 40% PUMP!Hi friends! Just take a look on the chart and volume indicator. Do you see how many times the whales buy the bottom of DOT? I think they do it to make money unlike the retail traders who buy at the top and sell in loss).
The spike of the volume is always at the bottom, as you can see on the indicator. This means that the big players might already accumulate enough DOTs. The same situation were to XRP before the PUMP:
1. a lot of buyers at the bottom
2. lost interest to the coin from retail investors/trader
📊 I see this preconditions to open a long:
🔥squeeze to the upper trendline
You can try to open a local trade on the wedge breakout if you are the intaday trader.
🔥 bulls BUY limit order wall which is support the price and doesn't let it to fall
🔥 bullish BTC pull the altcoins to the top.
🚩 I use DOM and Footprint dcalping tools for the purpose of identifing the big players. Big players are the reachest on the market and as you know they choose the right size in the most cases. I prefer to follow the whales.
✅ The targets for the long:
1. $7-7.33 - the closest value area and resistance
2. $8.05 - the key level
4. $9-10 is importan psychological value area for traders. A lot of them will book the profit here
🔥 I also recommend you to book profit at least 25% when the price reach the targets.
💻Friends, press the "boost"🚀 button, write comments and share with your friends - it will be the best THANK YOU.
P.S. Personally, I open an entry if the price shows it according to my strategy.
Always do your analysis before making a trade

Maybe is late to short but if you wanna try....Yesterday I posted a short signal on ETH but today I noticed that DOT is in the exact same situation even thought maybe is too late to enter this one.
Notice the last two days session VLPR with POC at the same level (I'm trying to implement this VLPR in my TA):
The first and very close support is 5.98USDT but I've an alert set at 5.17 where I think I might buy some to hold if the market will look bottomed for when/if we go there.

Trade #10 DOTEntry Zone
0.6108 To 6.088
Save Asset Profit 1 - 6.140
Profit 2 - 6.280
SL 6.049
Max Profit 6.444
Reach me on message if you need anything!!! Cheers

DOT inside ascending channel#DOT/USDT
$DOT is trading inside ascending channel, and now price is near and above lower line of this zone.
🐻 holding the descending resistance and break down from lower line of channel will shape a bearish flag pattern that will drop price to somewhere around $0.57
🐮 but holding the lower line and break out from descending resistance can increase price toward upper line of ascending channel.

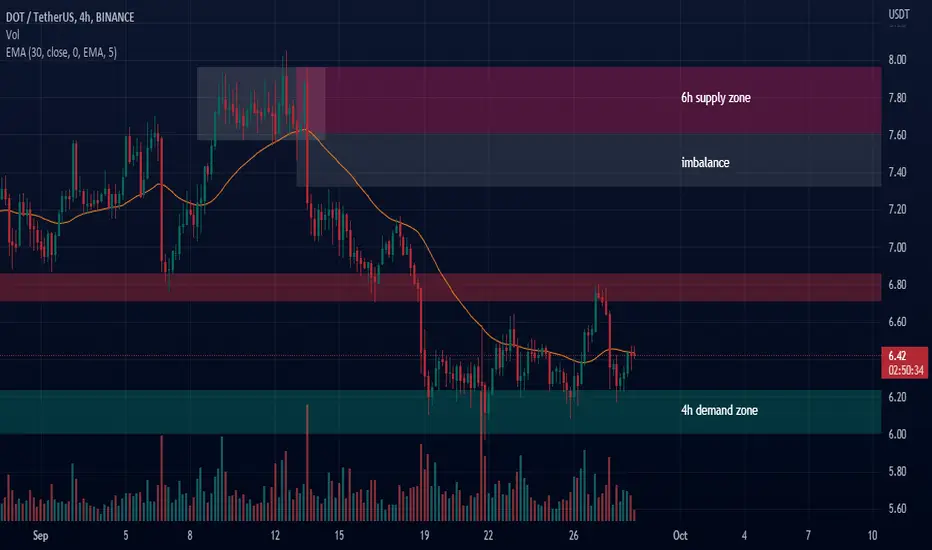
Two resistance ranges!DOT had a range trend over the past week. Its price has fluctuated between the two resistance support ranges considered on the chart in the past. Support is in the range of $5.8 to $6, and resistance ranges from $6.6 to $6.8. We can consider a range trend in the 4-hour time frame. Due to the strong selling pressure in the previous bearish wave, there is a possibility that the range trend will continue.
Dynamic resistance is also considered in the current range on the chart. For the trend to be bullish, both resistances must be strongly broken to the upside, so we can expect the trend to change from bearish to bullish in the 4-hour time frame. There is still no sign of buyer strength on the weekly time frame, and there is a possibility of a retest of support levels. The Ichimoku indicator on the weekly time frame shows the current support levels to be very strong. So this month, there is potential for price growth after a fake support break.

LINK, DOT, FIL & ICP - Coincidence ?Hello TradingView Family / Fellow Traders. This is Richard, also known as theSignalyst.
I find these 4 altcoins interesting.
📌LINK, DOT, FIL and ICP have been stuck inside a range 5.0 and 10.0
For the bulls to take over, we need a break above the 10.0 round number and resistance.
Meanwhile, as we approach the 5.0 round number / demand zone, we will be looking for short-term buy setups.
What a coincidence! or is it? 😉
What do you think? Is there any correlation among these 4?
Always follow your trading plan regarding entry, risk management, and trade management.
Good luck!
All Strategies Are Good; If Managed Properly!
~Rich


DOT/USDT Downward wedge Secondary trend.Secondary trend. The price is near the dynamic support of the uptrend. A downtrend wedge has formed (secondary downtrend). Potential trend reversal zone in case of its breakthrough.
Important support/resistance zones, trend and formations shown on the chart. At the moment it is interesting to work, because of the intersection zone of the uptrend (green) and the downtrend (secondary).
Also there is a probability of breaking out stops before the reversal, as a rule, all put them under the trend line, it is important that the price does not stay under it for a long time.
DOT/USDT Main Trend. Wedge.

DAY 12: #DOTUSDT (#SHORT) (30M TF)#DOTUSDT (#SHORT)
2% of the deposit
Margin: isolated
⚖️Leverage: x10-20
🗝Entry point: 6.485-6.500
🎯target 1 - 6.407
🎯target 2 - 6.326
🎯target 3 - 6.238
🎯target 4 - 6.156
🎯target 5 - 6.078
❌ stop loss: 6.602
(PENDING ORDERS - 6.550 and 6.576 2%)

Analysis UPDATE DOT/USDT in 4Hour 🎲As we discussed in the previous analysis of Cryptocurrency, we said that with the loss of the support area of $6.50, the price will reach the daily support of $6.00. If this $6 support area is lost, the price is expected to react to the $5.5 support level. Otherwise, by stabilizing the price above 6.8 dollars, it has the ability to reach 7.2 dollars and 750 dollars.
Arztoday Team🌈
Analyzer✍: AR.Rashidi

DOTUSDT Long SignalThis killer gem is long waiting and making up an upward continuation sooner. I am highly bullish on DOTUSDT and it will be matter of weeks before it explodes to the new highs.
My setup is as follows:
Entries: 5.35 - 5.75
Short Term: 5.92, 6.10, 6.24
Mid-Term: 6.45, 6.84, 7.10 , 7.58
Long Term: 9 - 29
Please be aware with your money!

Dot (polkadot)Around 4-3$ will be the best buy
If its it can reach 160 $ which is massive gains
The most upgrades and research done this year on it
Great market cap
Ill buy some when it reach 4$ for long term
Polkadot (DOT) - September 25Hello?
Welcome, traders.
By "following", you can always get new information quickly.
Please also click "Like".
Have a good day.
-------------------------------------
(DOTUSDT 1W Chart)
The key is whether you can climb to the 11.72-14.93 section.
To do that, we need to see if it can rise above 7.16.
(1D chart)
If it fails to rise above the downtrend line (1), it is expected to decline towards the 4.16-5.11 section.
The 11.72-14.93 section is a trend-determining section and is a strong support and resistance section.
Therefore, as we get closer to the 11.72-14.93 range, psychologically, if we don't buy now, we will continue to feel like we are about to surge.
Therefore, you should buy after confirming that it is supported by rising to the 11.72-14.93 section.
Otherwise, you will most likely make the mistake of buying at the high.
The final section where you can buy is possible when you see support in the 7.16-7.74 section.
If you buy in this range, in the short term, you can take profit when you find resistance in the 9.26-10.13 range.
------------------------------------------------------------ -------------------------------------------
** All descriptions are for reference only and do not guarantee a profit or loss in investment.
** If you share this chart, you can use the indicators normally.
** The MRHAB-T indicator contains indicators that indicate support and resistance points.
** Background color of Long/Short-S indicator: RSI oversold and overbought sections
** Background color of CCI-C indicator: When the short-term CCI line is below -100 and above +100, oversold and overbought sections are displayed.
** The OBV indicator was re-created by applying a formula to the DepthHouse Trading indicator, an indicator disclosed by oh92. (Thanks for this.)
(Short-term Stop Loss can be said to be a point where profit and loss can be preserved or additional entry can be made through split trading. It is a short-term investment perspective.)
---------------------------------

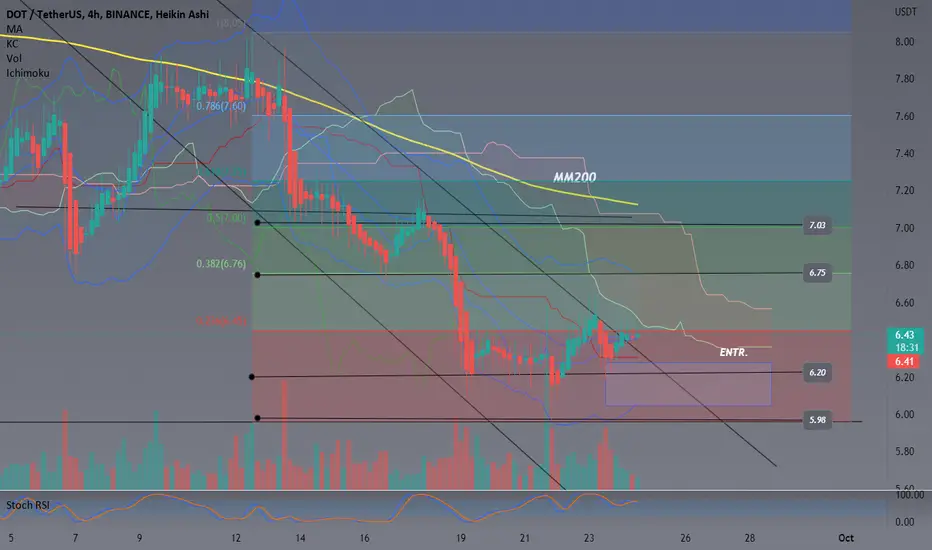
DOT USDT 4H - SWING TRADEDOTUSDT 4H – technical factors such as the 200-period moving average, coinciding with the monthly VWAP, points to an asset appreciation, it may experience resistance when passing through the ichimoku cloud, but it will quickly reach MM200. we can expect an advance to the $7.0 target however, let's wait for the DOT to reach $6.20 to make an entry. So from the limit order to the proposed target, we would have an average profit of 12% in the spot.
Operation to last around 7 days.
Entry price: $6.20
Exit Price: $7.00
Stop Loss: $5.98
****IMPORTANT NOT TO LEVERAGE FOR THE SUCCESS OF THE OPERATION***
In fundamental terms DOT, the very high octane coin, is a governance token, meaning that token holders have control over the Polkadot protocol through voting. It is also used to validate transactions through staking and to link Polkadot parachains (parallel blockchains).
If in doubt, call one of the administrators.
** Not an investment tip.
Polkadot longPolkadot broke trough off the upper boundary of descending channel. Bullish movement to resistance level at 7.6 is expected to happen.
