$DOT long?A reclaim of the monthly level with successful breakout of the trendline might be a good long trade opportunity provided it holds the level and an easy invalidation would be the recent wick lows.
DOT

DOT/BTC Secondary TrendSecondary trend. The graph is logarithmic. Timeframe 3 days. A falling wedge is forming in this secondary trend.
The % growth / fall of the price in the event of the development of certain price movements (breakthrough / no breakthrough, fixing / not fixing) relative to key levels and zones is shown on the chart.
The same indicators on a line chart.
Main trend.
A huge harmonious pattern is formed, with impressive target.
DOT/BTC Main trend

DOT adam&eve and daily trend lines#DOT/USDT
$DOT shaped an inverted Adam and Eve pattern.
🐻 break down from support zone can drop price to daily descending trend line, around $4.5 or even lower.
🐮 holding the support zone can increase price to descending trend line and resistance zone as sideways move.

DOT/USDT IS LOOKING BULLISH!!Here's the chart of DOT/USDT. Formed a bullish bat pattren. Dot is one of the best projectes for hold term hold. Targets
Short Term : 8-11-13
Long term : 55-72-100.

MY MINIMALIST CHART ANALYSIS FOR POLKADOT06.16..22
0420H +8 SINGAPORE
Disclaimer:
The findings of the following analysis are the sole opinions of the publisher of this idea and should not be taken as a piece of investment advice.
My Published Ideas are not 100% Accurate. There are many factors at a given time that can change the forecast.
ALERT:
My Bearish Bias: I do think that It will reach the 3.7 USD ZONE as it follows the trajectory of $BTC
Based on VITAL SIGNS ( RSI, STOCH, VOL., MA VOL.) Looks healthy and about at the bottom.
1. RSI 28: about RIPE for ENTRY
2. STOCHS at the almost LOW 21.6/22, looking at a correction anytime soon this week.
3. Volume on the sell side has increased, the spike that we were looking for. This means we have a lot of supply in the market. BUYERS are coming in for this kill.
4. If it breaks the 6.6 zone, the market will try to find strong support at the 3.3 zone, If it does not break, the 7 zone a zone of capitulation will be the reversal of the trend.
5. 3 entry points marked in orange price notes.
Looking back since the beginning of the year,
the Market had amazingly moved along the TOPS and BOTTOMS of our BOXES, signifying TURNING POINTS of PRICE ACTION, and verified by major FIB levels.
Hoping that this MINIMALIST BOX CHART ANALYSIS will efficiently help you with your DYOR as we Enter a NEW SWING CYCLE.
INSTRUCTIONS:
HOW TO USE THIS MINIMALIST CHART a.k.a (Bento Box)
"Follow the white rabbit!"
Just Follow the TOPS and BOTTOMS of the BOXES as a GUIDE to where the MARKET will take you.
TARGET ZONE IDENTIFICATION:
The LARGE BOXES (Tops and Bottoms) are MAJOR turning points that will occur sometime in the future. While the SMALL BOXES (Tops and Bottoms) are MINOR turning points.
These can be entries to a BUY/ SELL POSITION, EXIT/PARTIAL EXIT/TOP-UP AREAS, as well as Support and resistance levels
Also includes MAXIMUM TARGET EXIT AREA OF VALUE - CONSERVATIVE (If price action conditions are right at that given moment.)
If it cannot break a TOP or BOTTOM of a BOX, It signifies a reversal.
NOTE:
1. That PRICE TARGETS for ENTRY and EXITS are DYNAMIC and can CHANGE from time to time.
2. Created a MONTHLY, WEEKLY & DAILY Analysis of a MARKET'S CHARACTER.
3. My Minimalist BOXES are designed for SWING TRADES at the LOWEST or START of a SWING CYCLE.
4. At times I will include a WAY BEYOND PARABOLIC PRICE TARGET, depending on The Character of the Market (CRYPTOS ONLY).
5. DYOR for your Fundamentals, Volume, Chart Patterns, Candlestick Math, FIB COILS ( ABC ), Price Action, FIB LEVELS, Market Dynamics, especially institutional and retailer trading psychology.
Wishing you all The Best Trades and Thank you all for your Appreciation and Support of My Work.
Much thanks to My 3 Mentors. They are so much of a Blessing that I also wish to share my knowledge.
Vive Le Autist!
Vive Le Diamond Hands!

DOTUSD Long Term Bullish Projectioni am Looking #Dotcoin 80$ and 200$
Time is Money
Best regards Zeeshan Butt

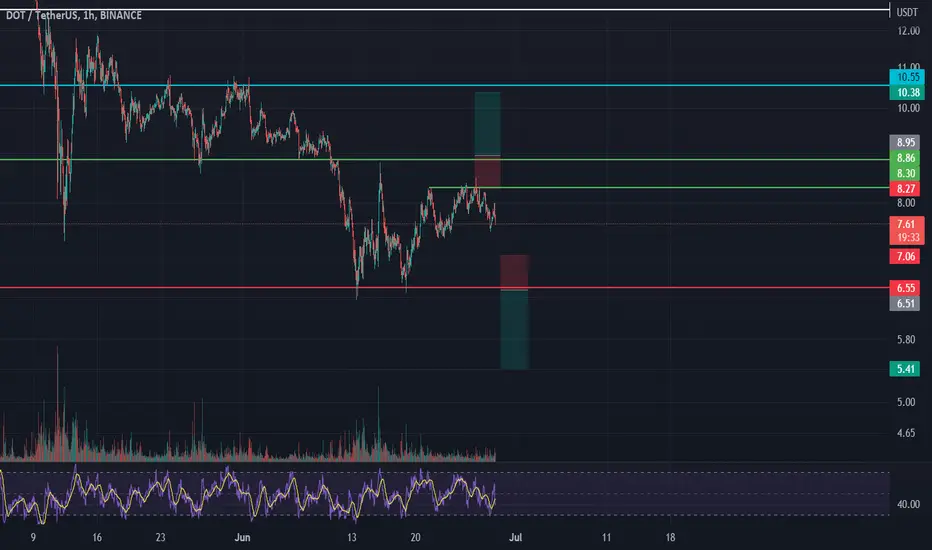
DOT
when the green line (8.86) and Confirmed by candle in 1H we can buy it with RR2
on the other hand if red line (6.55) broken and confirmed by candle in 1H we can sell it with RR2
Dot usdt 4 h chart2 different scenarios for dot showed by green and red arrow
Strong resistant at 8.5 dollar (longterm desceniding trendline and resistant level) also divergent on 4h chart shows the weakness of buyers but good support at 7.8 (ema 50 and weekly pivot point)

DOT for 1 hour interval!Hello everyone, let's take a look at the 1H DOT to USDT chart as you can see the price is moving above the local downtrend line.
Let's start by setting goals for the near future that we can consider:
T1 = $ 8.29
T2 = $ 8.81
and
T3 = $ 9.47
Now let's move on to the stop loss in case of further market declines:
SL1 = $ 8.00
SL2 = $ 7.71
SL3 = $ 7.48
SL4 = $ 7.24
and
SL5 = $ 6.90
Looking at the CHOP indicator, we can see that in the 1 hour interval we have little energy and the MACD indicator shows a local downward trend.

DOT triangle breakoutPokadot seems to be ready to break up this triangle 📐 and if successful I think there is chance for run to 10.25 and even higher. Just bought...
ENTRY : local high @ 8.10
STOPLOSS (SL) : local low @ 7.80
TARGET (TP) : height of the triangle projected from midpoint of the local range (BUY - SL) @ 10.25
REWARD RISK RATIO (RRR) : 7.1
INVALIDATION : when SL level hit
Check my other stuff in related ideas.
Please like👍, comment🗣️, follow me✒️, enjoy📺!
⚠️Disclaimer: I'm not financial advisor. This is not a financial advice. Do your own due dilingence.

Polkadot Soon To Go Bullish (125% Target Mapped)We will be looking at 3 signals on the Polkadot (DOTUSDT) chart.
1) As MA200 trends down, prices tend to trend upwards.
2) Bottom pattern formation. The same bottom pattern we've been seeing in multiple charts is also present here.
3) Mirror image. On the left side we have red/down, on the right side the mirror image would be green/up.
These are the signals.
The light blue line at the bottom of the chart is the stop-loss.
We use manual stop-loss (full candle close below this line).
This is not financial advice.
The charts can always change.
Keep in mind that trading is not risk free.
Do your own research before trading.
Make sure to comment, like, follow & share for more.
Thank you for reading.
Namaste.

DOT (Analysis)The DOT was supported at the bottom of its bearish channel last week and is moving towards resistance at $ 8.5, forming a twin floor pattern. A negative reaction accompanied the first encounter with this range. Still, in the second encounter, due to the strength of buyers, there is a possibility of breaking the resistance ahead and continuing the upward movement until the next resistance in the $ 10 range.
The downtrend is broken, and if pullback moves to this uptrend and maintains $ 7.5 support, we expect the uptrend to continue with more strength towards higher resistance. The first resistance is in the range of 8.5, and the second resistance is in the range of $ 9. If the uptrend line breaks in the 4-hour timeframe, a price reversal warning will be issued again to lower support.

analyze btc Bitcoin Time 30
Given the correlation, we expect strong momentum
.
.
.
.
.
.
.
.
arzdasht Always with you

#DOTUSD LONG, Breakout & RestestDOTUSDT breakout trend and retested
LONG: $8.026
STOP LOSS: $7.96
TAKE: $10.36

Short Idea and Buying zone Moving towards accumulation zone
it can go for a minor pull back
and a side ways move is expected
we can start Accumulating in 3 phases
1: when it goes below 7
2: at 5till
3: If it comes near 3 (Major support level)
it can take some time

Risk on in DOT DOT has often been viewed as an alt layer 1 solution. Some call it a layer 0, as it is seeking to link unique blockchains into a single collective, cohesive network.
For comparisons sake, if viewed as a layer 1, then DOT's market cap as a percentage of ETH has dropped to 4%. So keep risk mgmt monitored closely.
DOT benefits from deflationary pressures as more tokens are locked up or bonded with every parachain auction.
For clarity in jargon: Parachains are individual networks running in parallel to create a harmonized, interoperable ecosystem.
In May, they announced liquid staking to their (POS) network of blockchains, to reward additional revenue by earning extra yield in decentralized finance (DeFi) applications.
We recently saw a massive growth in trading volume, however what resulted was a decline in price. This spike was an indicator of bearish sentiment.
