DOTUSDT 3D Medium-term trade with P/L = 10/1Today we will look at the global chart of the DOTUSDT trading pair on a 3-day time frame.
The last global idea on DOTUSDT we published 8 months ago, then the downward trend began, which continues to this day.
At that time, DOT buyers were very determined to continue the growth, because on 11.11.2021, the first parachains in the Polkadot ecosystem were to be launched.
But the situation on the Dotusd chart that we saw suggested that the price will soon begin to decrease, from $50 at least to the $14-18 zone.
Of course, we were criticized then in the comments under the idea, that we do not understand what we are writing, only growth and nothing more wrote users TW...
But what do we see now? The DOT price is 2 times lower than our pessimistic forecast from the previous idea.
Now DOT buyers are trying not to let the DOTUSDT price fall below the liquidity level of $6.50
Not bad conditions to try a medium-term trade for a small part of the deposit:
Entrance $6.50-6.70
Stop $6.365 (-5%)
Take $9.95 (+48.5%)
The profit/loss ratio is 10/1
Below $6.36, it is most likely not worth holding DOT, because then fall can continue to $5-5.20 area
_______________________________
Since 2016 , we have been analyzing and trading the cryptocurrency market.
We transform our knowledge, trading moods and experience into ideas. Each "like under the idea" boosts the level of our happiness by 0.05%. If we help you to be calmer and richer — help us to be happier :)
Dotanalysis

DOT symmetrical triangle#DOT/USDT
$DOT inside symmetrical triangle, possible to drop to lower line.
then decide which way to break!
I'm goin to buy more at $7, what about you?

DOT broke down symmetrical triangle#DOT/USDT
#update
$DOT broke down from lower line of symmetrical triangle.
🐻 current support zone can cause a pullback to broken trend zone to confirm it as resistance, then continue the bearish trend.
🐮 last support before $5.5 is around $6.5 that if bulls hold this zone they may change the game.


DOT/USDT BUYING SETUP (SCALPING)Buying #DOT/USDT (SCALPING)
$DOT Breakout Ascending triangle and now has retesting . when correction showing low volume this is good for movement
BTC potential IHNS pattern and this the reason i brave to scalping setup
Buy zone : 7.6 - 7
Target : 7.88 - 8.2 - 8.49 - 8.79 - 9 - 9.5
Stop : 6.5

#DOT/USDT 2HOUR UPDATE !Welcome to this quick DOT/USDT analysis.
I have tried my best to bring the best possible outcome in this chart.
Reason for trade:- As we can see in the above-mentioned chart that DOT rejected the triangle resistance level.
Currently, DOT is trading near the support zone which is a $9.10 area.
We can add some DOT near this level with SL.
The resistance is $9.90 - $10.00 area.
A break above will dice the next move.
Candle close below the lower trend line support will be the invalidation point of this chart analysis.
Remember:-This is not a piece of financial advice. All investment made by me is at my own risk and I am held responsible for my own profit and losses. So, do your own research before investing in this trade.
Sorry for my English it is not my native language.
Do hit the like button if you like it and share your charts in the comments section.
Thank you...

#DOT/BTC 1DAY UPDATE BY CRYPTOSANDERS !!Welcome to this quick DOT/ BTC analysis.
I have tried my best to bring the best possible outcome in this chart.
Reason of trade:-DOT/ BTC PARALLEL CHANNEL and buy the green zone and (SPOT CALL)
Entry:-0.0003000,0.0003333
Traget:- 50%
Stoploss:- 0.0002722
Remember:-This is not a piece of financial advice. All investment made by me is at my own risk and I am held responsible for my own profit and losses. So, do your own research before investing in this trade.
Sorry for my English it is not my native language.
Do hit the like button if you like it and share your charts in the comments section.
Thank you...

dotusdt 11.05Project dot
In my opinion, the price floor maintains the price of $ 7 or 5 $ and there is a possibility of such a pattern

DOT (Polkadot) Coin {Market Cap} Analysis 10/04/2022Fundamental Analysis:
Polkadot is an open-source sharded multichain protocol that connects and secures a network of specialized blockchains, facilitating cross-chain transfer of any data or asset types, not just tokens, thereby allowing blockchains to be interoperable with each other. Polkadot was designed to provide a foundation for a decentralized internet of blockchains, also known as Web3.
Polkadot is known as a layer-0 metaprotocol because it underlies and describes a format for a network of layer 1 blockchains known as parachains (parallel chains). As a metaprotocol, Polkadot is also capable of autonomously and forklessly updating its own codebase via on-chain governance according to the will of its token holder community.
Polkadot provides a foundation to support a decentralized web, controlled by its users, and to simplify the creation of new applications, institutions and services.
The Polkadot protocol can connect public and private chains, permissionless networks, oracles and future technologies, allowing these independent blockchains to trustlessly share information and transactions through the Polkadot Relay Chain.
Polkadot’s native DOT token serves three clear purposes:
staking for operations and security,
facilitating network governance,
bonding tokens to connect parachains .
Polkadot has four core components:
Relay Chain: Polkadot’s “heart,” helping to create consensus, interoperability and shared security across the network of different chains;
Parachains: independent chains that can have their own tokens and be optimized for specific use cases;
Parathreads: similar to parachains but with flexible connectivity based on an economical pay-as-you-go model;
Bridges: allow parachains and parathreads to connect and communicate with external blockchains like Ethereum.
Following the network’s redenomination after a referendum on Polkadot, DOT balances increased by 100, so one old DOT was equivalent to 100 new DOT. This meant that the initial maximum supply of 10 million old DOT in August 2020 became 1 billion new DOT tokens. The redenomination was undertaken purely to avoid the use of small decimals and make calculation easier. While all balances were increased by a factor of one hundred, this did not impact the distribution of DOT or holders’ proportional share.
Polkadot’s first initial coin offering (ICO) was held in October 2017, and the Polkadot price was $0.29, with 2.24 million tokens offered. The second ICO was held in July 2020, and the Polkadot price offered was $1.25, and 342,080 DOT tokens were sold.
The current CoinMarketCap ranking is #12, with a live market cap of $19,263,288,614 USD. It has a circulating supply of 987,579,315 DOT coins and the max. supply is not available.
Technical Analysis:
Looking at the Market Value and Fluctuation Patterns in historical data of the Asset from Jan 2021, we can see there has been a completed Cycle with ATH: 47B$ , thus retracement to 10B$, followed by 3 Months of Re-Acumulation Phase till End July 2021, which developed the New Cycle with its New ATH of Approx. 55B$, followed by Market Cap Correction to 14B$ which is Below the 61.8% level of Fibonacci retracement of 0 to the Latest ATH (55B$). this means the Capital has Been accumulatiing since its retracement for its 3th cycle which can have the new ATH of 160B$.
There exist the Hidden Bullish Divergence of Market Cap Value and MACD at the 4 Hours Time Frame , which is the very Significant sign of Bullish Trend Continuation which eventually Start the new Bullish cycles.
As the Capital Accumulation Start its Bullish trend From these kind of Discounted Zones such as Fib 61.8 or lower , we can Rationally expect the ATH to be easily Achievable and ultimately developing the new cycle thus new ATH.
There are Total of 3 Targets defined by the Average Confluences of the Fibonacci Expansion and Fibonacci Trend Base Extension. these confluences Points can even be counted as the Major Pivot Points .
The 3 TP gets its confirmation as the Bullish trend Triggers the 2 TP followed by some Market Cap correction and Reaccumulating. on its Up Formation rally.

DOT Analysis 09/03/2021we have achieved our Past Specified Targets and now Updating the Idea and Taking New Positions
as you can see the price has done its accumulation phases in 2 zones and triggered our past TPs with a sharp Impulsive wave and consolidating above our 3 TP,
it will started its Rally after some consolidation as we can see there exist a Hidden Bullish Divergence with MACD Histogram, which is the sign of trend continuation.
there total of 3 New Targets specified where as the 3TP will gets its confirmation if the Price Triggers and Correct the 2 TP which is the extension zone of Fibonacci Projection of the Previews impulsive wave.

DOT USD ANALYSISPolkadot has a nice healthy bullish trendline which is holding. When we break this resistance, we can go to $27. Just watch EMAs and volume.

A Giant Bullish Divergence DOTUSD This is a bullish divergence seen on the Weekly chart
Very bullish sign for DOT

Polkadot position with 5 R/R...hello friends...
i put an order where you see in the chart.
R/R is 5 and this is very good. always be patient and wait for the price to come to you.
please ask your questions in commens.

DOT/USDT 2HOUR UPDATE BY CRYPTOSANDERS Welcome to this quick DOT/USDT analysis.
I have tried my best to bring the best possible outcome to this chart.
Reason of trade:- DOT/USDT 2hour analysis look bullish trend chart and MACD bullish crossover buy green zone
Entry:- CMP buy green zone
Traget:- 35% to 50%
Stop loss:- 17.07
Remember:-This is not a piece of financial advice. All investment made by me is under my own risk and I am held responsible for my own profit and losses. So, do your own research before investing in this trade.
Happy trading.
Sorry for my English it is not my native language
Do hit the like button if you like it and share your charts in the comments section.

DOT Analysisas shown DOTUSDT is getting weaker while increasing
IMO DOT is not yet done with correction another dip expected in the orange highlighted zone.
Manage your risks and do your own DD.
happy hunting!!


When will there be DOT price $200 on the Polkadot network?Interesting question ?) Let's look for an answer together.
In the comments below the idea, write your thoughts: what is the fundamental news and development plans of Polkadot network that can lead to such a powerful growth of DOT token value?
Our TA tells us that if buyers manage to keep the DOTUSDT price above $14-18 by the end of 2021, that would be a cool buying zone for a semi-annual investment.
The upside target would be around $200 . So if such a plan is successful, an investment in DOT could bring in x10-x15 depending on the buying point.
Let's find the truth about the future of the DOTUSD trading pair together, in discussion, and then we'll take it to the chart and flesh out this global idea.
_____________________
Since 2016 , we have been analyzing and trading the cryptocurrency market.
We transform our knowledge, trading moods and experience into ideas. Each "like under the idea" boosts the level of our happiness by 0.05%. If we help you to be calmer and richer - help us to be happier :)

DOT USDT SetupThis is my DOT USDT setup, DOT can go to demand area sooner or later, there are bearish divergence on weekly and daily timeframes, and the trendline has been broken, the target price is based on supply & demand and fibonacci, you don't have to open short position, if you want to buy DOT, you should wait until the price arrives to the demand area.

DOT ANALYSISDOT broke down of the rising broadening wedge, It bounced back from the local support of 34 if gets rejected it may even test its major support of 30$, here are the three scenario that i have in my mind.

DOT/USDT - Potential 86% SetupHello Traders!
DOT price is moving in an uptrend.
At the moment there is a correction of the last growth wave.
Buy entry can be sought in the range of $39.00 - $42.00
Stop-loss can be placed at the price point of $30.00
The targets for the continuation of the upward movement will be the Fibonacci extension levels.
$55,00
$60,30
$73,00
Good luck and watch out for the market
P.S. This is an educational analysis that shall not be considered financial advice

POLKADOT(DOT) 1H NEAR FUTURE PREDICTIONTechnical Analysis Summary (POLKADOT)
DOT/USDT
TREND ANALYSIS
We have 3 downtrend which is currently active in red
The wider the stronger the downtrend
FUTURE PREDICTIONS
We have many resistanse and support levels that I have mentioned above.
I use thickness as an indicator of stregth of levels (ONLY FOR VISUALS).
Yellow support level are levels from the past (more for explanation purposes rather than entry points)
Good luck everyone, stay safe!
If you need help don't hesitate to send me a message or comment
Trading Involves High Risk
Not Financial Advice
Exercise Proper Risk Management

Polkadot - DOTUSDT Will Hit 55$The price is sitting on the trendline currently and has a very have probability of bouncing OFF to 55 in a couple of days.
Do you have a different opinion about DPTUSDT? please comment below
LIKE idea and follow me please

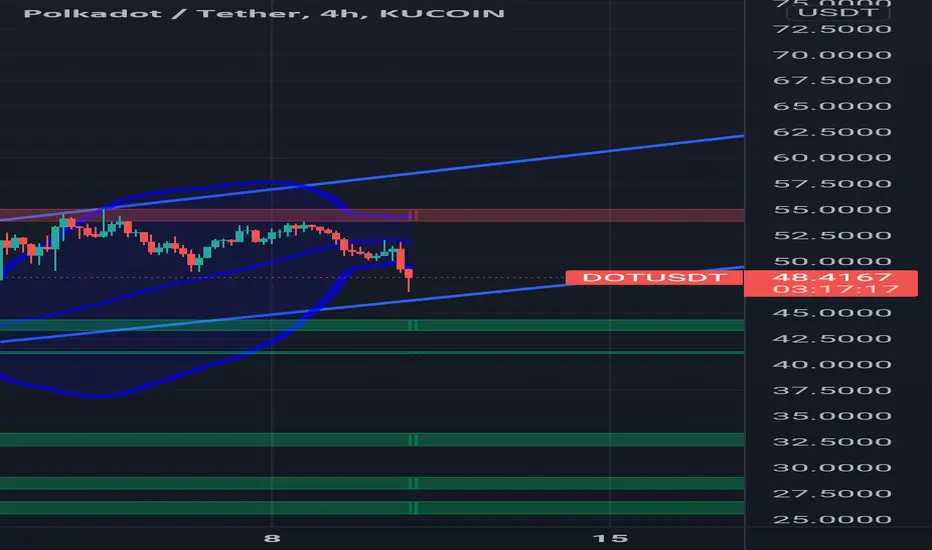
DOTUSDTBased on the analysis of the previous Polkadat chart, the purchases should be made now.Announced price range: 46&48