DOT/BTC in coming DaysHi every one
DOT/BTC
chart is speaking it self!
DOT/BTC has formed a reversed head and shoulder pattern which means that the price would increase as much as the measured price movement(the length between the neckline and the head). The neckline is already broken so now the price can easily do It's expected movement.
💎Traders, if you liked this idea or have your opinion on it, write in the comments, We will be glad.
Thank you for seeing idea .
Have a nice day and Good luck
DOTBTC

DOT/USDT Analyse
DOT/USDT chart shows that 4h retest is successfull and next resistance is around $23.
If a long green candle breakts $23 fast, we might see #DT over $27 and next targets will be as given below.
As all cryptos , DOT is being effected by BTC moves too .So if BTC breaks $40k in next days, we might see DOT rsing faster than BTC
Resistance levels are around $23, $27 and $31
Good luck

DOTBTCone of my charts actually worked yeey
loooking here like january was the bottom and feb is relief stage


DOTBTCbeen my main trading coin lately as theres 0 hype around it right now, better trading conditions imo
feb1 was touted as the cyclic bottom?
crypto loves front running by a week or so so perhaps jan 22 was the sentiment capitulation point?
im now kinda bullish given these factors

DOT scalp long ideaDOT fell a lot during this dump, let's face it it was trading in 50$ region 2 and a half months ago, for short term trade IF Bitcoin behaves itself this is my idea for long trade.
Long term DOT at 100$ is no brainer in my opinion.
This is not a suggestion this is an idea,
Do your own research and learning.
Trade safe,
Until next idea,
Trading Informator.

DOT going further down-H&S pattern
Break of the neckline should be as long as the distance between the neckline and head. This falls together nicely with the daily green support zone

DOTBTClooks closer*
edge of a 3yr bear market unless..
not fincial advice...
its just on its longterm trendline vs btc

#DOTUSDT Looks ready for a 100%+ pump! Trade Setup.Welcome to this quick update.
I'll keep it short.
Every time DOT breaks the Blue MA daily we have seen massive Rallies.
Firstly, It bounced from the support, and as per this chart, It must rally at least 100% TO 150% in the next few weeks.
ENTRY :- $25.5 to $29.6
Target :-
$45
$52
$61
Stop loss:- $23.82
*Not Financial Advice, DYOR before taking any trade.
If you want me to post more of these charts.
Hit the like button Follow me for more.
Thank you
#PEACE


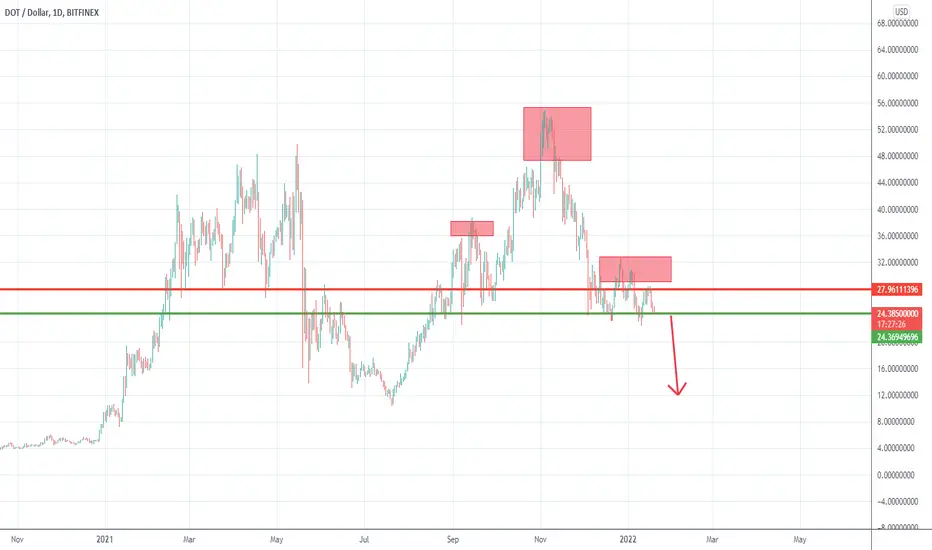
Dot can lose half of its valueLike a lot of coins, Dot is not feeling good as well
After a run that started in July and ended with a new ATH in first days of November, Dot has started to roll back and now is trading exactly in the horizontal support
The price action from September by now can be also viewed as a large H&S and a break under the neck-line could accelerate losses.
If the selling pressure in the crypto market continues, I would net be surprised for this coin to drop to 10-12 support zone.
Only price back above 32 would put a pause to this bearish scenario.

DOTBTCHello Crypto Lovers,
Mars Signals team wishes you high profits.
We are in the daily time frame. You see the S1 line which can be the support area for the price. If the S1 line holds, then the next target for the price will be the R1 line. There is also the possibility for the price to fall down to the S2 line and if that happens, then the target for the price will be first the S1 line and then the R1 line.
Warning: This is just a suggestion and we do not guarantee profits. We advise you to analyze the chart before opening any positions.
Wish you luck

One more pump for DOTBTC before a dump?Of course this is conjecture but given BTC's market dominance I could see this scenario playing for DOTBTC.
I could see DOTBTC having a decent pump to test the top of the rising channel trend line. Which depending on where BTC is at the moment could put it between $30-$33 USD and retesting the DOTUSD local high range.
If we assume that BTC dominance has bottomed and will turn around over the next few weeks then I think it's reasonable to see DOTBTC dump to the bottom of it's macro trend line before reversing and eventually breaking out of its macro symmetrical triangle.
To me this is the bullish scenario if we assume that BTC dominance is going be reversing sometime soon. If BTC dominance crashes and we go into an alt season then everything changes and we reevaluate.

DOT, SIGNAL, DAILY TRADE, POLKADOT#DOT Who doesn’t love a cup and handle continuation that plays out this perfectly?

DOTThe trend is in the range on a daily TF, fluctuating between $ 24 and $ 33. If DOT can break the $32 resistance, the $38 and $45 targets will be activated. The range trend is active; buy at the bottom of the trend and sell at the top.

DOTBTC - Long signal💡💡#SIGNAL 💡💡
DOT / BTC
▶️ Buy in two block's
(0.0005930 - 0.0006140) + (0.0005720 - 0.0005770)
🔴 SLT - 1D (Trigger)
#DOTBTC_1D_040122

Simple but smartHi guys
We see the price hitting the channel ceiling and the reaction to the channel ceiling was observed, so it can be a signal to exit. But if the price breaks from the channel upwards, it can be a good option to buy, although it is more likely that the trend will not have such strength.
Do not pay attention to shadows
what is your opinion?
If you like this analysis, please like and follow 🙏


DOTUSDT, Nice supported in key point levelHello everybody
DOT is one the most powerful project that is amazing in crypto because of the do the team that have heavy powerful fundamental analysis
According to the chart and previous serial analysis, We shown on chart 2 3 buy zone level that you can buy step by step to reduce average purchase and we shown on chart the key point level that is important point because if this key was lose and we can consolidation below the key level the trend can be change to downward and we see lower price but the price exactly supported in key point level support.
If you check that level you should bought in bottom of price and now you are in profit.
At this time just manage your portfolio and position, we shown on chart first resistance zone that the price can reach to them and we will update more target after the price can cross this resistance.
Good Luck
Abtin
Previous analysis :

DOT. Read the description. TRADE CALL: DOT is currently at strong support. Wait for daily closing below 23.5 to short it for 18.8-17.8. Once the trade is triggered, use 4h closing above 25.3 as your stoploss.


DOTHello Everyone...
After breaking the channel and aiming to eat the shorts position
DOT is now flooring in the $ 25 range
Given that Bitcoin is in the important range of its price and support ... the risk of LONG position on DOT is less.
