DOTdot is still on support zone
👑👑 #DOT/USDT 👑👑
Exchanges: Binance
Signal Type: Regular (Long)
Entry Targets:
1) 30 - 10%
2) 28 - 20%
3) 27 - 30%
4) 26 - 40%
Take-Profit Targets:
1) 31 - 50%
2) 35 - 20%
3) 40 - 20%
4) 48 - 10%
Stop Targets:
1)23
CALL OF CRYPTO
DOTBTC

DOT ready !Technically, DOT is 88% bullish , Polkadot is an open source project founded by the Swiss based Web3 Foundation. The Web3 foundation contracted Parity Technologies, run by Dr. Gavin Wood, an Ethereum Co-Founder who wrote the Ethereum technical Yellow Paper and implemented a large portion of the protocol.
Polkadot is designed for true interoperability, and enables cross-blockchain transfers of any type of data or asset, not just tokens. Polkadot allows developers to create a custom blockchain quickly using the Substrate framework, and connect it to the Polkadot network to be interoperable with many other chains.
Polkadot is also able to upgrade itself without the need for potentially contentious hard forks.

Polkadot DOT/BTCDots had a solid run over the last month, i only traded this on spot and was happy to ride the waves, how ever im feeling a possible retracement coming at the moment.
We have hit a level of resistance and after the run we have had and the 3 impulsive moves, I would be expecting a descent market correction over the next few weeks.
Bull case is a sharp and short term pull back met with a continuation of this current momentum, breaking the level of resistance and pushing higher for a new target.
Bear case is either a much deeper retracement or we double top at resistance and head back down to the EQ level between the 50-618 retracement of the entire run.
I would still consider that to be some what heathy market structure but not something I will hold onto.
Basically for this position im watching closely on this short term pull back, if there is a lot of selling i may take my profits early and let it cool down, if the selling is minimal and the pull back is slow, then ill hold my position and watch closely at a potential double top.

PolkaDot DOTUSDT - HUGE Parallel Channel on the Daily chart!- Polkadot is strong on the daily timeframe , as we can see.
- The price broke out of the bullish falling wedge and now is unstoppable!
- On the daily time scale, we can spot a huge blue parallel channel , which acts like a support and resistance .
- Target top of the chanel or 1:1 fib extension on the daily chart .
- For expected duration of the trade, probability, stop loss, profit target, entry price and risk to reward ratio ( RRR ) - please check my signature below ↓
- Due to my Elliott wave count, the correction is totally over and we can expect a higher prices!
- If you want to see more of these ideas, hit "Like" & "Follow"!

DOT/USDT ready chart (buy and sell) FIBO- Elliott waves analysisThis chart DOT/USDT (binance) is an update of my precedent analysis (August 11)

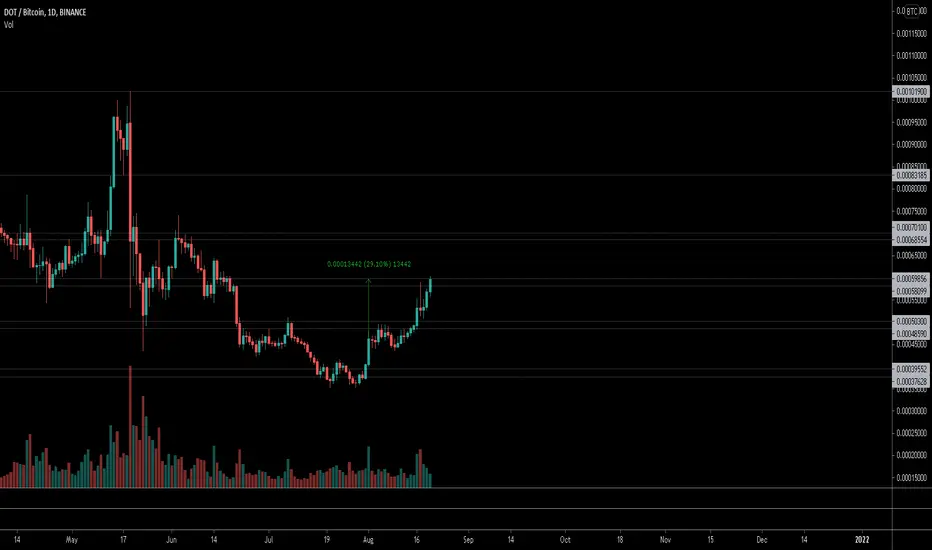
$DOT, Slowly moving up, trying ~60k sats level$DOT
Slowly moving up, trying ~60k sats level on a ~30% movement since UCTS 1D Buy signal
For now looking for volume/flip around this area as signal of continuation..
Overall looks good and market sentiment seems to be allright as well
#DOT
DOT on the daily looking to repeatdaily green dot on market cipher will confirm in 13 hours as of 6AM EST. previous have given us us insane pumps. lets see if we can get there, 6 hour looking amazing too.

Polkadot (DOT) - August 25Hello?
Welcome, traders.
By "following", you can always get new information quickly.
Please also click "Like".
Have a nice day.
-------------------------------------
(DOTUSD 1W Chart)
If the price is maintained above the volume profile section formed in the section 10.15772403-16.14614892, it is expected to continue the upward trend.
(1D chart)
Support section: 20.26700243-23.03314771 section
Resistance section: 29.84923340-33.86828748 section
It should move above the 38.69059855 point to accelerate the uptrend.
If it falls in the section 20.26700243-23.03314771, Stop Loss is required to preserve profit and loss.
However, it is possible to touch the section 10.15772403-16.14614892 and ascend, so you need to be prepared for this.
-------------------------------------
(DOTBTC 1W chart)
What you can see from this chart is that the volume profile section is being formed in the 39108 Satoshi-48719 Satoshi section.
Accordingly, if the price is maintained above the 39108 Satoshi-48719 Satoshi section, it is expected that the upward trend will continue.
(1D chart)
It remains to be seen if the upward trend can be continued by rising above the 59700 Satoshi-62755 Satoshi section.
If it goes down, we should see if there is support in the 38377 satoshi-44645 satoshi zone.
If it falls in the 32421 Satoshi-36000 Satoshi section, there is a possibility of entering the mid- to long-term investment area, so careful trading is required.
------------------------------------------
We recommend that you trade with your average unit price.
This is because, if the price is below your average unit price, whether it is in an uptrend or in a downtrend, there is a high possibility that you will not be able to get a big profit due to the psychological burden.
The center of all trading starts with the average unit price at which you start trading.
If you ignore this, you may be trading in the wrong direction.
Therefore, it is important to find a way to lower the average unit price and adjust the proportion of the investment, ultimately allowing the funds corresponding to the profits to regenerate themselves.
------------------------------------------------------------ -----------------------------------------------------
** All indicators are lagging indicators.
Therefore, it is important to be aware that the indicator moves accordingly with the movement of price and volume.
However, for the sake of convenience, we are talking in reverse for the interpretation of the indicator.
** The wRSI_SR indicator is an indicator created by adding settings and options to the existing Stochastic RSI indicator.
Therefore, the interpretation is the same as the traditional Stochastic RSI indicator. (K, D line -> R, S line)
** The OBV indicator was re-created by applying a formula to the DepthHouse Trading indicator, an indicator disclosed by oh92. (Thanks for this.)
** See support, resistance, and abbreviation points.
** Support or resistance is based on the closing price of the 1D chart.
** All descriptions are for reference only and do not guarantee a profit or loss in investment.
Explanation of abbreviations displayed in the chart
R: A point or section of resistance that requires a response to preserve profits.
S-L: Stop Loss point or section
S: A point or section where you can buy to make a profit as a support point or section.
(Short-term Stop Loss can be said to be a point where profit and loss can be preserved or additional entry can be made through split trading. It is a short-term investment perspective.)
GAP refers to the difference in prices that occurred when the stock market, CME, and BAKKT exchanges were closed because they are not traded 24 hours a day.
G1 : Closing price when closed
G2: Opening price
(Example) Gap (G1-G2)

DOT Entering RangeDOT has successfully broken through and retested strong resistance and is ready to make movements. This along with the positive sentiment returning to crypto in general could mean serious gains. Do your own research. Wait for daily close.

$MINA is the new $SOL?I remember when I by mistake undervalued $SOL at 3 and $DOT at 4$ , not going to do the same with this one even if it didn't catch up with sol and dot market cap at least it can do 3X from here. PA is good, FA is good, BTC had a long term buy indicator and ethbtc has the potential to be back at previous ATH in upcoming months.
Not going to sell below 10$.
This not a swing trade.
This a long term investment.
Show me what you got.

DOT looking good for another leg upwe may see a little resistance here till 50k satosi then we are ready to go for net moon ride

DOTBTC NEW PUMPDOTBTC NEW PUMP
Dot moving in potential rising channel. DOTBTC is testing the weekly support after a retest of the Fibonacci level.

DOTBTCI think we might be seeing an inverted head and soulders pattern in daily chart from DOT/BTC. Upside potencial goes to aproximately 0.00075 by this pattern. Shall we wait for the confirmation. In the way to the high point of the pattern it might be a resistance from a suport point of the last bear, breaking could throw the prices above the pattern prediction.

PolkaDot DOTUSDT - Secret Parallel Channel, new ATH soon!- Polkadot is strong on the daily timeframe, as we can see.
- The price broke out of the bullish falling wedge and now is unstoppable!
- On the daily time scale, we can spot a huge blue parallel channel, which acts like a support and resistance.
- Target top of the chanel or 1:1 fib extension on the daily chart.
- For expected duration of the trade, probability, stop loss, profit target, entry price and risk to reward ratio ( RRR ) - please check my signature below ↓
- Due to my Elliott wave count, the correction is totally over and we can expect a higher prices!
- If you want to see more of these ideas, hit "Like" & "Follow"!

DOT/USDTDOT sharply rejected from the resistance of $26.73 - $28.78 as drawn.
Price also made a wick on the downside, tested its structural support.
Now price is expected to move on the upside.


DOTUSDT BULLISH SIGNAL UPDATE!!As you all know, BAND is not performing well from last 2 months and according to the Chart patterns, Ascending Channel is formed, Breakout formation and also indicators giving bullish signal.
Short term Trade, DYOR Before taking trade, as i'm not responsible for your loss.
RISK FACTORS:
Market/ BTC CRASH
Happy Trading :)
Good Luck!
If you like my idea, please support:
Binance Smart Chain ( BSC ): 0x69Ea86D0f6B762fC36A322b0C833D2bd04534b3d

DOT/USDTDOT moved exactly as predicted. DOT reached the resistance zone. DOT running at 30% profit from our buy. DOT need to break this resistance to start a new uptrend. If DOT rejected from this resistance then the next support area is $24 and $21.6, the major support remains the same of $19 - $20 area. You can add more DOT if it comes down to the support level.
If you liked my idea, follow me for more.

DOT/BTC textbook head & shouldersHi followers,
DOTBTC created a beautiful head and shoulders reversal pattern, right on the support area, confirmed already with a breakout of the neckline.
Don't forget to manage your risk! 👌
Good luck and trade with care 🙏
If you like my content - 👍 Like, 💬 comment, 👆 follow and 👉 share!
❗❗❗
Disclaimer: This information is not a recommendation to BUY or SELL. It is to be used for educational purposes only!

warning 50 dollars dot is imminent last time to buy dot under 25 dollars forever
this chart will look tiny when dot goes 100x from 5 dollars to 500


DOT / USDT chart update Elliott Wave and Fibothis's DOT/USDT update (August 11) of my PRECEDENT CHART,

PolkaDot DOTUSDT - HUGE Secret Parallel Channel on the Daily!- Polkadot is very strong on the daily timeframe, as we can see.
- The price broke out of the bullish falling wedge and now is unstoppable!
- On the largest time scale, we can spot a huge blue parallel channel, which acts like a support and resistance.
- For expected duration of the trade, probability, stop loss, profit target, entry price and risk to reward ratio (RRR) - please check my signature below ↓
- Due to my Elliott wave count, the correction is totally over and we can expect a higher prices!
- If you want to see more of these ideas, hit "Like" & "Follow"!
