DOTUSDT Buy Setup!DOTUSDT Technical analysis update.
Buying DOTUSDT at the current price.
Stop loss: $4.38
Take profit 1: 4.57
Take profit 2: 4.71
Take profit 3: 4.85
Always use stop loss
thanks
Hexa
DOTBTC

$DOT #DOT | LTF LONGIf you see some bullish breaker on 1H or below, you may think to open a long position.

It is approaching its initial listing priceHello?
Traders, welcome.
If you "Follow", you can always get new information quickly.
Please also click "Boost".
Have a good day.
-------------------------------------
(DOTBTC 1W chart)
----------------------------------------
(DOTUSDT 1W Chart)
(1D chart)
This time HA-Low is falling and is looking to spawn at 4.514.
Therefore, it is important to be able to rise with support in the 4.514-4.605 section this time.
As you can see from the DOTBTC chart and the DOTUSDT 1W chart, there is no upward force and it is approaching the initial listing price.
I think there is little you can do in this situation.
Therefore, I think it is better to wait for the trend to turn into a short-term uptrend.
To turn into a short-term uptrend, it means when MS-Signal, which was holding the price higher than MS-Signal, turned into an uptrend.
To do so, it must show that the price is maintained at least in the 4.514-4.605 range or higher.
-------------------------------------------------- -------------------------------------------
** All descriptions are for reference only and do not guarantee profit or loss in investment.
** If you share this chart, you can use the indicators normally.
** The MRHAB-T indicator includes indicators that indicate points of support and resistance.
** HA SRRC indicators are displayed as StochRSI (line), RSI (columns), and CCI (bgcolor).
** The CCI indicator is displayed in the overbought section (CCI > +100) and oversold section (CCI < -100).
(Short-term Stop Loss can be said to be a point where profit or loss can be preserved or additional entry can be made by split trading. This is a short-term investment perspective.)
---------------------------------

Polkadat falling triangleA descending triangle is being completed. Look for short trades in the red area above. Don't forget capital management and stop

The price is still sitting on an important support level!DOT has been trending down over the past week. The price is still sitting on an important support level in the range of $5.20-$5.25, and there is no sign of positive reaction and price growth from this level. Last week, an uptrend line was broken to the bottom, signaled by the RSI indicator's negative divergence. Only the specified support level is considered the last valid short-term support for the short term.
If the selling pressure increases on Polkadot, by breaking this support, the price can continue down to the $4.50-$3.60 range, and the bottom of the descending channel can be fake broken. As soon as the price hits the indicated monthly support, we can expect a strong positive reaction. Considering that the price of the Polkadot currency has reached good support levels, there is a possibility that some market whales will take action to activate the loss limit of buying transactions and fake breaks. For a less risky situation, you should wait until the break of the new downward trend line and the confirmation of the downward angle pattern.

DOT ANALYSIS#DOT UPDATE.
#DOT is currently holding the double bottom support at the red line area and close below to the red line area could result in pullback support by the bearish divergence on RSI.

DOT 4H BUYDOT 4H support is at ~$5.4
Enter 50% at the current price
and try to set some BUY orders near the support zone
If DOT stays above the trendline,
the Take-Profit target would be 5%, 10%, and 15% from your entry
Cheers

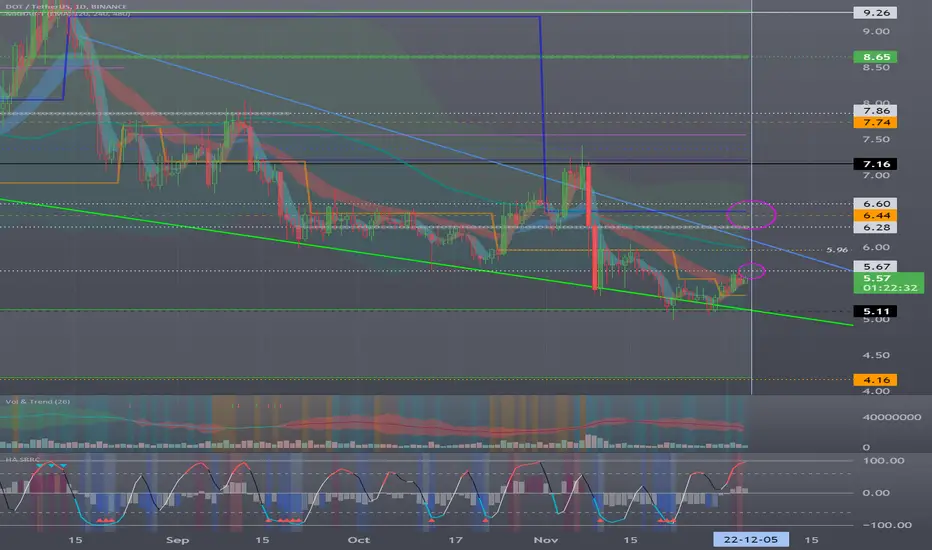
Whether it can rise above 5.67 is the keyHello?
Traders, welcome.
If you "Follow", you can always get new information quickly.
Please also click "Boost".
Have a good day.
-------------------------------------
(DOTBTC 1W chart)
It must rise above 0.0003 911 to gain the power of rising.
----------------------------------------
(DOTUSDT 1M Chart)
Whether it can rise above 7.16-9.26 is the key.
(1W chart)
The key is whether it can be supported and rise at 5.11 and rise above 7.16.
(1D chart)
The key is whether it rises above 5.67 between December 4-6 and receives support.
Since the volume profile section is formed in the 6.28-6.60 section, it is important to rise above this section.
If not, you need to make sure it is supported in section 4.16-5.11.
-------------------------------------------------- -------------------------------------------
** All descriptions are for reference only and do not guarantee profit or loss in investment.
** If you share this chart, you can use the indicators normally.
** The MRHAB-T indicator includes indicators that indicate points of support and resistance.
** HA SRRC indicators are displayed as StochRSI (line), RSI (columns), and CCI (bgcolor).
** The CCI indicator is displayed in the overbought section (CCI > +100) and oversold section (CCI < -100).
(Short-term Stop Loss can be said to be a point where profit or loss can be preserved or additional entry can be made by split trading. This is a short-term investment perspective.)
---------------------------------
DOT had good price growth over the past week!DOT had good price growth over the past week. Considering that the price had hit the bottom of the descending channel in the range of $5 in the high time frames, we saw the formation of a double bottom pattern and the return of the price above the range of $5.4. This pattern, which is clearly recognizable in the 4-hour time frame, has confirmed the break of this resistance pattern as the pattern's neckline was formed at the $5.4 range.
In the same period of time, we can expect further growth up to the short-term target range of $6 by considering an upward trend line on the last pivots and until this dynamic support is fully maintained. The trend is still bearish until the $6 resistance is broken. There is a possibility of a larger twin bottom pattern forming on the intraday, where the $5.10-$5.30 support level could be a good support area to retest demand.

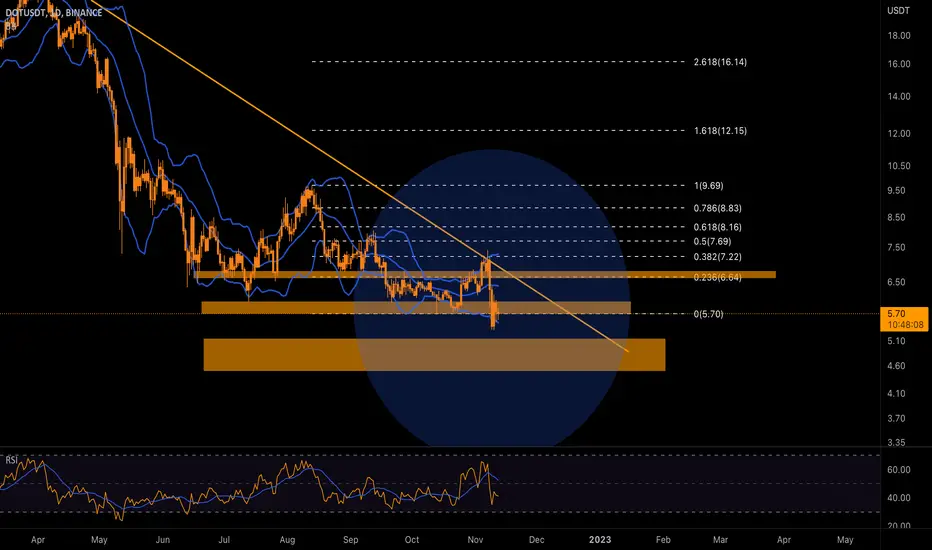
DOTUSDTFormed Massive Falling Wedge On Daily Timeframe
Rsi Printed Massive Bulish Divergence
Macd Crossover
Price Action and Indicators Are Indicating Massive bulish
Always Wait Confirmed Breakout
Its Not Financial advice Do Your TRsearch Before Taking Any Action

DOT falling wedgedot looking great to accumulate down here
could see a nice move up here if we can break out of this falling wedge

DOTUSDTdot forming falling wedge in daily tf
printing bulish divergence in rsi too
incase of breakout expecting massive bulish wave

Important minor support!DOT continued its downward trend during the last week. But by accurately hitting the bottom of its medium-term descending channel, the price increased just like the Cardano chart. But this increase in price has not shown high power from the buyer. Considering that the price is completely in a downward trend until the resistance of the $6 range becomes support, these reversals can be considered a corrective wave. But on the one hand, because a downward trend line within the channel has been broken upwards, and the last downward wave was a pullback to this trend line, if the short-term market conditions are maintained, the possibility of forming a double bottom pattern for There is a medium-term uptrend.
But its confirmation requires breaking the $6 resistance. Also, breaking the $6 resistance can make the 4-hour trend upward. At the time of writing this analysis, the biggest time frame in which the upward trend can be seen is the 1-hour time frame. As long as the minor support level of $5.25-$5.20 is not broken, this short-term uptrend can continue toward the $6 target.

Polkadot (DOT) - November 23Hello?
Traders, welcome.
If you "Follow", you can always get new information quickly.
Please also click "Boost".
Have a good day.
-------------------------------------
(DOTBTC 1W chart)
The price needs to stay above 0.0003 517 to gain strength.
-------------------------------------
(DOTUSDT 1W Chart)
Whether it can rise above 11.72 is the key.
To do so, we need to see if we can keep the price above 7.16.
(1D chart)
It is a matter of getting support in the 4.16-5.11 section or higher and being able to rise to the 5.67-6.60 section.
In particular, we need to see if we can break out of the downtrend channel.
-------------------------------------------------- -------------------------------------------
** All descriptions are for reference only and do not guarantee profit or loss in investment.
** If you share this chart, you can use the indicators normally.
** The MRHAB-T indicator includes indicators that indicate points of support and resistance.
** HA SRRC indicators are displayed as StochRSI (line), RSI (columns), and CCI (bgcolor).
** The CCI indicator is displayed in the overbought section (CCI > +100) and oversold section (CCI < -100).
(Short-term Stop Loss can be said to be a point where profit or loss can be preserved or additional entry can be made by split trading. This is a short-term investment perspective.)
---------------------------------

DOTUSDT - SETUPDOT's Price slipped down and broke a short-term range. This opens doors towards 4.0$ but if we reach that area there will be a strong upside possible towards 5.30$ - 6.0$ and also 6.50 can be achieveable. So trade accordingly until a clear price action emerges.

#DOT/USDT 1DAY UPDATE Hello, welcome to this DOT/USDT 1DAY chart update by CRYPTOSANDERS.
I have tried to bring the best possible outcome to this chart.
Show some support, hit the like button, and follow and comment in the comment section. this motivates me to bring this kind of chart analysis on a regular basis.
CHART ANALYSIS:-DOT/USD was down by as much as 5% in today’s session, falling to a low of $5.72.
Today’s drop saw the token move closer to its support level at $5.60, which has mostly been in place for the last week.
Looking at the chart, the RSI also dropped to a floor of its own, with the index colliding with its support at 41.00.
Should the index move below this point, we will likely see Polkadot move toward $5.30, which would be a two-year low.
Traders will likely also be paying attention to the moving averages, as the indicator still looks positioned for further downward momentum.
This is not a piece of financial advice.
Hit the like button if you like it and share your charts in the comments section.
Thank you

You have to wait until the price stabilizes on the levels!DOT had a sharp downtrend over the past week. The price of this currency registered a sharp decline after failing to stabilize above the resistance range of $6.6-6.8, and the selling pressure broke the support of the $5.7-6 range. This bearish trend could continue if Bitcoin breaks back below the $16,000 range, taking the price down to key support in the $4.5-$5.14 area.
Selling pressure and sellers' strength is still high, and this can be seen from the upper angle of the descending wave with the horizontal axis. To see the signs of reduction and removal of selling pressure, we can consider the positive divergence of the RSI indicator, the volume divergence, and a complete pullback to the downward trend line. With a higher probability in the channel range of $4, there is a possibility of a complete price reversal and trend change. Therefore, you should wait until the price stabilizes at the specified levels.
Trading opportunity for long position DOTUSDTBased on technical factors there is a Long position in :
📊 DOTUSDT - Polkadot
🔵 Long Now 7.06
🧯 Stop loss 6.65
🏹 Target 1 7.70
🏹 Target 2 8.70
🏹 Target 3 10.00
💸RISK : 1%
We hope it is profitable for you ❤️
Please support our activity with your likes👍 and comments📝

DOT/USDT - LONG 12H TF----- Welcome, dear followers! -----
- Here is my trading methodology. I trade with a normal system and analysis of resistance and support, as well as price reversal patterns.
- For the record, I do not place a stop loss within my trades. So that I only risk 1.5% of my total capital in order to support the loss due to a price reversal against me.
- If a price reversed against my expectation and touched the drawn line r3, then I transferred targets to the entry point and waited for the price to close at it with a loss equal to almost zero.
- Today's deal is shown in the chart, and here are the entry and exit points below.
-- Support me with numbers and follow up on my account for other deals in the future. Thank you for coming to this part. --
-------------------------------------------------------
⚡️⚡️ #DOT/USDT ⚡️⚡️
Client: My-Binance Futures
Trade Type: Breakout (Long)
Leverage: Cross (2X)
Entry Targets:
1) 6.9 - 100.0%
Take-Profit Targets:
1) 7.468 - 25.0%
2) 7.968 - 25.0%
3) 8.573 - 25.0%
4) 9.653 - 25.0%
Trailing Configuration:
Entry: Percentage (0.5%)
Take-Profit: Percentage (0.5%)
Stop: Breakeven -
Trigger: Target (1)

Polkadot (DOT) - November 1Hello?
Welcome, traders.
By "following", you can always get new information quickly.
Please also click "Boost".
Have a good day.
-------------------------------------
(DOTUSDT 1W Chart)
It is important to be able to rise above the 11.72-14.93 section.
To do that, we need to see if we can sustain the price above 7.74.
(1D chart)
The key is whether it can be supported in the 6.28-6.60 section or higher.
If not, you need to make sure it is supported at 5.96 or higher.
If support is found above 6.60, it is expected to lead to an attempt to move above 7.16.
------------------------------------------------------------ -------------------------------------------
** All descriptions are for reference only and do not guarantee a profit or loss in investment.
** If you share this chart, you can use the indicators normally.
** The MRHAB-T indicator contains indicators that indicate support and resistance points.
** HA SRRC indicators are expressed as StochRSI(line), RSI(columns), CCI(bgcolor).
** CCI indicator is expressed as overbought range (CCI > +100) and oversold range (CCI < -100).
(Short-term Stop Loss can be said to be a point where profit and loss can be preserved or additional entry through split trading. It is a short-term investment perspective.)
---------------------------------

PolkaDot - A huge breakout or a trap?
Please do not buy DOT. There are many, many better coins. This analysis is for you if you want to get out of DOT or if you want to buy DOT.
This altcoin looks really bad. I would not buy it. But, it looks like we will have a relief uptrend.
I think we can definitely reach at least the 0.382 FIB retracement of this downtrend wave. This wave should be completed and we are looking for a bullish correction.
We have a descending parallel channel that has been destroyed by the bulls recently. So the bears should pause for a while.
As per my Elliott Wave analysis, there is an impulse wave, which is a great sign of weakness. This is probably not the bottom!
I expect a huge bear market after the retracement, so be careful with this altcoin.
Look at my ideas about APT, ETH, BTC, and inflation in the related section down below.
For more analysis, hit "Like" and "Follow"!

DOT/USDT - LONG 1D TIME FRAME----- Welcome, dear followers! -----
- Here is my trading methodology. I trade with a normal system and analysis of resistance and support, as well as price reversal patterns.
- For the record, I do not place a stop loss within my trades. So that I only risk 1.5% of my total capital in order to support the loss due to a price reversal against me.
- If a price reversed against my expectation and touched the drawn line r3, then I transferred targets to the entry point and waited for the price to close at it with a loss equal to almost zero.
- Today's deal is shown in the chart, and here are the entry and exit points below.
-- Support me with numbers and follow up on my account for other deals in the future. Thank you for coming to this part. --
-------------------------------------------------------
⚡️⚡️ DOT/USDT ⚡️⚡️
Exchange: Binance Futures
Trade Type: Breakout (Long)
Leverage: Cross (2.0X)
Entry Orders:
1) 6.348 - 100.0% (239.575 USDT)
Take-Profit Orders:
1) 7.468 - 75.0%
2) 7.968 - 15.0%
3) 9.174 - 9.998%
Trailing Configuration:
Stop: Breakeven -
Trigger: Target (1)

DOT DOT / USDT
Price is breaking out falling wedge
I marked the most important resistances in my chart
Crossing any resistance mean a strong potential visit to the next one
Best of wishes
