Price floor: The opportunity to buy has arrived.Hello friends🙌
According to the decline we had, you can see that the price has reached its historical low, which has given good profits whenever it reaches this low. Now, with capital and risk management, we can buy within the limits of the low and move with it to the specified targets.
🔥Follow us for more signals🔥
*Trade safely with us*
Dotlong

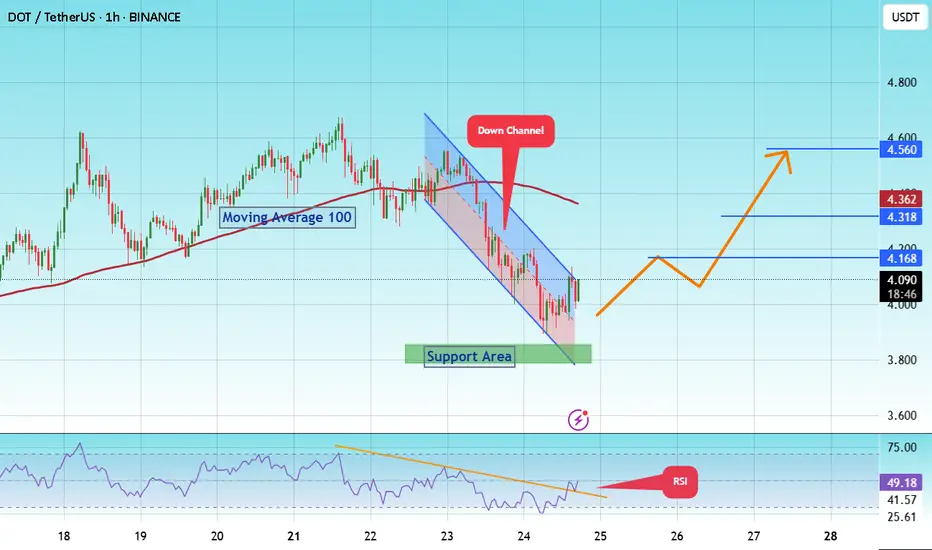
#DOT/Eyes 15% Rally, Targeting Key $ 4.560 Resistance Level#DOT
The price is moving within a descending channel on the 1-hour frame and is expected to break and continue upward.
We have a trend to stabilize above the 100 moving average once again.
We have a downtrend on the RSI indicator that supports the upward break.
We have a support area at the lower limit of the channel at 3,870, acting as strong support from which the price can rebound.
We have a major support area in green that pushed the price higher at 3,800.
Entry price: 4.084
First target: 4.168
Second target: 4.318
Third target: 4.560
To manage risk, don't forget stop loss and capital management.
When you reach the first target, save some profits and then change your stop order to an entry order.
For inquiries, please comment.
Thank you.
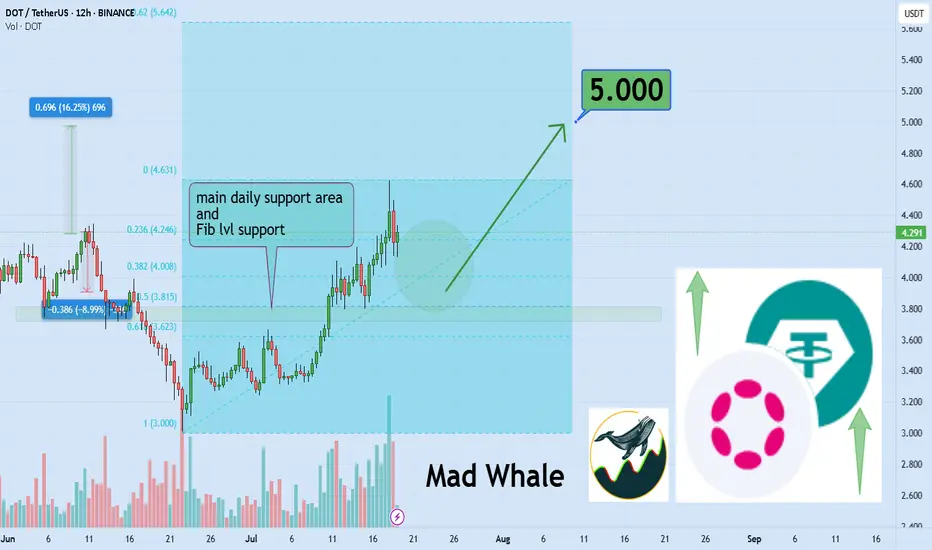
DOT Eyes 15% Rally, Targeting Key $5 Resistance LevelHello✌
Let’s analyze Polkadot’s upcoming price potential 📈.
BINANCE:DOTUSDT has broken above multiple daily resistance levels and is now consolidating near a key support zone. With this bullish structure in place, I'm targeting a minimum 15% move to the upside, with $5 as the main take-profit level. 🚀📈
✨We put love into every post!
Your support inspires us 💛 Drop a comment we’d love to hear from you! Thanks , Mad Whale 🐋
#DOT/USDT#DOT
The price is moving within a descending channel on the 1-hour frame, adhering well to it, and is heading towards a strong breakout and retest.
We are experiencing a rebound from the lower boundary of the descending channel, which is support at 4.120.
We are experiencing a downtrend on the RSI indicator, which is about to break and retest, supporting the upward trend.
We are heading towards stability above the 100 Moving Average.
Entry price: 4.170
First target: 4.220
Second target: 4.246
Third target: 4.323

DOTUSDT 1D AnalysisDOT ~ 1D Analysis
#DOT Maybe you can consider this support block to start buying back from here with a short term target of at least 10%+, long term target $11.5

$DOT - Polkadot imminent bullish momentumHey traders!
Hope you are doing GREAT!
On this occasion I've decided to spot on CRYPTOCAP:DOT as its showing a clear bullish momentum ( as other alts). The chart is clear about the movement. There is no need to use fancy indicators neither a complex analysis.
Just price action.
As a brief comment, $Polkadot broke a clear bearish trend with confirmation on the daily timeframe. That's why I'm looking for a speculative trade (just in and out).
What I'm targeting? Prices between 6.00 USD and 7.00 USD in short term could be a nice zone to take profits.
Stay tuned!

DOT has HUGE UPSIDE Potential | PolkadotPolkadot could be a late bloomer this season, but there's still much room for growth on this altcoin.
Taking a look at DOT from a macro timeframe, we clearly see the bearish cycle after the ATH, and then a bottom out when we start to see the price making higher lows.
This undoubtedly shows us that Polkadot IS CURRENTLY bullish - even though we're not seeing the big increases just yet. After a retest here in the pointed out area, it's likely DOT can run. DOT and other alts will likely retrace as ETH gears up and starts increasing, before they get their turn to run:
It should be noted that DOT is trading over 1000% away from its previous ATH. And even though that may be a stretch, I'd be happy with a 100%!
Don't miss the SOLANA update with a trade setup 🎁 :
____________________
BINANCE:DOTUSDT

Polkadot Eyes $5.38 – Is a 17% Rally on the Horizon?As of May 26, 2025, DOT/USDT is showing signs of a potential bullish reversal on the 4-hour chart, forming a strong setup for upward movement. Key technical levels and chart structures support this bullish outlook.
1. Strong Support Zone
• Zone: $4.30 – $4.37
• This area has acted as a major support, where buyers previously stepped in, leading to strong upward moves. Currently, the price has rebounded from this support zone, suggesting renewed bullish pressure.
• A bounce from this zone with increasing volume confirms the strength of this level and validates it as a demand zone.
2. Bullish Entry Setup
• The entry appears to be positioned slightly above the support zone, near $4.60.
• The risk-to-reward ratio is favorable (~2.7), indicating a well-placed setup for swing traders.
• A small stop-loss (~6.36%) below the support at $4.30 protects against a false breakdown.
3. Key Resistance and Target Levels
• TP1 / Recent Resistance: $4.93
This level marks a recent swing high and minor resistance. A breakout above this would confirm short-term bullish continuation.
• TP2 / Major Resistance: $5.38
This is the major resistance level and final take-profit zone. It aligns with a previous market top, and its breach could lead to further bullish continuation into a higher timeframe breakout.
4. Projected Path and Price Action
• The chart outlines a bullish projection path, anticipating higher lows and higher highs forming a stair-step rally.
• This dotted path suggests a bullish trend structure with gradual momentum buildup.
• Buyers may continue pushing the price upward through TP1 toward TP2 in the coming sessions, especially if macro conditions or Bitcoin price action remain favorable.
5. Market Structure & Candlestick Behavior
• The market recently transitioned from a short-term downtrend into a consolidation phase.
• Bullish candlestick formations around the support zone imply accumulation.
• The recent bullish engulfing near the support further confirms buyer dominance and a potential trend reversal.
6. Risk Management and Outlook
• Stop-Loss: Below $4.30 to manage downside risk.
• Target Zones: $4.93 (TP1), $5.38 (TP2).
• A break below $4.30 would invalidate the bullish thesis and suggest caution.
• As long as DOT remains above the $4.37 zone, the bullish scenario remains intact.
Conclusion
DOT/USDT is currently in a bullish setup on the 4-hour chart with a high-probability reversal from the support zone. Traders may look for confirmation candles and volume support to enter long positions with TP1 at $4.93 and TP2 at $5.38. Risk remains contained below the $4.30 level.

DOTUSDT - U should have some DOT in ur portfolio3D chart shows breakout a falling wedge pattern after a drop of 70% ... this is a strong buy signal
so keep ur eye on it! ... target is 12$
Best regards Ceciliones🎯

#DOT/USDT#DOT
The price is moving within a descending channel on the 1-hour frame, adhering well to it, and is heading towards a strong breakout and retest.
We are seeing a bounce from the lower boundary of the descending channel, which is support at 4.05.
We have a downtrend on the RSI indicator that is about to be broken and retested, which supports the upward trend.
We are looking for stability above the 100 moving average.
Entry price: 4.08
First target: 4.10
Second target: 4.15
Third target: 4.20

DOT/USD "Polkadot vs U.S Dollar" Crypto Heist (Scalping / Day)🌟Hi! Hola! Ola! Bonjour! Hallo! Marhaba!🌟
Dear Money Makers & Robbers, 🤑 💰💸✈️
Based on 🔥Thief Trading style technical and fundamental analysis🔥, here is our master plan to heist the DOT/USD "Polkadot vs U.S Dollar" Crypto Market. Please adhere to the strategy I've outlined in the chart, which emphasizes long entry. Our aim is to escape near the high-risk MA Zone. Risky level, overbought market, consolidation, trend reversal, trap at the level where traders and bearish robbers are stronger. 🏆💸"Take profit and treat yourself, traders. You deserve it!💪🏆🎉
Entry 📈 : "The vault is wide open! Swipe the Bullish loot at any price - the heist is on!
however I advise to Place buy limit orders within a 15 or 30 minute timeframe nearest or swing low or high level for pullback entries.
Stop Loss 🛑:
📍 Thief SL placed at the recent/swing low level Using the 4H timeframe (3.450) Scalping/Day trade basis.
📍 SL is based on your risk of the trade, lot size and how many multiple orders you have to take.
🏴☠️Target 🎯: 4.000
💰💵💸DOT/USD "Polkadot vs U.S Dollar" Crypto Market Heist Plan (Day / Scalping Trade) is currently experiencing a bullishness,., driven by several key factors.☝☝☝
📰🗞️Get & Read the Fundamental, Macro, COT Report, On Chain Analysis, Sentimental Outlook, Intermarket Analysis, Future trend targets.. go ahead to check 👉👉👉🔗
⚠️Trading Alert : News Releases and Position Management 📰 🗞️ 🚫🚏
As a reminder, news releases can have a significant impact on market prices and volatility. To minimize potential losses and protect your running positions,
we recommend the following:
Avoid taking new trades during news releases
Use trailing stop-loss orders to protect your running positions and lock in profits
💖Supporting our robbery plan 💥Hit the Boost Button💥 will enable us to effortlessly make and steal money 💰💵. Boost the strength of our robbery team. Every day in this market make money with ease by using the Thief Trading Style.🏆💪🤝❤️🎉🚀
I'll see you soon with another heist plan, so stay tuned 🤑🐱👤🤗🤩

DOT & LTC TRADE SET UPDOT LONG
Entry Price 1: $4.60
Entry Price 2: $4.40
Stop Loss: $4.10
Take Profit 1: $4.80
Take Profit 2: $5.00
Take Profit 3: $5.20
Take Profit 4: $5.50
Status: ACTIVE
LTC NEUTRAL WAITING FFOR BREAK OUT

#DOT/USDT#DOT
The price is moving within a descending channel on the 1-hour frame, adhering well to it, and is heading for a strong breakout and retest.
We are seeing a bounce from the lower boundary of the descending channel, which is support at 4.40.
We have a downtrend on the RSI indicator that is about to be broken and retested, supporting the upward trend.
We are looking for stability above the 100 Moving Average.
Entry price: 4.43
First target: 4.50
Second target: 4.57
Third target: 4.64

#DOT/USDT#DOT
The price is moving within a descending channel on the 1-hour frame, adhering well to it, and is heading for a strong breakout and retest.
We are seeing a bounce from the lower boundary of the descending channel, which is support at 4.22.
We have a downtrend on the RSI indicator that is about to be broken and retested, supporting the upward trend.
We are looking for stability above the 100 Moving Average.
Entry price: 4.30
First target: 4.37
Second target: 4.46
Third target: 4.57

PolkaDot DOT Has a Chance, But Still In Danger!Hello, Skyrexians!
Recently we have already made analysis on BINANCE:DOTUSDT before the dump, where pointed out that wave 5 to the downside ahead. Asset has finally reached the minimal target at $3.8 and now we have a question if it's going to reverse or $2 is next.
Let's take a look at the daily time frame. We can see the Elliott waves structure and wave 5 can be finished anytime now. Our best practice to find the reversals is the green dot on the Bullish/Bearish Reversal Bar Indicator and the divergence with Awesome Oscillator. Now we can see all these conditions, but bullish reversal bar is still unconfirmed, while it's high is going to be broken, the danger will be melted, but now we still have a chance to go down.
Also wanna notice the false signals on the indicator. All of them are placed inside the range and cannot be counted as valid. Take it into account when use it.
Best regards,
Skyrexio Team
___________________________________________________________
Please, boost this article and subscribe our page if you like analysis!

#DOT/USDT#DOT
The price is moving in a descending channel on the 1-hour frame and is expected to continue upwards
We have a trend to stabilize above the moving average 100 again
We have a descending trend on the RSI indicator that supports the rise by breaking it upwards
We have a support area at the lower limit of the channel at a price of 4.50
Entry price 4.60
First target 4.72
Second target 4.85
Third target 4.99

#DOT/USDT#DOT
The price is moving in a descending channel on the 1-hour frame and is adhering to it well and is heading to break it upwards strongly
We have a bounce from the lower limit of the descending channel, this support is at a price of 4.10
We have a downtrend on the RSI indicator that is about to be broken, which supports the rise
We have a trend to stabilize above the moving average 100
Entry price 4.60
First target 5.40
Second target 6.02
Third target 6.80

DOTUSD Plunge Alert Precision Short Targeting 10%+ Gains !The asset, DOTUSD, is showing a sharp bearish momentum with a decline indicating strong selling pressure.
The current price is 6.905, while the short entry position aligns with a retracement after a peak profit zone
1. Trend Direction
The price has broken below green channel, signaling a trend reversal from bullish to bearish.
Red zones around the moving averages confirm the presence of downward momentum.
2.Entry Confirmation
The short position appears to be placed after the market failed to hold its highs (Peak Profit 10.14%) and created lower highs, validating the short trade setup.
Entry aligns with the rejection of resistance levels, suggesting a good risk-to-reward setup.
3. Risk Management
Stop-loss is placed slightly above the sell zone, covering the recent swing high. This limits risk in case of price retracement.
The profit target extends well below the entry, suggesting confidence in further downside potential.
4. Aetos Indicators
A potential momentum-based or moving average indicator is being used to highlight peak profit areas, confirming optimal trade execution.
The bearish engulfing candles in the sell region validate the short bias.
Projection
Target Zone: The profit target aligns with the 6.230 support level, indicating expectations of a 10% drop from the entry point.
Downside Risk: If bearish momentum continues, there could be a breakdown below 6.230, extending losses toward 6.000 or lower.
Analysis
DOTUSD is experiencing a sharp bearish reversal after failing to hold its highs. The short entry capitalizes on lower highs and rejection near the resistance. Stop-loss is strategically placed above recent highs, while the target aligns with key support levels. This trade setup is supported by
Bearish momentum.
Clear breakdown below the moving average channel.
High risk-to-reward ratio for short-term traders.
Strategy
Stay short below 6.905, targeting 6.230. If price retraces above 7.00, consider exiting the position. Always book profits partially and move SL to BE

Best Buy in DOT📊 DOT/USDT Analysis
🔹 The price remains in a short-term downtrend, currently testing the dynamic resistance of the descending trendline.
🔹 The EMA50 ($7.26) is acting as strong resistance, and breaking above it could trigger a bullish wave.
🔹 Key support lies in the $6.11 - $6.90 range, and losing this zone might lead to further downside risk.
🔹 If resistance levels are broken, the next target could be the $10.42 range. 🚀
📈 RSI Indicator suggests reduced selling pressure and a potential trend reversal.
💡 What do you think of this analysis? Is DOT ready for a breakout? 🤔

#DOT/USDT Ready to go higher#DOT
The price is moving in a descending channel on the 1-hour frame and sticking to it well
We have a bounce from the lower limit of the descending channel, this support is at 6.60
We have a downtrend on the RSI indicator that is about to be broken, which supports the rise
We have a trend to stabilize above the moving average 100
Entry price 7.00
First target 7.30
Second target 7.83
Third target 8.43

DOTUSDT | FIRST LINE OF DEFENSEDOTUSDT: Potential Support at the Green Box
In this analysis, the green box emerges as a promising support area worth keeping on our radar.
This zone holds significance for two reasons:
It represents a key demand area, where buying interest could outweigh selling pressure.
It serves as the first line of defense, a crucial level that could prevent further downside.
Trading Strategy
Lower Time Frame Reactions: The focus is on monitoring price action within the green box and the adjacent blue box zone.
Long Trade Opportunities: If the price shows favorable reactions (e.g., bullish patterns or increased volume) in these areas, it can set the stage for well-structured long trades.
This approach emphasizes precision and patience, allowing for entries that align with market dynamics.
Summary
The green box in DOTUSDT is a zone to watch closely as a potential pivot for the next upward move. Stay alert to lower time frame signals to fine-tune trade setups and capitalize on this opportunity.
I keep my charts clean and simple because I believe clarity leads to better decisions.
My approach is built on years of experience and a solid track record. I don’t claim to know it all, but I’m confident in my ability to spot high-probability setups.
My Previous Analysis
🐶 DOGEUSDT.P: Next Move
🎨 RENDERUSDT.P: Opportunity of the Month
💎 ETHUSDT.P: Where to Retrace
🟢 BNBUSDT.P: Potential Surge
📊 BTC Dominance: Reaction Zone
🌊 WAVESUSDT.P: Demand Zone Potential
🟣 UNIUSDT.P: Long-Term Trade
🔵 XRPUSDT.P: Entry Zones
🔗 LINKUSDT.P: Follow The River
📈 BTCUSDT.P: Two Key Demand Zones
🟩 POLUSDT: Bullish Momentum
🌟 PENDLEUSDT.P: Where Opportunity Meets Precision
🔥 BTCUSDT.P: Liquidation of Highly Leveraged Longs
🌊 SOLUSDT.P: SOL's Dip - Your Opportunity
🐸 1000PEPEUSDT.P: Prime Bounce Zone Unlocked
🚀 ETHUSDT.P: Set to Explode - Don't Miss This Game Changer
🤖 IQUSDT: Smart Plan
⚡️ PONDUSDT: A Trade Not Taken Is Better Than a Losing One
💼 STMXUSDT: 2 Buying Areas
🐢 TURBOUSDT: Buy Zones and Buyer Presence
🌍 ICPUSDT.P: Massive Upside Potential | Check the Trade Update For Seeing Results
🟠 IDEXUSDT: Spot Buy Area | %26 Profit if You Trade with MSB
📌 USUALUSDT: Buyers Are Active + %70 Profit in Total

DOTUSDT - wyckoff accumulation pattern3D chart displays a perfect wyckoff accumulation pattern
from this chart my price projection is ( 30$- 40$ ) if breakout that resistance shown in the chart
expected another 200% bullish rally
Best regards Ceciliones🎯

DOT/USDT Analysis: Below the Blue Line StrategyObjective:
I am positioning myself to participate in every opportunity below the blue line, as this marks a critical price threshold for potential buying interest.
Key Details
The Blue Line:
Represents a significant level derived from technical analysis, acting as a pivot for high-probability setups.
This level may correspond to strong historical support or a psychological price barrier.
Strategy Focus:
Below the blue line, I expect price to offer discounted entries, whether through sharp reversals, consolidations, or breakout retests.
My aim is to accumulate positions progressively within this zone.
Market Behavior Below the Line:
Reversals: Price sweeps below the line and rebounds strongly.
Consolidation: Price stabilizes near the blue line, forming a base for a potential upward move.
Breakouts: If price drops further, I will look for deeper value zones before re-evaluating.
Action Plan
Entries:
Initiate long positions incrementally below the blue line based on price reactions (bullish market structure breaks in lower time frames).
Stop Loss:
Place below the next significant support zone to minimize risk. 8.9$, If I stop out I will have another entry at 8.3$
Take Profit:
Target levels at key Fibonacci extensions, resistance areas, or psychological round numbers. 15$ for example.
Note: Risk management and patience are critical. This strategy relies on disciplined execution and monitoring price action closely for confirmation signals.
I keep my charts clean and simple because I believe clarity leads to better decisions.
My approach is built on years of experience and a solid track record. I don’t claim to know it all, but I’m confident in my ability to spot high-probability setups.
My Previous Analysis
🐶 DOGEUSDT.P: Next Move
🎨 RENDERUSDT.P: Opportunity of the Month
💎 ETHUSDT.P: Where to Retrace
🟢 BNBUSDT.P: Potential Surge
📊 BTC Dominance: Reaction Zone
🌊 WAVESUSDT.P: Demand Zone Potential
🟣 UNIUSDT.P: Long-Term Trade
🔵 XRPUSDT.P: Entry Zones
🔗 LINKUSDT.P: Follow The River
📈 BTCUSDT.P: Two Key Demand Zones
🟩 POLUSDT: Bullish Momentum
🌟 PENDLEUSDT: Where Opportunity Meets Precision
🔥 BTCUSDT.P: Liquidation of Highly Leveraged Longs
🌊 SOLUSDT.P: SOL's Dip - Your Opportunity
🐸 1000PEPEUSDT.P: Prime Bounce Zone Unlocked
🚀 ETHUSDT.P: Set to Explode - Don't Miss This Game Changer
🤖 IQUSDT: Smart Plan
⚡️ PONDUSDT: A Trade Not Taken Is Better Than a Losing One
💼 STMXUSDT: 2 Buying Areas
