DOTUSDT - Double Bottom!DOTUSDT (1h Chart) Technical analysis
DOTUSDT (1h Chart) Currently trading at $7.55
Buy level: Above $7.53
Stop loss: Below $7
Target 1: $7.75
Target 2: $8.25
Target 3: $8.6
Target 4: $9
Max Leverage 3x
Always keep Stop loss
Follow Our Tradingview Account for More Technical Analysis Updates, | Like, Share and Comment Your thoughts
Dotlong

DOT / USDT - BUY and Forget About ItDOT Polkadot Buy it while it's still cheap so you don't have to cry later like a punk.


DOT/USDTFalling Wedge
A falling wedge is always a bullish pattern. By definition, a falling wedge always follows a major rising trend and has 3 stages: major rising trend, correction, and continuation of a rising trend.
This pattern is appropriate in denoting a bullish momentum in the market in the future.

DOT/USDT IS LOOKING BULLISH!!Here's the chart of DOT/USDT. Formed a bullish bat pattren. Dot is one of the best projectes for hold term hold. Targets
Short Term : 8-11-13
Long term : 55-72-100.

Short Idea and Buying zone Moving towards accumulation zone
it can go for a minor pull back
and a side ways move is expected
we can start Accumulating in 3 phases
1: when it goes below 7
2: at 5till
3: If it comes near 3 (Major support level)
it can take some time

DOT/USDT INVERTED 3D CHART.Hi, Random trader here. DOT/USDT is one the strongest coin. So here;s the chart of DOT/USDT inverted 3D timeframe. Dot is foarming a rising wedge in 3D inverted chart. Current price of Dot is 7$ (strong support). I am expection 15-20 $ in next 1-2 months. This swing trade is recommended for only spot traders. As always wait for the perfect entry and enjoy the ride.

DOT - PolkadotDOT looking prime for a drop to sub $4 short term, when this correction is over! After a little dead cat bounce and continuation to the down side. None of my 4 indicators showing any bullish confirmation on the Weekly Time Frame. Next Bull Run top $1.2K -$2K.
- Weekly MACD (Bearish)
- Weekly Pekipek's Divergence BETA (Bearish)
- Weekly RSI (Bearish)
- Weekly Stochastic RSI (Bearish)

DOT DAILY CHARTHELLO GUYS
my opinion is clear on the chart. please let me know what you think.
thank you so much

short trem dot i think she made the pattern of the flag and it is inappropriate to enter after leaving in any direction


$DOT | $USDT has a Bullish BAT!$DOT | $USDT has a Bullish BAT!
Are we going to hold this bounce or makers will take out the swings? Choppy market with weekly closing, higher volatility let's see if DOT will hold this!
#DOT #DOTUSDT

POLKADOT LONGS ✅✅✅Expecting bullish price action on POLKADOT from a weekly perspective as price is in a huge bullish market strucutre on the HTF premise, price rejected the bullish orderblock on the W1 that could act as a valuable area of ,,support,, if you will for the price and from there we can see a clear move to the upside.
What do you think ? Comment below.


DOTUSDT ANALYSIS Hey Colleagues,
Today we came across DOTUSDT . We see a great opportunity for this coin to show some bullish candles in the coming period around 17.1 Level.
If you like ideas provided by our team you can show us your support by liking and commenting.
Yours Sincerely,
Tournesol Team

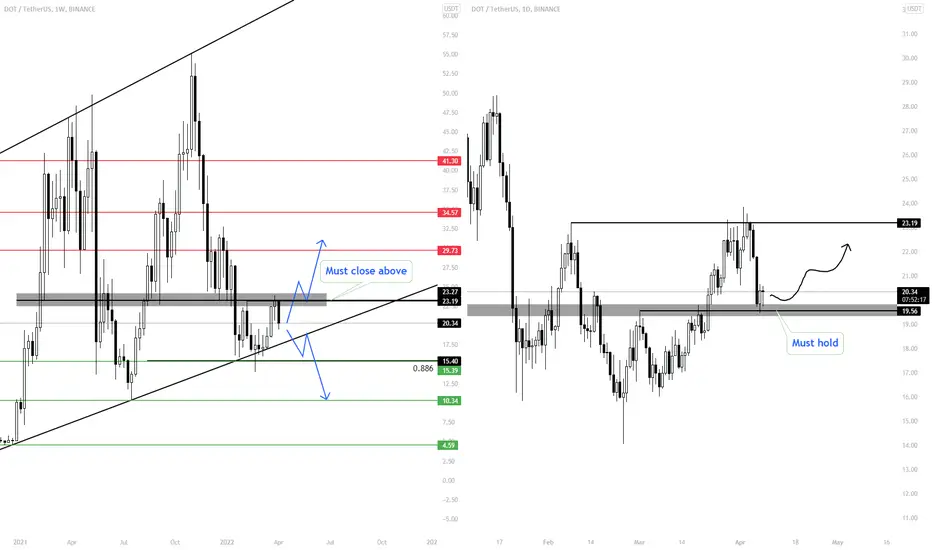
DOT Struggling on Higher Timeframes In the last 5 months DOT has lost 70% of its value, it corrected till 0.886 on Fibonacci until it found a local bottom & bounced off $15.
DOT Higher timeframes:
However, DOT is still struggling to break above the supply at $23 - $24, which is now acting as a strong resistance on higher timeframes.
We need DOT to close a weekly candle above the supply zone $24 for further upside or else it will go for further correction.
DOT Lower timeframes:
On lower timeframes, we're currently retesting the breakout, if we hold it will retest the $23 - $24 supply zone.
Look for entries on lower timeframes for short term trade, for longterm look out for clear break through above the strong supply zone $23 - $24.
I will be buying $DOT after a daily close above 19.6$ #DOTIf $DOT breaks successfully the 19.6$ level, It will be a good entry with a StopLoss at 15$ ( 1 DAY CLOSE BELOW 15$ )
Tp1: 28$
Tp2: 32.5$
Tp3: 38.95$
Tp4: 54$
Tp5: 67$
Smash the button if you like the Idea. Share the love.
NFA, DYOR.

Polkadot update April, 2022Imagine when all the puzzle pieces of the ecosystem will be complete. What will happen to
Polkadot #DOT #PolkaDot #DOTUSDT

A Giant Bullish Divergence DOTUSD This is a bullish divergence seen on the Weekly chart
Very bullish sign for DOT

DOT Sign of Strength RallyThe DOT price has been observed in a horizontal re-accumulation trading range from Jan 21, 2022 to the present. The DOT price is pushing up against the trading range resistance in what appears to be an SOS rally.
I will make a long entry in this presumed SOS rally (around $21.5) and take profit around the next resistance cluster around $28. I may add to the position at the BU/LPS.
The upper and lower boundaries of the re-accumulation trading range are given by the horizontal black lines. Blue arrows mark volume spikes.
Wyckoff abbreviations: automatic rally (AR), change of character (CHoCH), sign of weakness (SOW), failed upthrust (FUT), selling climax (SC), sign of strength (SOS), back up (BU), last point of support (LPS), last point of supply (LSPY).
This is not financial advice. I am not your financial advisor. This is my opinion.

Dot about to explode descending bradening wedge in progressPolkadot about to explode descending bradening wedge in progress, check charts.
