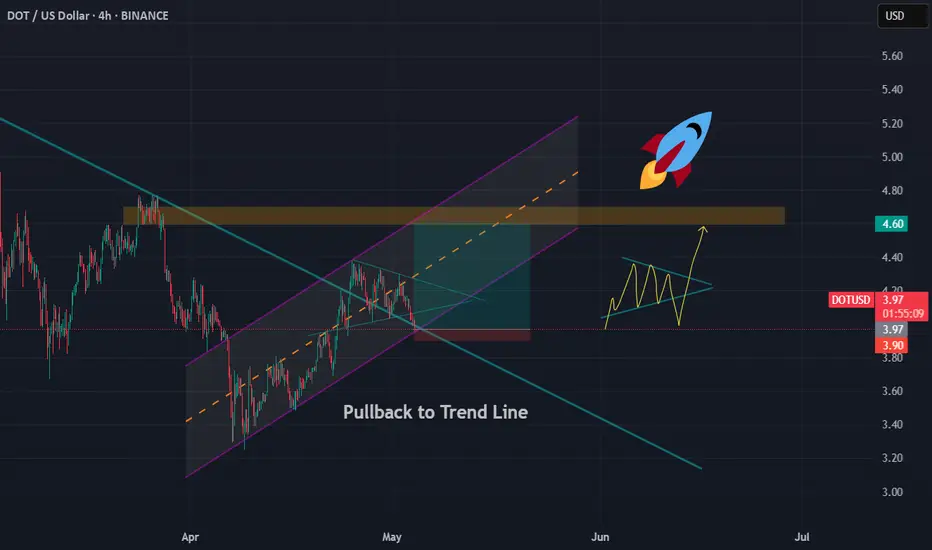
#DOT/Eyes 15% Rally, Targeting Key $ 4.560 Resistance Level#DOT
The price is moving within a descending channel on the 1-hour frame and is expected to break and continue upward.
We have a trend to stabilize above the 100 moving average once again.
We have a downtrend on the RSI indicator that supports the upward break.
We have a support area at the lower limit of the channel at 3,870, acting as strong support from which the price can rebound.
We have a major support area in green that pushed the price higher at 3,800.
Entry price: 4.084
First target: 4.168
Second target: 4.318
Third target: 4.560
To manage risk, don't forget stop loss and capital management.
When you reach the first target, save some profits and then change your stop order to an entry order.
For inquiries, please comment.
Thank you.
DOTUSD
DOT/USDT Profit Heist | Don’t Let Bears Catch You🚨Polkadot Crypto Vault Break-In Plan | DOT/USDT Robbery Blueprint🚨
🌍 Hola Heist Crew! 💰📡
Ready for another vault-cracking strategy? Here's your DOT/USDT Crypto Heist Plan based on pure Thief Trading Style™—a fusion of smart-money tactics, technical traps, and stealth execution. 🎯💸
🔓 🎯 Entry Zone – Lockpick Ready
"The vault’s wide open! Swipe the bullish loot anywhere, anytime—but smart thieves plan pullback entries."
📌 Recommended: Use 15–30 min timeframe for sniper buys near swing highs/lows.
💡 Pro Move: DCA with layered buy limits like a seasoned thief stacking getaway routes. 🧠💵
🚔 Stop Loss – Evade the Patrol
📍 Secure SL just below the nearest 4H candle wick low (e.g., 4.000 zone)
🔐 Customize SL to match your risk profile & lot size—escape routes vary by thief rank.
💣 Target – Break the Vault & Vanish
🎯 TP: 5.200
🕶️ Optional: Dip out early if market heat rises near resistance traps. Escape clean.
⚠️ High Alert – Police Checkpoint Ahead
👮 Red MA Zone = Barricade.
It’s a hotspot for bearish cops + consolidation traps.
Only strong thieves survive here—book profits before you get cornered.
💼 For Scalpers & Swing Agents
🔍 Scalpers: Only ride long—quick bags, quick exit.
💰 Swingers: Follow the full robbery plan. Patience pays.
🎯 Trailing SL is your body armor—keep it tight.
📊 Fundamental Force Behind the Break-In
🔥 DOT/USDT is flashing bullish momentum supported by:
Sentiment shift
Intermarket alignment
COT positioning
On-chain data
📡 Stay updated via macro reports & sentiment dashboards—intel is profit.
📰 News Alert – Chaos Creates Opportunity
🧨 Avoid fresh entries during high-volatility news drops.
🎯 Trailing SL can save you during headline crossfire.
❗️Disclaimer:
This blueprint is for educational purposes only. Always conduct your own recon and apply strict risk management. Thieves who don’t scout first... get caught.
🚀 Boost the Heist – Support the Crew
💥 Smash that “Boost” if this plan adds value 💥
Your boost fuels more chart crimes, more profit hits, and a growing rob-the-market brotherhood! 💪💼📈
🧨 See you in the next job... Stay hidden, stay funded!
– Thief Trading Style™ HQ 🕶️🐱👤💰🚁

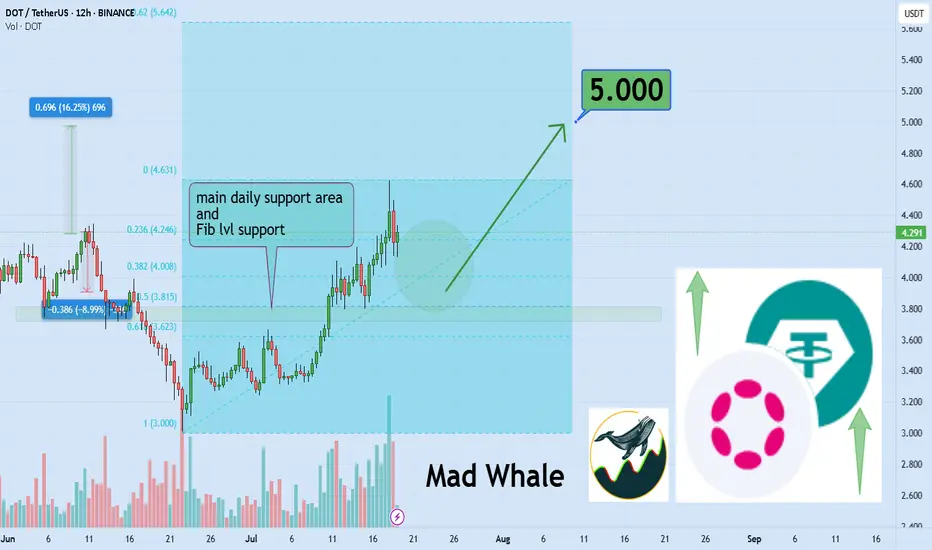
DOT Eyes 15% Rally, Targeting Key $5 Resistance LevelHello✌
Let’s analyze Polkadot’s upcoming price potential 📈.
BINANCE:DOTUSDT has broken above multiple daily resistance levels and is now consolidating near a key support zone. With this bullish structure in place, I'm targeting a minimum 15% move to the upside, with $5 as the main take-profit level. 🚀📈
✨We put love into every post!
Your support inspires us 💛 Drop a comment we’d love to hear from you! Thanks , Mad Whale 🐋
DOTUSDT - A Sleeping Giant in the Bull Market?Polkadot (DOT) has always been one of the leading assets during bull markets
A $10 target now seems inevitable after a clean breakout above the main trendline, followed by a successful retest.🎯
This $10 level has historically acted as a major resistance zone, often manipulated during each bull cycle — price touches it, then sharply pulls back.
But the big question is:
Will DOT break this psychological barrier this time?
Why not?
With many investors losing faith in the crypto market and considering leaving altogether, this might actually be the perfect setup for a massive price explosion.
Historically, the craziest pumps tend to come when confidence is at its lowest.🚀
Best regards Ceciliones 🎯
Polkadot DOT price analysisAt night, only CRYPTOCAP:BTC impressively updated its ATH, while the rest of the altcoins... haven't really woken up yet after many months, if not years, of hibernation.
For example, if memory serves, in 2020, CRYPTOCAP:DOT was buying at $1.7-1.9 during the presale (please correct me in the comments if I'm wrong). Now, the price of OKX:DOTUSDT is not that far from the initial price.
🤪 It seems that no one believes in the ultra-fashionable #Polkadot “parachain” fairy tales anymore, and that is why if the price of #DOT rises again to $11-12, it will be super happiness and luck.
✈️ Well, dreams that #DOTUSD will cost $42 again can only be included after the price has firmly consolidated above $12, and with the current price dynamics, this is something at the level of fantasy.
_____________________
Did you like our analysis? Leave a comment, like, and follow to get more

Wyckoff Pattern- To understand trading at its core, you need to understand the Wyckoff Theory.
- Everything you need is in the chart and yes, it's simple and might look like copy-paste, but it's pure Wyckoff.
- Remember this post i made in 2021 ? check it again :
Remember, trading is like a washing machine, it shakes you up, spins you around, and pressures you to sell when you should be buying or Holding.
Not a price prediction, just a smarter way to level up your strategy.
Happy Tr4Ding !

DOT/USDT Weekly Accumulation or Annihilation?📌 Overview & Market Context
Polkadot (DOT) is currently testing one of the most critical technical zones in its price history. Price action is revisiting a multi-year demand zone between $2.70 and $3.60, which has previously served as the springboard for explosive upward moves — including the 2021 rally to all-time highs near $55.
This weekly chart reveals that DOT may be transitioning from a prolonged downtrend into an accumulation phase, often seen before major bullish expansions.
🧱 Historical Support Zone & Technical Validation
🔹 The yellow demand zone ($2.70–$3.60) has acted as a strong support multiple times since 2020.
🔹 Price has once again bounced from this area, forming a potential triple bottom or accumulation base pattern, consistent with Wyckoff Accumulation Theory.
🔹 A confirmed bullish candlestick (e.g., bullish engulfing, hammer, or long-tail doji) on the weekly timeframe could signal early institutional accumulation and a potential macro trend reversal.
🟢 📈 Bullish Scenario: Strong Reversal Potential
If DOT successfully holds this support and forms a higher low, we could see a multi-leg bullish breakout, targeting the following resistance levels:
🎯 Target Price Level Significance
TP1 $4.75 First structural breakout
TP2 $5.88 Minor historical resistance
TP3 $7.63 Previous consolidation zone
TP4 $10.37 Major weekly resistance
TP5 $12.49–14.00 Extension zone during strong rallies
🧠 Note: A move from the current level to $14 represents a potential 250%+ upside — a major opportunity if confirmed by momentum and market sentiment.
🔴 📉 Bearish Scenario: Breakdown from Historic Support
A clean break below $2.70 with high volume would invalidate the bullish setup and signal:
Breakdown from a multi-year base structure.
Possible entry into a new bearish price discovery phase.
Next psychological support at around $2.00 or lower.
This scenario could materialize if:
Bitcoin or broader crypto markets turn bearish.
Macro factors worsen.
No strong demand appears from long-term holders.
⚖️ Strategy & Investor Insights
Swing Traders: Consider aggressive entries near current levels with tight stops below $2.70.
Mid-Term Investors: This is an ideal zone for DCA (dollar-cost averaging), with attractive long-term risk-reward.
Confirmation Needed: Watch for structure breakouts above $4.75 and momentum from RSI/volume indicators.
🧠 Market Psychology: Fear Breeds Opportunity
DOT is currently in what can be described as the “boredom phase” — the stage in market cycles when most traders have given up, and smart money quietly accumulates.
As Warren Buffet famously said:
> “Be fearful when others are greedy, and greedy when others are fearful.”
#DOTUSDT #Polkadot #CryptoReversal #AltcoinSetup #TechnicalAnalysis #SmartMoneyMoves #AccumulationPhase #SupportZone #BullishCrypto #BearishBreakdown

POLKADOT on last supportI think $3 is the very strong support for DOT, and the blue zone will hold, and i believe $18 resistance is very reachable for the next few months after $10 resistance got broken.

Polkadot: Bottom Already in?Given Polkadot’s recent sharp rebound toward resistance at $3.66, we consider it 35% likely that magenta wave alt. has already bottomed at $3.02. This would be confirmed by a meaningful breakout above said $3.66 level. Our primary scenario, however, still calls for lower lows as part of wave – with a break below the same $3.02 support.
📈 Over 190 precise analyses, clear entry points, and defined Target Zones - that's what we do.

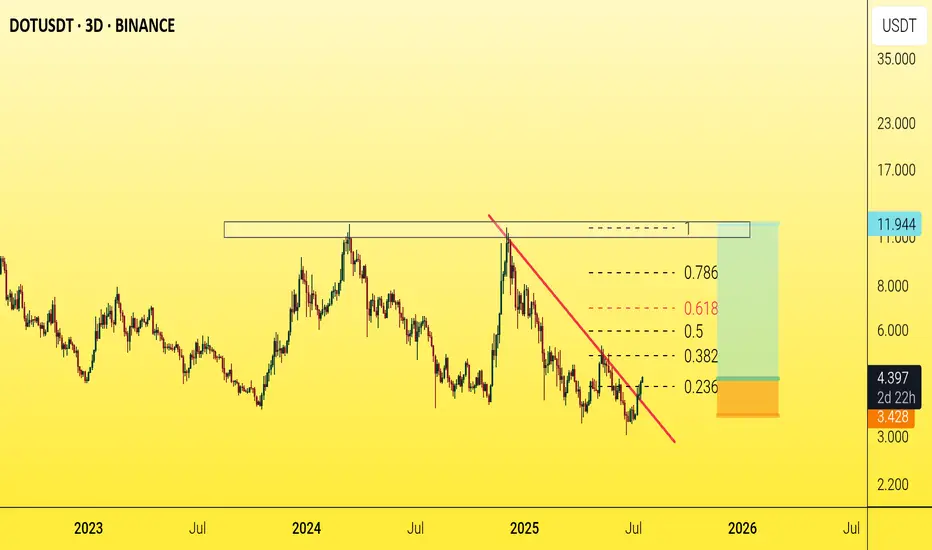
DOT ANALYSIS (3D)Polkadot appears to have reached a fresh and significant support zone, which is potentially where the corrective wave C may come to an end.
If wave C completes here, the price could begin a strong recovery. However, it’s important to note that this is a higher time frame setup, so reaching the targets may take some time.
As long as the green support zone holds, the price can move toward the mentioned targets. The targets are marked on the chart.
A daily candle closing below the invalidation level will invalidate this analysis.
For risk management, please don't forget stop loss and capital management
When we reach the first target, save some profit and then change the stop to entry
Comment if you have any questions
Thank You

TA on Litecoin, Ripple, Dogecoin, Polkadot, TronQuick TA on Litecoin, Ripple, Dogecoin, Polkadot, Tron. What do you think?
CRYPTO:LTCUSD
CRYPTO:XRPUSD
CRYPTO:DOGEUSD
CRYPTO:DOTUSD CRYPTO:TRXUSD
Let us know what you think in the comments below.
Thank you.
77.3% of retail investor accounts lose money when trading CFDs with this provider. You should consider whether you understand how CFDs work and whether you can afford to take the high risk of losing your money. Past performance is not necessarily indicative of future results. The value of investments may fall as well as rise and the investor may not get back the amount initially invested. This content is not intended for nor applicable to residents of the UK. Cryptocurrency CFDs and spread bets are restricted in the UK for all retail clients.

Polkadot (DOTUSD) is getting closer to a scary levelPolkadot ( MARKETSCOM:DOTUSD ) is coming closer to the current lowest point of this year. If it surpasses that area, then this would place the crypto in the area, last seen five years ago, bringing it closer to inception price.
Let's dig in...
CRYPTO:DOTUSD
Let us know what you think in the comments below.
Thank you.
77.3% of retail investor accounts lose money when trading CFDs with this provider. You should consider whether you understand how CFDs work and whether you can afford to take the high risk of losing your money. Past performance is not necessarily indicative of future results. The value of investments may fall as well as rise and the investor may not get back the amount initially invested. This content is not intended for nor applicable to residents of the UK. Cryptocurrency CFDs and spread bets are restricted in the UK for all retail clients.

DOTUSDT 1W AnalysisDOT ~ 1W Analysis
#DOT Buy back gradually from this support block with a short term target of at least 20%+ from this support.

DOT Will Pump 200% Next Few MonthsWe are headed to 12$ - 11$ over this year - Profiting 200%
STOP LOSS : Dailly Close Bellow 3.30$ (-15%)
Low Risq Big WIN!
Not Financial Advice , But I'm in Baby ;)
CRYPTOCAP:DOT BINANCE:DOTUSDT COINBASE:DOTM2025 BYBIT:DOTUSDT.P BYBIT:DOTUSDT COINBASE:DOTUSDT BINANCE:DOTBTC

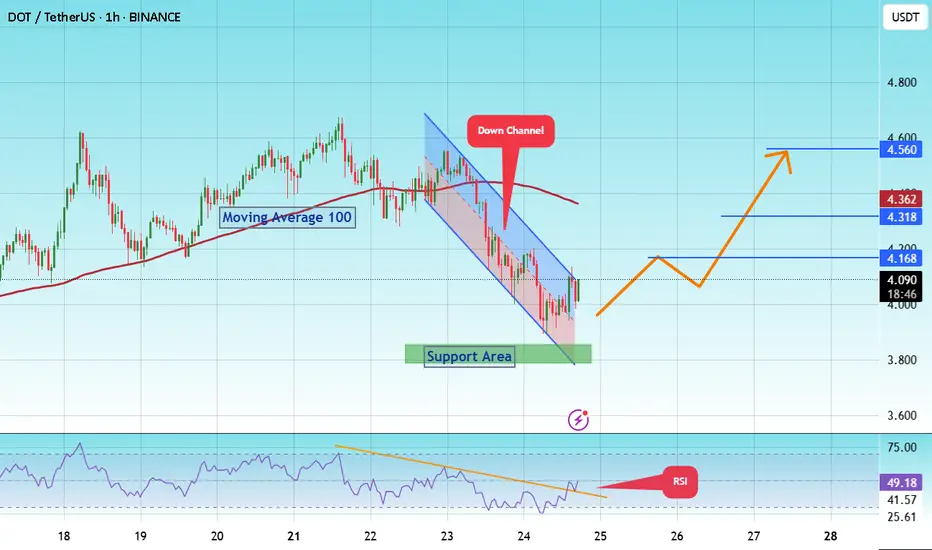
#DOT/USDT#DOT
The price is moving within a descending channel on the 1-hour frame, adhering well to it, and is heading towards a strong breakout and retest.
We are experiencing a rebound from the lower boundary of the descending channel, which is support at 4.120.
We are experiencing a downtrend on the RSI indicator, which is about to break and retest, supporting the upward trend.
We are heading towards stability above the 100 Moving Average.
Entry price: 4.170
First target: 4.220
Second target: 4.246
Third target: 4.323

DOTUSDAlligator Strategy Buy Call
Risk Rewar TP 1 1:1 and T2 1:3
Open Two trades one for TP1 other for TP2.
For TP 2 make sure to move your SL to Entry point once price crosses TP1. So that you can ride Tp2 with zero loss.

DOTUSDT 1D AnalysisDOT ~ 1D Analysis
#DOT Maybe you can consider this support block to start buying back from here with a short term target of at least 10%+, long term target $11.5

DOTUSD📊 30m Analysis – DOTUSD
Strategy: 🐊 Alligator Strategy
Trend: 📈 Strong Uptrend
📝 Trade Plan
🎯 Entry Point (EP): 4.603
🛡️ Stop Loss (SL): 4.530
💰 Take Profit 1 (TP1): 4.680
💰 Take Profit 1 (TP1):4.75
Risk Reward 1:1 TP1
Risk Reward 1:2 TP2

DOT has HUGE UPSIDE Potential | PolkadotPolkadot could be a late bloomer this season, but there's still much room for growth on this altcoin.
Taking a look at DOT from a macro timeframe, we clearly see the bearish cycle after the ATH, and then a bottom out when we start to see the price making higher lows.
This undoubtedly shows us that Polkadot IS CURRENTLY bullish - even though we're not seeing the big increases just yet. After a retest here in the pointed out area, it's likely DOT can run. DOT and other alts will likely retrace as ETH gears up and starts increasing, before they get their turn to run:
It should be noted that DOT is trading over 1000% away from its previous ATH. And even though that may be a stretch, I'd be happy with a 100%!
Don't miss the SOLANA update with a trade setup 🎁 :
____________________
BINANCE:DOTUSDT

PolkaDot DOT Let's Wait Agains The CrowdHello, Skyrexians!
As I mentioned in the recent BINANCE:DOTUSDT analysis the bounce to approximately $6 was predictable and very likely. Now it's happening. Green candles caused a lot of greed again, yesterday I checked the sentiment sharing some bearish minds in Tradingview and got a lot of negative. What's a pity, but the market again is not ready for altseason.
In this case we have now the following scenario. Recent divergence on Awesome Oscillator was just the wave 5 in 3 finish, now we have wave 4 which can be finished inside the $5.2-6.4 area. Then I expect wave 5 which has the target inside $2-3 in the best case. About the worst scenario I don't want even to talk now. Bear market is not over for alts, don't be greedy.
Best regards,
Skyrexio Team
___________________________________________________________
Please, boost this article and subscribe our page if you like analysis!

Polkadot: The Blockchain That Outclasses Ethereum 2.0In the ever-evolving blockchain world, Ethereum famously pioneered decentralized applications and smart contracts. However, as Ethereum 2.0 attempts to fix its inherent scalability and energy challenges, it still falls short of delivering true interoperability and ease of use. This is where Polkadot comes in—a platform designed from the ground up to fulfill the promise of a genuinely decentralized, scalable, and interconnected blockchain ecosystem.
Ethereum 2.0’s Unmet Promises
Ethereum 2.0 represents a significant upgrade, transitioning from a proof-of-work system to proof-of-stake in hopes of better scalability and energy efficiency. Yet, its approach—relying on sharding and rollups—has introduced complexity rather than simplicity. Despite tremendous hype, Ethereum 2.0’s incremental changes have made it challenging for the network to achieve a seamless, interoperable ecosystem. The result is a network still burdened by congestion and high fees, unable to fully liberate the potential of decentralized finance and applications .
How Polkadot Revolutionizes the Scene
Polkadot’s architecture is the antithesis of Ethereum 2.0’s convoluted upgrades. Rather than retrofit scalability into an established network, Polkadot was built from scratch with interoperability at its core. Its unique design centers on a relay chain, a central hub through which secure, scalable, and parallel blockchains—known as parachains—interact. Each parachain can be optimized for different use cases, yet they all benefit from the robust, shared security of the relay chain. This elegant solution empowers Polkadot to process transactions concurrently, drastically reducing congestion and fees while ensuring a truly decentralized environment .
A Clear, Undoubtful Advantage
There’s a disruptive clarity in Polkadot’s design that sets it apart:
- True Scalability: While Ethereum 2.0 employs sharding to process multiple blocks, Polkadot’s multiple parachains operate in parallel. This provides a more natural, scalable method for handling high volumes of transactions without compromising security.
- Seamless Interoperability: Polkadot’s architecture was envisioned to connect disparate blockchains. Cross-chain communication is built into its very DNA, something Ethereum 2.0 still struggles with.
- Robust Security Without Centralization: With the relay chain securing all parachains, Polkadot avoids the pitfalls of isolated blockchains vulnerable to attacks or whale-driven volatility—a persistent issue with Ethereum’s evolving network.
- Community-Driven Innovation: Unlike Ethereum 2.0’s upgrade path that remains mired in complexity and centralization, Polkadot’s modular platform invites developers to build specialized blockchains that work harmoniously together, fostering an enriched ecosystem from day one.
The Road Ahead
In essence, Ethereum 2.0 promised to solve the issues of its predecessor yet found itself entangled in complexity and compromise. Polkadot, in contrast, delivers a clear vision from inception—a blockchain ecosystem that isn’t just a platform for speculation but a foundation for true decentralized interoperability. It’s not about making quick millionaires; it’s about building a sustainable, transformative infrastructure that can underpin the future of digital finance and beyond.
With its innovative design and community-first approach, Polkadot is poised to become the decentralized network of choice—one that will eventually outpace Ethereum and redefine what a blockchain ecosystem can be.
The future isn’t about patching up old systems; it’s about building something entirely new. And in this race, Polkadot is not only winning—it’s setting the pace.
CRYPTO:DOTUSD NASDAQ:COIN

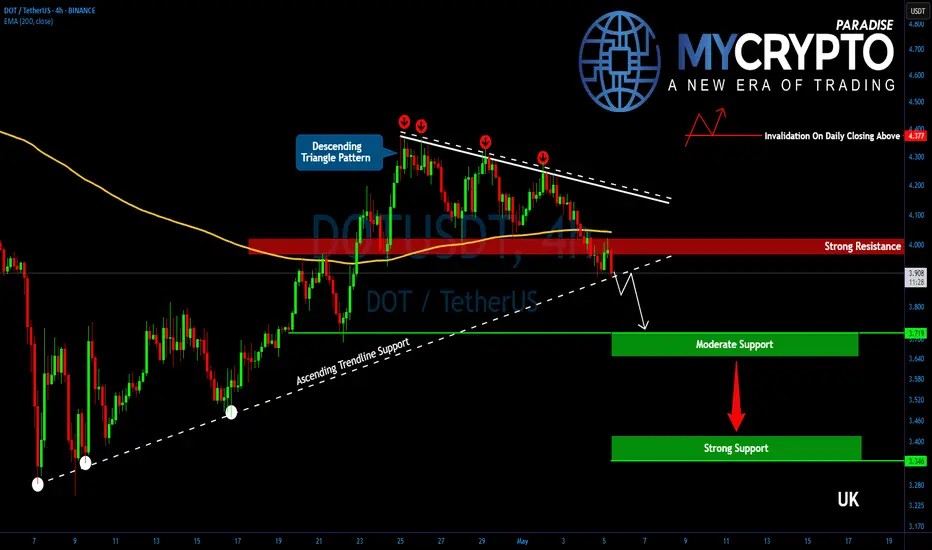
DOTUSDT Is Hanging by a Thread! Breakdown Ahead?Yello, Paradisers! Is #DOT about to hit new yearly lows? The structure is getting ugly again—don’t get caught off guard as this setup is starting to turn dangerous fast.
💎After a brief and weak corrective bounce, DOTUSDT is once again losing steam. The price has already broken down from a descending triangle—a bearish continuation pattern—and is now threatening to breach its key ascending support level. Momentum is shifting aggressively back in favor of the bears.
💎#DOTUSDT is now hanging to the critical $3.90 support level. A decisive breakdown below this zone would likely trigger another wave of selling pressure, opening the door for a drop toward the next moderate support range at $3.72 to $3.65. While this area could attract some short-term profit-taking, the broader trend remains clearly vulnerable, with bearish momentum continuing to dominate.
💎Should bearish pressure continue, and it’s highly likely at this stage that DOT could fall all the way toward the stronger support zone between $3.40 and $3.35. This region marks the 52-week low, and it's where bulls might step in to defend and attempt a meaningful rebound.
💎Additionally, the 2-hour EMA-200 has shown itself to be a strong trend guide. Every time DOT traded above it, bulls had a slight edge. But now that price has once again broken below this moving average, momentum is back with the bears.
Paradisers, strive for consistency, not quick profits. Treat the market as a businessman, not as a gambler.
MyCryptoParadise
iFeel the success🌴
DOT : Long PositionEverything is clear..
We can get a long position because price break the trend line and is up of It.