DOTUSD

Polkadot DOT Price Targets and Stop LossDOT/USDT
Entry Range: $18.50 - 20.40
Price Target 1: $23.50
Price Target 2: $27.30
Price Target 3: $30.80
Stop Loss: $15.20

DOT has massive upside from current levelBINANCE:DOTUSD
after hitting a 88% retrace DOTUSD looks to have bottomed and looking to run
will we see a macro turn around to help push these levels higher?

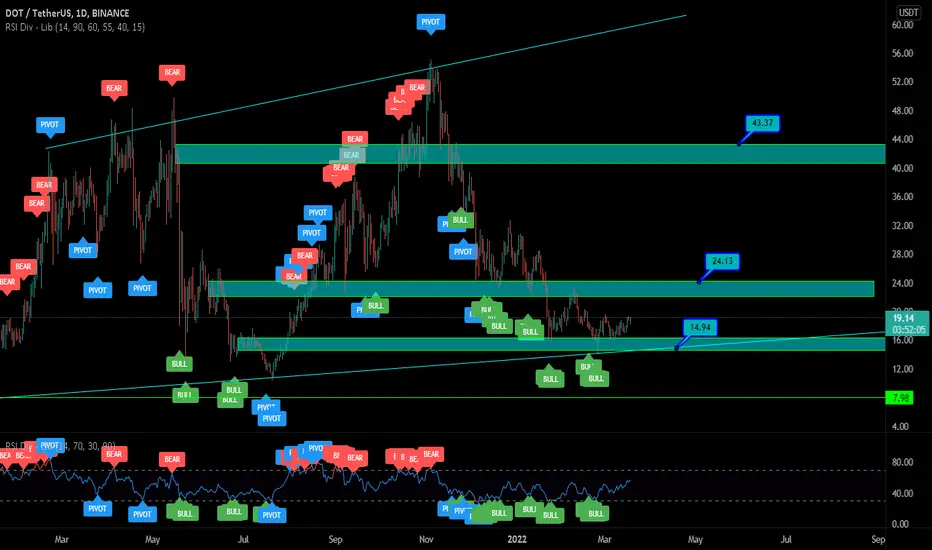
DOT LongPolkadot token (DOT) found support on higher time frame and price made a higher high formation, which was the first bullish sign after long period of price decrease from December ATH. DOT is now moving bullish from the break out of descending triangle pattern. The same pattern was established in July last year, when DOT bottomed out at around $10. RSI is nicely picking up and is in bullish zone on daily chart, price is above 13- and 20- moving average, indicating, bulls are in control.

DOT Exchange Trading Idea 22-03-20DOT is STILL hovering around 83.5% for the past two weeks or more. Really almost a month since it first came down here. As with all cryptos, there is no technical reason to expect price to move up. It even bounced off the 50 EMA this week.

Polkadot : Possible Short for #DOTShorting some #DOT if price lose the support trendline of the red Bearish triangle


Here are some of my favorite altcoins today!#UMAUSD #ForthUSD #dotusd #xlmusd #godsusd #blzusd #krlusd #mansusd #ampusd #omgusd
Traders,
Here are some of my absolute favorite coins today. All look to be primed, pumped, and ready to move up soon! Enjoy this entertainment piece.
- Stew

We might see huge down trend soonDOT is making beautiful up channel, that means we might see down trend soon. If DOT cant break above 20 we starting too see short. Closing below 18 is confirmation of short.

The golden opportunity of PolkadatFriends, we expect to see the growth of Polkadat in the near future.
TP 1 : 22
TP 2 : 28
TP 3 : 33
SL :15.30
Nearby

PolkaDot DOTUSDT - HUGE breakout is happening! New bull market.- DOT is currently breaking out of the descending channel on the daily chart!
- On the weekly chart we a have higher highs and higher lows, so there is nothing wrong with the overall bull trend.
- Also an Impulse Elliott wave finished successfully with 5 waves to the downside, so now there should at least a retracement to 0,618 FIB.
- RSI horizontal line is breaking out too.
- Together with BNB we can experience solid gains.

DOT/USDTTesting/tracking elliot wave theory. Please do not trade off idea without S/L. Not financial advice.
Link to previous chart:
www.tradingview.com
The retracement went way lower than my prediction. We're at the bottom of the red support line which would be the indication of the end of this wave (2) retracement. If this chart is to play out we cant go lower than $10.5 for the blue wave. There is another wave not shown here which can make this chart still valid if we go below. If this happens, I'll post the updated chart below. The EMA 20 (red line) is starting to curl up, if it can go above the other 3 EMA lines (refer to the white circle) then we can see a repeat of something similar on the last impulse wave which created the first blue wave (1).

DOT: long opportunity Hello Colleagues, it seems that DOT has broken the descending triangle. it is good to hold some especially between 17-19$. DOT has been undervalued for the last months, and this breakout may reverse the trend especially if it will be confirmed again by a new higher high.
My stop loss will be a daily close under 15$ which may lead to more drop.
@ Kurd_Crypt

accumulate dotdot is looking great to accumulate down here,
could potentially be close to breaking the down trend
hope u got in when i posted a week earlier
DOTUSDT, We are going to reach to the new support levelHello everybody
As we have many request to update analysis of Dot, we will update it at the end :D
As you know, Dot is one of the most powerful project in crypto that is working on connection base between blokchain with parachain and ...
The founder of project is Dr.Gavin wood , he is one of the co-founder of etheruem and ...
If you know the fundamental of any project that can help you to knoe the road map and to diagnosis which one these many project are good and it can be worthy in future
According to the chart and our previous serial analysis , we shown on chart that we are in downward trend and until we are moving in this trend to the low we didnt have any permission to take long posotion because its against of trend and now according to the trend we expect the price to have some rise up to complete their correction then its ready to make new LL and make new breakwave .
You can take short position if you have signal in the resistance zone that we shown in previous analysis. ( Signal : like reverse hammer , descending cover , pattern price or ... )
Please guys dont forget use stop loss and observe capital management
If you re attractive of Dot you can check our previous analysis to know the movement :
If you have any question, send us messages
Good Luck
Abtin


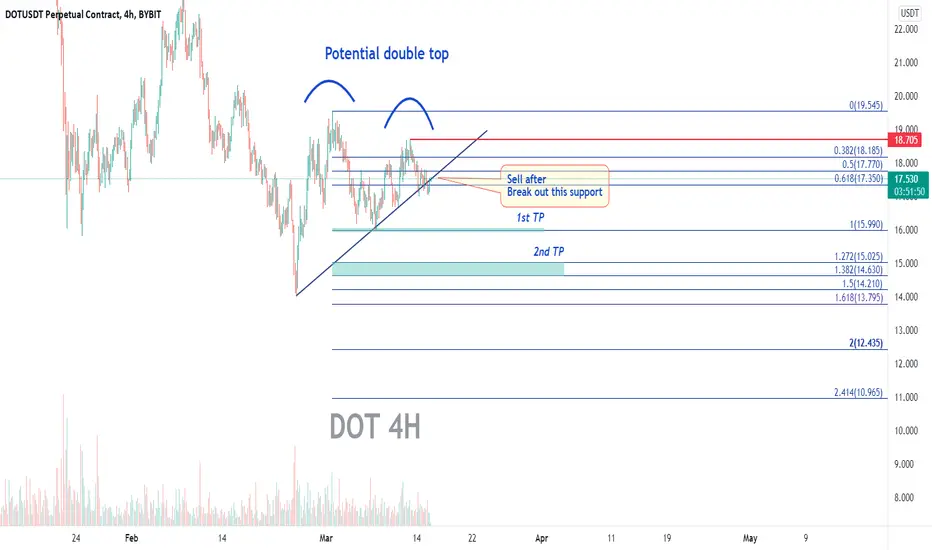
DOT - Open short after breaking out the supportBYBIT:DOTUSDT
4H trend chart
-
DOT just broke out uptrend line which is supporting price.
Now, we can sell it with trading strategy as below.
-
Profit Targets:
a) 15.99----Fib(1)
b) 15.025~14.630----Fib(1.272~1.382)
Stop losses:
a) 18.705-----Red horizontal ray
-
If you like this analysis, smash the "like button" and leave a comment below to share your thoughts
or let me know what crypto you want to see!
Trading is a reflection of yourself. Learn more daily and be ready for every opportunity.
Have a nice trading!
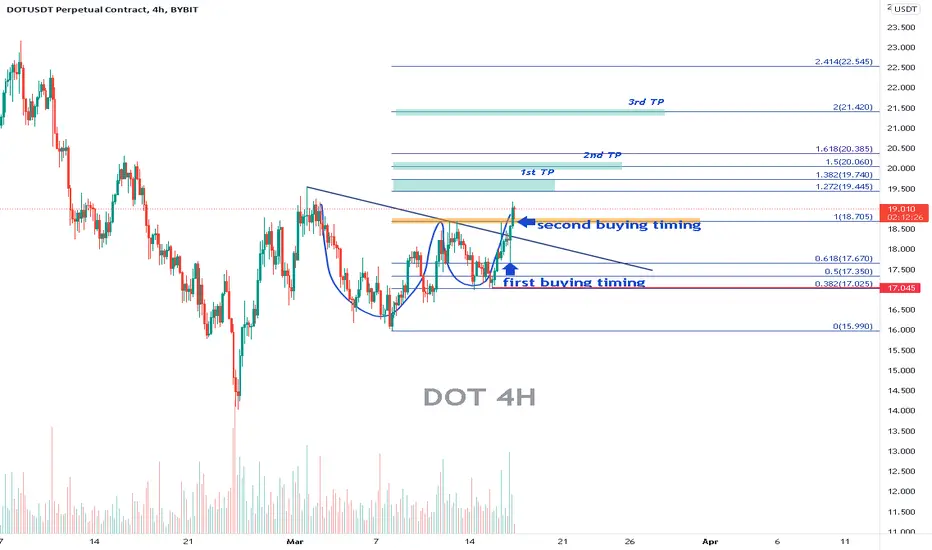
DOT - Entry for longBYBIT:DOTUSDT
4H trend chart
Last idea about short DOT is closed(hit SL).
Now, we can see it is going to form a double bottom on 4H.
There are 2 timing we can take entry as I mark on chart, and trading strategy as below.
-
Profit Targets:
a) 19.445~19.740----Fib(1.272~1.382)
b) 20.060----Fib(1.5)
c) 21.420----Fib(2)
Stop losses:
a) 17.045-----Red horizontal ray
-
If you like this analysis, smash the "like button" and leave a comment below to share your thoughts
or let me know what crypto you want to see!
Trading is a reflection of yourself. Learn more daily and be ready for every opportunity.
Have a nice trading!
DOTUSD D1: 1000%+ gains THE BEST Level to BUY/HOLD (SL/TP)(UPDATWhy get subbed to me on Tradingview?
-TOP author on TradingView
-2000+ ideas published
-15+ years experience in markets
-Professional chart break downs
-Supply/Demand Zones
-TD9 counts / combo review
-Key S/R levels
-No junk on my charts
-Frequent updates
-Covering FX/crypto/US stocks
-before/after analysis
-24/7 uptime so constant updates
🎁Please hit the like button and
🎁Leave a comment to support our team!
DOTUSD D1: 1000%+ gains THE BEST Level to BUY/HOLD (SL/TP)(UPDATE)
IMPORTANT NOTE: speculative setup. do your own
due dill. use STOP LOSS. don't overleverage.
IMPORTANT NOTE: read entire idea before
execution. Tagged as BULLISH because I expect
reversal once we hit 8/9 USD.
🔸 Summary and potential trade setup
::: DOTUSD D1 chart review
::: chart looks good /strong
::: HOWEVER short-term
::: expect 40-50% correction mode
::: setup still valid as of right now
::: previously massive BULL TRAP after
::: FAILURE to break CYCLE HIGH
::: get ready to BUY LOW later
::: expecting BEAR TRAP near 8/9USD
::: i.e. FAKE BREAKDOWN of key S/R
::: best reload bulls near 8/9USD later
::: expecting 1000% bull run
::: re-test of sliding S/R line
::: near 100 USD later
::: BULLS stay out be ready later
::: expecting short-term correction
::: BULLS get ready to BUY after CORRECTION
::: TP bulls is +1000% gains later
::: expecting decent gains soon
::: 40-55% CORRECTION short-term
::: recommended strategy: BUY/HOLD after CORRECTION
::: TP BULLS +1000% gains / 25 USD
::: BEST reload BULLS near 8-9 USD
::: TP BULLS is 100 USD final EXIT
::: SWING TRADE: BUY/HOLD IT
::: bull run not over yet
::: good luck traders!
::: BUY/HOLD and get paid. period.
🔸 Supply/Demand Zones
::: N/A
::: N/A
🔸 Other noteworthy technicals/fundies
::: TD9 /Combo update: N/A
::: Sentiment mid-term: BULLS
::: Sentiment short-term: BEARS/PULLBACK
RISK DISCLAIMER:
Trading Crypto, Futures , Forex, CFDs and Stocks involves a risk of loss.
Please consider carefully if such trading is appropriate for you.
Past performance is not indicative of future results.
Always limit your leverage and use tight stop loss.

POLKADOT - FULL Elliot Wave Breakdown ✅Polkadot is exhibiting clear wave formations which fall in line with the Elliot Wave schematic.
We have the 5 wave impulse which started late 2020 followed by an ABC correction, which we are currently in.
We are currently in the C wave which has 5 subwaves and we're currently on the 5th and last subwave heading towards the completion of the ABC correction, where we also have the 78.6 fibonacci making it a really great level to watch for BUYS.
The next move would be the impulse (wave 3 - often the biggest wave). This is likely to take us beyond ATH, for a gain of atleast 400%!
Trade Idea:
- Watch for the completion of the ABC correction at the $9-$11 level
- Once bullish price action, enter with stops below the lows
- Targets: 50, 63, 80
Goodluck and as always, trade safe!
Give it a thumbs up and let us know what other cryptocurrency you would like us to look at!

DOT: A happy/sad triangleIf it breaks above the triangle, be grateful that you hold DOTs on your pockets.
If it breaks below the triangle, you might want to release some of your DOTs if you are fully loaded :)
Thanks!

DOT Exchange Trading Idea 22-03-13DOT is hovering around 83.5% for the past two weeks or more. Really almost a month since it first came down here. As with all cryptos, there is no technical reason to expect price to move up.

Accumulating PolkaDOT I think it’s a good hold to add a for long term
My macro outlook is 2025 I see it rising 360+ not financial advice just my own thoughts and observation on a macro scale coupled with fundamentals
Also it looks like a Huge bullish pendant on the weekly that’s going to spring upwards to the heavens
Gavin wood is an extraordinary person with his work at eth and web3 as well as philanthropy efforts. I know this is the future tech.
All the best and 1love and peace
