DOT BUYhello friends
According to the pullback we had, we can enter into the transaction with risk and capital management.
*Trade safely with us*
DOTUSD

Polkadot Crypto- nothing will happen until we break this channelPolkadot has been in a descending channel for quite some time now. No bullish action can occur until this channel breaks either up or down.
If it breaks down $3.6 is a major support that will probably be bought heavily
If we break out and close above $5.75 altcoin season has probably begun.
Remember first bitcoin goes up, then big marketcap alts like Ethereum, Solana, XRP, BNB. Next are the medium cap alts like chainlink, LTC, and polkadot.
If polkadot is able to release Polkadot 2.0 there could be a a lot of hype and maybe polkadot can reach all time highs but thats only if the altcoin market pumps into 2026 otherwise JAM speculation will hit as the altcoin bear market begins.
Exciting price action to come.

#DOT/USDT#DOT
The price is moving in a descending channel on the 1-hour frame and is expected to continue upwards
We have a trend to stabilize above the moving average 100 again
We have a descending trend on the RSI indicator that supports the rise by breaking it upwards
We have a support area at the lower limit of the channel at a price of 4.50
Entry price 4.60
First target 4.72
Second target 4.85
Third target 4.99

Polkadot: Now It’s Crunch TimePolkadot has been unable to resist the widespread downturn in the altcoin sector, giving up much of its recent gains after a solid performance in recent days. Our grayed-out Target Zone for the low of the green wave is coming back into focus – though under our primary scenario, DOT shouldn’t fall much lower in the short term. If the coin drops below the $3.80 support, however, a new bear market low in our orange Target Zone between $2.40 and $1.07 will be on the horizon. In this 39% probable alternative scenario, the coin would erase all gains since the low in October 2023, implying a new bottom for the magenta wave alt. . In our primary scenario, we expect renewed buying pressure soon, which should allow the green wave to surpass the resistance at $5.38.

PolkaDot DOT Needs To Crash More Hello, Skyrexians!
As you know, globally we are very bullish on BINANCE:DOTUSDT and our previous analysis on the weekly time frame is still valid, but locally it still has not reached the bottom. Current value of fear and greed index is extreme fear and it will not allow DOT to drop immediately, some bounce is anticipated, but after that bears can take control again.
Let's take a look at the daily chart. We can suggest you this Elliott waves counting, may be it's not 100% correct, but the only one thing we need to know. The drop, which we have seen on February 3 was the wave 3 according to minimum Awesome Oscillator value. While it has not crossed zero line price is in wave 4. Yesterday we had a chance to finish this night mare, but price is pumping again and it looks like it's going to reach $5.50 max and then continue printing wave 5 to the final target $1.9-$3.2. The key points for reversal is the appearing of green dot on Bullihs/Bearish Reversal Bar Indicator and divergence on AO.
Best regards,
Skyrexio Team
___________________________________________________________
Please, boost this article and subscribe our page if you like analysis!

Do Polkadot bulls have enough power to break the downside line?MARKETSCOM:DOTUSD Polkadot is flirting with its short-term downside resistance line drawn from the high of 6th of January. In order to shift our attention to some higher areas, a break of that trendline is required. But even then we will not get too comfortable with higher areas, as the rate might find resistance near our EMAs. Let's dig in!
CRYPTO:DOTUSD
74.2% of retail investor accounts lose money when trading CFDs with this provider. You should consider whether you understand how CFDs work and whether you can afford to take the high risk of losing your money. Past performance is not necessarily indicative of future results. The value of investments may fall as well as rise and the investor may not get back the amount initially invested. This content is not intended for nor applicable to residents of the UK. Cryptocurrency CFDs and spread bets are restricted in the UK for all retail clients.

Last Shakeout Has Happened For PolkaDot DOTHello, Skyrexians!
We have seen many negative reactions on our recent analysis on XRP where we pointed out that it it in the distribution zone. We don't understand the sense t hold such overbought asset. Even if growth continues the potential is very low. It's much better to take a look at assets which are still at the bottom, like $BINANCE:DOTUSDT.
On the weekly time frame we can see that DOT tested the support level again and formed the confirmed green dot on the Bullish/Bearish Reversal Bar Indicator . This is the strong signal for the corrective global wave 2 finish. The next target is 1.61 Fibonacci extension at $88 at least. The maximal target is much higher at 2.61.
Best regards,
Skyrexio Team
___________________________________________________________
Please, boost this article and subscribe our page if you like analysis!

We are so close!I love Polkadot and community of this coin. We all know BINANCE:DOTUSDT made huge impulse about a year ago and still consolidating around it. Checking 4.5 area is crucial for BINANCE:DOTUSDT , because that means it is triple bottom which is a huge reversal pattern. If we ever see candle below 3.5 that is the point we consider Long-term long position in either Spot or Futures. Also MACD and RSI making divergence in 1W timeframe.
I will be taking profits at 20, 24, 32, 55 ( ATH ).
Polkadot: Back on the Rise?Following the recent sharp pullback, Polkadot has established an important low just above the support at $3.56, completing the orange wave ii. In the medium term, the subsequent orange impulse wave iii should drive the price significantly higher, breaking past the resistance at $11.88. However, if DOT falls below $3.56, our 39% likely alternative scenario will come into play, and the magenta wave alt. will reach a new major correction low. For this case, we have outlined our orange alternative Target Zone between $2.40 and $1.07.

#DOT/USDT#DOT
The price is moving in a descending channel on the 1-hour frame and is adhering to it well and is heading to break it upwards strongly
We have a bounce from the lower limit of the descending channel, this support is at a price of 4.10
We have a downtrend on the RSI indicator that is about to be broken, which supports the rise
We have a trend to stabilize above the moving average 100
Entry price 4.60
First target 5.40
Second target 6.02
Third target 6.80

DOTUSDT 1WDOT ~ 1W Analysis
#DOT This is the lowest support for now. Buy from here if you still have a Conviction on this coin with a minimum target of 20%+

DOT is going for 100%+Spot play, decent chart, after nice drop in to support I am considering buy here.
NOT A FINANCIAL ADVICE

Polkadot will hit a new ATH soon (2D)Before anything, pay attention to the analysis timeframe: it’s a 2-day timeframe and requires patience.
From the point where we placed the red arrow on the chart, it seems Polkadot's correction has begun.
This correction appears to be a triangle. We are currently in the middle of wave D.
Polkadot, by feeding on the demand orders marked on the chart, can move toward the red box to complete wave D.
After completing waves D and E, it can move toward the historical peak and create a new ATH.
The closure of a daily candle below the invalidation level will invalidate this analysis.
For risk management, please don't forget stop loss and capital management
Comment if you have any questions
Thank You

Support and Resistance Zone: 5.907-6.920
Hello, traders.
If you "Follow", you can always get new information quickly.
Please click "Boost" as well.
Have a nice day today.
-------------------------------------
(DOTUSDT 1M chart)
From a trend perspective, in order to start an uptrend, the price must be maintained above the MS-Signal (M-Signal on the 1M chart) indicator.
However, since the volume profile zone is formed around 9.262, the full-scale uptrend is expected to start when it rises above 9.262.
Currently, the HA-High indicator is formed at 26.351.
Therefore, if it continues to rise like this, it is possible that it will touch around 26.351.
However, since it is rare for a 183% increase to rise without a downward wave, there is a possibility that the HA-High indicator will fall and be newly created during the rise.
Therefore, if you confirmed the support near 9.262 and bought, the target point will be until it meets the HA-High indicator on the 1M chart.
Since a strong volume profile section has been formed near 19.370, the point to watch is whether it can break through this section upward.
-
(1D chart)
From a trend perspective, the 5.907-6.920 section is an important support and resistance section.
If it is supported and rises in this section,
1st: 7.480
2nd: 8.468-4.704
3rd: 9.262
4th: 10.131-10.392
You need to create a response strategy depending on whether it is supported or not in the 1st-4th section above.
If it falls below 5.907 and shows resistance, it is likely to fall to around 4.136-4.495.
If the HA-Low indicator is newly created during the decline, whether there is support in that area is important.
-
A volume profile section is formed around 9.262, but a volume profile section is also formed around 10.131.
Therefore, it is expected that a full-scale uptrend will begin only when the 9.262-10.131 section is broken upward.
If you want to trade short term, you can buy when it shows support near 6.920 and respond according to the section I mentioned earlier.
-
Thank you for reading to the end.
I hope you have a successful trade.
--------------------------------------------------
- Big picture
I used TradingView's INDEX chart to check the entire section of BTC.
(BTCUSD 12M chart)
Looking at the big picture, it seems to have been maintaining an upward trend following a pattern since 2015.
In other words, it is a pattern that maintains a 3-year upward trend and faces a 1-year downward trend.
Accordingly, the upward trend is expected to continue until 2025.
-
(LOG chart)
Looking at the LOG chart, you can see that the upward trend is decreasing.
Accordingly, the 46K-48K range is expected to be a very important support and resistance range from a long-term perspective.
Therefore, it is expected that prices below 44K-48K will not be seen in the future.
-
The Fibonacci ratio on the left is the Fibonacci ratio of the uptrend that started in 2015.
In other words, it is the Fibonacci ratio of the first wave of the uptrend.
The Fibonacci ratio on the right is the Fibonacci ratio of the uptrend that started in 2019.
Therefore, it is expected that this Fibonacci ratio will be used until 2026.
-
No matter what anyone says, the chart has already been created and is already moving.
It is up to you how to view and respond to this.
If the ATH is renewed, there are no support and resistance points, so the Fibonacci ratio can be appropriately utilized.
However, although the Fibonacci ratio is useful for chart analysis, it is ambiguous to use it as support and resistance.
The reason is that the user must directly select the important selection points required to generate Fibonacci.
Therefore, since it is expressed differently depending on how the user specifies the selection points, it can be useful for chart analysis, but it can be seen as ambiguous to use it for trading strategies.
1st: 44234.54
2nd: 61383.23
3rd: 89126.41
101875.70-106275.10 (when overshooting)
4th: 134018.28
151166.97-157451.83 (when overshooting)
5th: 178910.15
-----------------

DOTUSD Plunge Alert Precision Short Targeting 10%+ Gains !The asset, DOTUSD, is showing a sharp bearish momentum with a decline indicating strong selling pressure.
The current price is 6.905, while the short entry position aligns with a retracement after a peak profit zone
1. Trend Direction
The price has broken below green channel, signaling a trend reversal from bullish to bearish.
Red zones around the moving averages confirm the presence of downward momentum.
2.Entry Confirmation
The short position appears to be placed after the market failed to hold its highs (Peak Profit 10.14%) and created lower highs, validating the short trade setup.
Entry aligns with the rejection of resistance levels, suggesting a good risk-to-reward setup.
3. Risk Management
Stop-loss is placed slightly above the sell zone, covering the recent swing high. This limits risk in case of price retracement.
The profit target extends well below the entry, suggesting confidence in further downside potential.
4. Aetos Indicators
A potential momentum-based or moving average indicator is being used to highlight peak profit areas, confirming optimal trade execution.
The bearish engulfing candles in the sell region validate the short bias.
Projection
Target Zone: The profit target aligns with the 6.230 support level, indicating expectations of a 10% drop from the entry point.
Downside Risk: If bearish momentum continues, there could be a breakdown below 6.230, extending losses toward 6.000 or lower.
Analysis
DOTUSD is experiencing a sharp bearish reversal after failing to hold its highs. The short entry capitalizes on lower highs and rejection near the resistance. Stop-loss is strategically placed above recent highs, while the target aligns with key support levels. This trade setup is supported by
Bearish momentum.
Clear breakdown below the moving average channel.
High risk-to-reward ratio for short-term traders.
Strategy
Stay short below 6.905, targeting 6.230. If price retraces above 7.00, consider exiting the position. Always book profits partially and move SL to BE

DOTUSDT 1WDOT Update ~ 1W
#DOT Still maintaining its bullish structure. This is wave 2. buy in stages from here. With a minimum target of 20%++. Wave 3 is the longest wave in the Eliot Wave pattern.
Will #DOT Break Free or Get Caught in a Bearish Trap? Key LevelsYello, Paradisers! #DOTUSDT is gearing up for a major move, but will it be a breakout to new highs or a collapse to lower levels? Let’s dive into the current setup of #Polkadot:
💎#DOT is trading within a falling wedge formation, a classic bullish reversal pattern often seen before significant price surges. Over the last few weeks, we’ve seen multiple liquidity sweeps at lower levels, where impatient traders got shaken out. These sweeps usually hint at a potential breakout, but confirmation is still key before making any decisive moves.
💎#DOTUSD faces strong resistance near $8.00, which aligns with the upper boundary of the falling wedge. For bulls to take control, the price must close above this level on the 8-hour timeframe. A breakout here could trigger a powerful rally toward the $11.00–$11.5 major resistance zone, where sellers are likely to step in.
💎The first significant support level sits at $6.41, an area where buyers have consistently entered the market. If this zone holds, it could serve as a springboard for the next upward move. If #Polkadot closes below $6.41, the next major support lies between $5.80–$5.34.
💎A close below $5.34 would signal a breakdown of bullish momentum, increasing the likelihood of a prolonged bearish phase. The bears will take control of the price movement and it will fall to lower support levels.
Stay focused, patient, and disciplined, Paradisers🥂
MyCryptoParadise
iFeel the success🌴

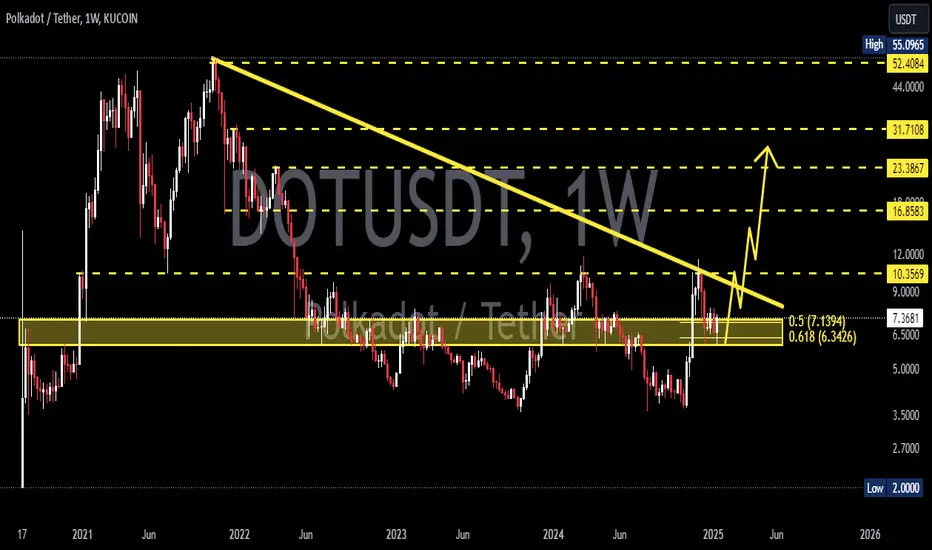
Polkadot is aiming for $20Polkadot is quite old and large asset with capitalisation already exceeding $10B. It is one of the few that has not yet shown significant growth like XRP, XLM and other old guys. It is quite difficult to move such an asset, but the target of around $20 is quite realistic. On the daily timeframe there is a consolidation above 50 EMA, we saw a test pump. The growth will start during these two months and then the distribution phase. The 0.5 and 0.618 levels are not bad options to fix your positions.
Horban Brothers.

DOT/USD "Polkadot vs USD" Crypto Market Bullish Heist Plan🌟Hi! Hola! Ola! Bonjour! Hallo!🌟
Dear Money Makers & Robbers, 🤑 💰
Based on 🔥Thief Trading style technical and fundamental analysis🔥, here is our master plan to heist the DOT/USD "Polkadot vs USD" Crypto market. Please adhere to the strategy I've outlined in the chart, which emphasizes long entry. Our aim is the high-risk Red Zone. Risky level, overbought market, consolidation, trend reversal, trap at the level where traders and bearish robbers are stronger. Be wealthy and safe trade.💪🏆🎉
Entry 📈 : You can enter a Bull trade at anypoint,
however I advise placing Buy limit orders within a 15 or 30 minute timeframe. Entry from the most recent or closest low or high level should be in retest.
Stop Loss 🛑: Using the 4H period, the recent / nearest low or high level.
Goal 🎯: 10.500
Scalpers, take note 👀 : only scalp on the Long side. If you have a lot of money, you can go straight away; if not, you can join swing traders and carry out the robbery plan. Use trailing SL to safeguard your money 💰.
Warning⚠️ : Our heist strategy is incompatible with Fundamental Analysis news 📰 🗞️. We'll wreck our plan by smashing the Stop Loss 🚫🚏. Avoid entering the market right after the news release.
Fundamental Outlook 📰🗞️
Considering these factors, the DOT/USD pair may experience a Bullish trend in the short-term, driven by:
Increasing adoption and usage of DOT, driven by its interoperability features and growing ecosystem.
Improving blockchain development and scalability.
Growing developer interest and user adoption.
Bullish Factors:
Increasing adoption and usage of DOT, driven by its interoperability features and growing ecosystem.
Improving blockchain development and scalability.
Growing developer interest and user adoption.
Potential for increased institutional investment and mainstream recognition.
Competitive advantages over other cryptocurrencies, such as faster transaction times and lower fees.
Please note that this is a general analysis and not personalized investment advice. It's essential to consider your own risk tolerance and market analysis before making any investment decisions.
Take advantage of the target and get away 🎯 Swing Traders Please reserve the half amount of money and watch for the next dynamic level or order block breakout. Once it is resolved, we can go on to the next new target in our heist plan.
Keep in mind that these factors can change rapidly, and it's essential to stay up-to-date with market developments and adjust your analysis accordingly.
💖Supporting our robbery plan will enable us to effortlessly make and steal money 💰💵 Tell your friends, Colleagues and family to follow, like, and share. Boost the strength of our robbery team. Every day in this market make money with ease by using the Thief Trading Style.🏆💪🤝❤️🎉🚀
I'll see you soon with another heist plan, so stay tuned 🫂

Best Buy in DOT📊 DOT/USDT Analysis
🔹 The price remains in a short-term downtrend, currently testing the dynamic resistance of the descending trendline.
🔹 The EMA50 ($7.26) is acting as strong resistance, and breaking above it could trigger a bullish wave.
🔹 Key support lies in the $6.11 - $6.90 range, and losing this zone might lead to further downside risk.
🔹 If resistance levels are broken, the next target could be the $10.42 range. 🚀
📈 RSI Indicator suggests reduced selling pressure and a potential trend reversal.
💡 What do you think of this analysis? Is DOT ready for a breakout? 🤔

PolkaDot DOT Has Just Flashed Insane Long Signal!Hello, Skyrexians!
Recently we made BINANCE:DOTUSDT analysis for you, where told you that huge pump ahead. There was a price at $5. After that price reached $11 and showed the significant correction. Now most of people are talking that DOT is scam and will reach $2, but we have other opinion.
Let's take a look at the daily time frame. As we mentioned before the growth from the bottom to $11 was just the wave 1 of the bull run. May be you don't believe me, but the shape of this wave looks like 5 Elliott waves impulse. Correction has a clear zigzag shape and has been finished inside the 0.61 Fibonacci retracement zone. It was ABC in wave 2. We have seen recently the green dot printed by Bullish/Bearish Reversal Bar Indicator . This is strong long signal. As always, alerts from this indicator are automatically replicated on my accounts. You can find the information in our article on TradingView .
The next expected move is the wave 3 inside global wave 3. It shall be rapid without corrections. We expect the nearest target between $19 and $22 in the upcoming 2 months.
Best regards,
Skyrexio Team
___________________________________________________________
Please, boost this article and subscribe our page if you like analysis!

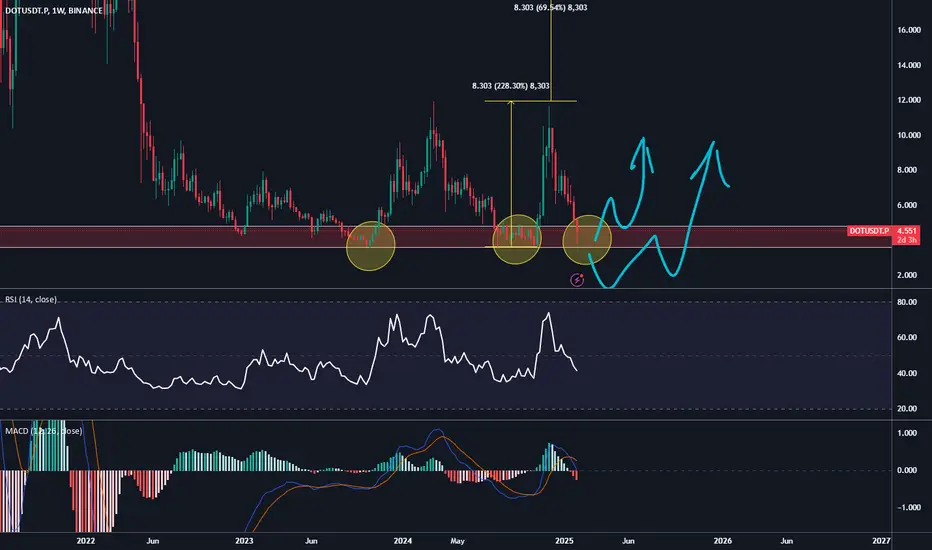
DOTUSDT 1WDOT Update ~ 1W
#DOT Still maintaining its bullish structure. This is wave 2. buy in stages from here. With a minimum target of 20%++. Wave 3 is the longest wave in the Eliot Wave pattern.

DOT - Getting ready to bounce back#DOT/USDT #Analysis
Description
---------------------------------------------------------------
+ DOT is forming a higher low and price is getting consolidated within the zone.
+ I'm expecting a clear bounce back from this zone.
+ Price can easily reach the previous ATH
---------------------------------------------------------------
VectorAlgo Trade Details
------------------------------
Entry Price: 7.47
Stop Loss: 4.8
------------------------------
Target 1: 10
Target 2:16
Target 3: 23
Target 4: 31
Target 5: 40
------------------------------
Timeframe: 1W
Capital Risk: 1-2% of trading amount
Leverage: 5-10x
---------------------------------------------------------------
Enhance, Trade, Grow
---------------------------------------------------------------
Feel free to share your thoughts and insights.
Don't forget to like and follow us for more trading ideas and discussions.
Best Regards,
VectorAlgo
