DOT/USD - NEW All-Time High... Rocket launch to MOON ! 🚀🚀🚀NEW all-time high... you know what follows... MOON TIME. :D
Like and follow if you liked my idea!
DOTUSD

DOT, 60, 100 or 180❓❓❓I have un-stake my DOTs and ready for TP, The end of this bull cycle is near.. December or maybe January.
PolkaDot is one of my favorite coins, I believe it has very strong fundamental back-up and it will be an important part of crypto future.
The TA is simple by combining some different Fibonacci in normal and logarithmic chart I came to this analysis, that you can see on the chart.
Don't forget to hit the like button if you like this analysis and feel free to ask me your questions or your ideas in comment section ;)

DOTUSDT Ready to make new ATH!DOTUSDT (Day Chart) Technical Analysis Update
DOT/USDT currently trading at $44.90
Buy level: $40.00 - 45.00
TP 1: $60.00
TP 2: $75.00
TP 3: $85.00
TP 4 : $100
Stop loss: $38.00
Max Leverage: 1x or buy it on spot market
Always Keep stoploss

DOT resistance touched and now ? DOT finally got to his resistance area at 48$ and therefore as completed 1st target.
Now of course i wouldn't recommend buying here as the resistance could reject the price. I see 2 possible plans :
1 : Prices break and close in Daily above the resistance area (above 51$) and we would look at pullback between 48$ to 51$ to enter long.
2 : Prices get rejected and go find support at 45$ level, which could act as support before a break of the main resistance.
If i would be already long i would take some profit there and wait for lower prices to enter long again. I don't have a clear view so i would be waiting for option 1 or 2 to happen before acting.

We Dancin'Close above 47.02 to clear the previous 2 week highs and 161 fib level means we are doing the Polka al the way to 60.

✅DOTUSDT - We call this Surge, Hit our 2nd TP in 3 hrsBYBIT:DOTUSDT
-
Congrats for those following this strategy!
-
As usual, do not forget to take profit at 2nd TP we set, you can hold the rest until TP3.
Just take it anytime you satisfy.
-
Also, I set a new SL $44.825 for you to protect your unrealized profit.
Have a good day!.
-
If you like this analysis, smash the like button and leave a comment below to share your thoughts
or let me know what crypto you want to see!
Trading is a reflection of yourself. Learn more daily and be ready for every opportunity.
Have a nice trading!


DOTUSDT Analysis (Long term) 1D trend chart
-
We have a breakout from $41 resistance. The long term trend shows that new resistance will create at $49. If it broke outs which a continues uptrend is showing that it will broke out, it will fly to $56 to $70
-
Profit Targets:
a) 55.83----Fib(1.168)
b) 62.94----Fib(2)
-
Stop Loss:
41 --- Fib(.786)
I provide 2 SL, depended on the risk you can take!
-
If you like this analysis, give it a like and leave a comment below to share your perspective
or let me know what crypto you want to see!
Trading is a reflection of yourself. Learn more daily and be ready for every opportunity.
God Speed!

DOTUSDT - Entry Timing?BYBIT:DOTUSDT
1H trend chart
-
DOT has built a double bottom pattern.
Now it just broke the neckline in 1H chart.
If price can be keeping here w/o wicks top, trading strategy as below.
-
Profit Targets:
a) 46.035----Fib(1)
b) 46.7~47.415----Fib(1.272~1.382)
c) 60.445----Fib(2
Stop losses:
a) 41.050-----Red horizontal ray
-
If you like this analysis, smash the "like button" and leave a comment below to share your thoughts
or let me know what crypto you want to see!
Trading is a reflection of yourself. Learn more daily and be ready for every opportunity.
Have a nice trading!

DOT calm trend and accumulationDOT continues on its leisurely path, without much hesitation. Is DOT waiting for bigger waves? for sure but before that there will be a lot of fear in the market, it's worth having a stop loss

DOTUSD: Round 2After successfully destroying the sell with the team, we are looking to push the price back up into the highs and think this could be a great entry point.
I am entering this swing buy, details are below.
Trade at your own risk & discretion.
BINANCE
Pair: DOTUSDT LONG
Leverage: Cross 25x
Entry: 42.643
Targets: 46.986
SL: 41.240
1:3R

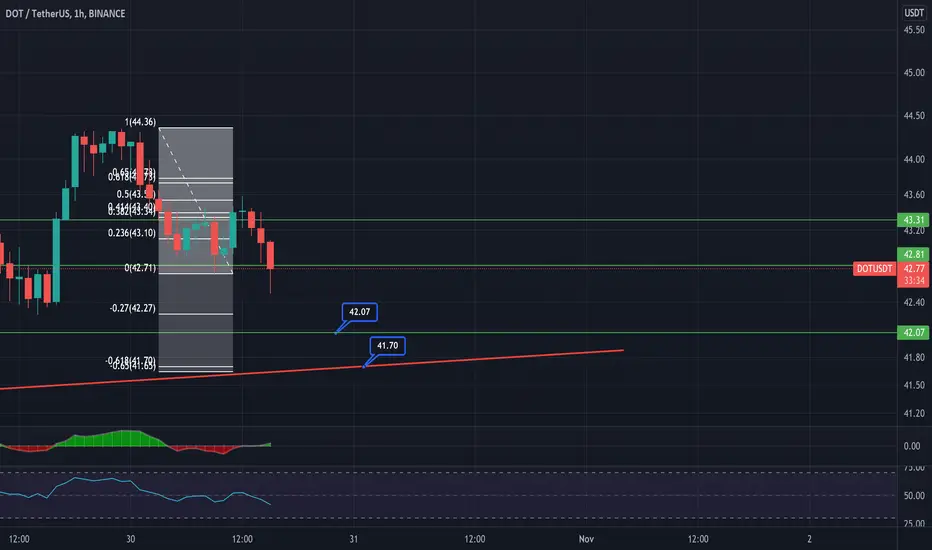
DOTUSD Analysis 30/10/2021Update from previous analysis:
Last time I spoke about Dot I did say I favoured the downside short term and also commented on my buy positions being from $41 down to $39.4, I didn't quite call the exact bottom but I was within 1% of it and all of my buys did get hit which resulted in a scary (for 2 seconds) but very profitable trade.
Right now and for the past couple days DOT has been too risky for me, the market has been so volatile and I am glad I haven't FOMO'd in yet. we are currently finding support at my green line here as I am writing this but it is being tested a lot I actually favour a break to the downside and this is where I will be making my next long move. I have taken a fib from the top to the bottom to look for bearish retracement targets, first target for a small entry would be the $42 level then a strong support is at the 41.70 being my trend line which has held lovely throughout, we have not seen a candle close below this trend line in weeks, also you can see the golden pocket (0.618) fib is exactly at the 41.70 level so I am hoping that will be enough to not allow a candle close below this level.
PolkaDot Did 94% profit and still $100 Potential #DOTUSDT update:-
$DOT did 94% profit from our entry.
Now..?
Now $48 is strong support if break then we can see New ATH soon toward $100
Support:- $38
Resistance:- $48
#cryptocurrencies #DOT #PolkaDot #alts #NFT

Maybe the last chance to buy dot before start crowdloanThose who want to invest in X.com should pay attention.
Perhaps the last opportunity to buy dot in these areas.

Highly anticipated Polkadot Parachains auction is bullishHello everyone,
It's been a while, i've been very busy with The OWL channel. Here is a DOTUSDT chart. Polkadot is looking good, KDJ is green on every timeframes and DOT keep creating higher high..
Resistance to watch :
0.9 at 44.58$
1.23 at 57.06$
Going over 57$ and confirming 57$ new support can trigger another swing to :
161.8% = 68.55$
175% = 72.30
200% = 79.41
261.8% = 96.99$
Last 2 weeks candle push us over the last tweezer top resistance (green dots lines).. Now not much resistance left until last ATH and the 1.23 fib.
Parachain Auction will start soon for Polkadot... first auction is slated to begin on Nov. 11.
Which you the best ! Crypto Mercy

Polkadot ready for a swing to 68$It's been a while, i've been very busy with The OWL channel. Here is a DOTUSDT chart. Polkadot is looking good, KDJ is turning and the RSI is responding, no divergence on the last higher high.. We are now very near a new ATH...
What to watch : Resistance 1.23 at 57$
Going over 57$ and confirming 57$ new support can trigger another swing to :
161.8% = 68.55$
175% = 72.30
200% = 79.41
261.8% = 96.99$
Last 2 weeks candle push us over the last tweezer top resistance (green dots lines).. Now not much resistance left until last ATH and the 1.23 fib.
Which you the best ! Crypto Mercy

DOTUSD - THE 2021 Q4 PLAY DOT HOLDING THE LINE - coiling up for the move to the fib, made it easier to see where im getting my levels from on one hand and then the clear 4hr tf to show where we're going on the next pump

DOT - UPDATE! LOOKING FOR A BOUNCE!AS IS THE REST OF THE MARKET! WE'RE LOOKING FOR A BOUNCE! This will depend on the BTC idea I posted (see link below)
A couple spots to watch are identified in the chart. We're in a very volatile area of the markets right now BUT I think we ARE NEAR the bottom of that!
CAUTION TRADERS AND LEVERAGE USERS!
IF YOU HODLING - NO WORRIES! THE MARKET SENTIMENT IS STILL BULLISH AND THIS PULLBACK IS NORMAL
*This is NOT financial advice. This is just an IDEA based off my experience analyzing charts and studying crypto. I recommend researching cryptocurrency because of the potential for you to become A BELIEVER of this technology and its future (FUNDAMENTALS ARE WHAT MAKE OR BREAK CRYPTO) IF YOU HAVE THIS, INVESTING BECOMES MUCH EASIER!*

DOTUSD: Amazing Sell OpportunityDOT has really caught my attention over the last few days.
It seems like price wants to return to mitigate the sellers from the head and shoulders breakout.
Once we eliminate these sellers, liquidity will be created and we could potentially sell DOTUSD all the way down into the equal lows.
What do you think of this analysis?
Please, support this post with a like and comment!

DOT Remains bullish.. Target 50USD+Dear traders,
I've posted earlier some trade idea's regarding DOT, here is an update regarding latetst DOT trade.
The pattern DOT is currently forming, is mines insights an leading diagonal wave 5 pattern of the major wave 3.
So we remain bullish and will compound profits on the major wave 4 dip. Wich is expected around .382 and 100% projections wave 1-2.
From there we remain extremely bullish since DOT will target AT least the major wave 5 target 50USD.
After completing this wave pattern, there is a possibility to have a dip on the minor cycle wave 4 pattern.. however that is still long time to go.
So I need to observe the development of the major wave 5 and will update count as is needed.
So stay tuned and keep a watch on me as I will frequently update some counts in EW perspective.
Currenlty still holding LONG dot positions ..

DOT TrendPolkadot price is going through full-size resistance as it sits interior a supply region. Clearing this barrier will open the course for DOT to retest its all-time high and set a new one.
Polkadot price is presently consolidating inside the $40.06 to $48.34 supply sector.
DOT would possibly dip to the $37.50 support floor from wherein it could catalyze a 65% bull run.
A decisive close under $33.27 will invalidate the bullish thesis.

DOT/USD Analysis 24/10/2021update from previous analysis:
previously we were looking at a rising wedge for DOT but a break to the upside actually looked favourable, we done exactly what I mention on all of analysis's which was a swing fail to one side before a sharp drop the other direction, I marked the bullish target on that analysis but we actually came down and perfectly met my bearish target. we have consolidated ever since, there is clearly a large amount of volume in this area.
we have formed a penant here and a breakout is inevitable, I am going to say that I actually favour the downside I think everything needs a nice sharp drop tomorrow let the RSI and MacD reset on larger timeframes like the 4hr/ daily.
I have marked notable price targets, personally I have buys starting to average in from the $41 level and more buys down to $40, I think we could possibly see 39.5 but DOT is one of the most bullish coins in crypto right now so I think the buying pressure at these levels will be insane.

POLKADOT about to test it's ATHPolkadot is entering a very interesting phase in it's development. On the 11.Nov the "PARACHAINS" auctions will begin, this event is a milestone in the ambition that Gavin Wood hve for an interconnected blockchain framework.
On the chart analysis, we can already see how this event is positively affecting the price action. DOT has been rising from 33 USD support zone to 46 USD in a matter of days, however the resistance zone that the price is actually testing will be determinant for the incoming price action.
We are waiting for a daily and weekly breakout of the 49/50 USD with a closure above this area in order to clear this resistance zone and see further increase in the price action for the incoming weeks, that we know, will bring lights and interest on the polkadot token because of the auctions ...
The best place to accumulate were the 28/33 accumulation range, as we told on our discord channel, however, to have limited risk and have a better RR in our swing trend, we have to be patient and wait for the 49/50 USD area to be cleared for this bullish trend to continue and take new positions
We have to be patient and cautious in order to manage our risk
The content covered in this publication is NOT to be considered as investment advice.
Thank you all,
If you enjoyed this analysis please mark a thumbs up and do not hesitate to share your point of view in the comment section.
Have a Good day and Safe trade
Butterfly .D
/Metamorphose your portfolio
