Dot means Directly landing On The moon 2 Scenario
Bullish Red brush drawing "Somewhere inside box will be ATH for current cycle"
Very bullish Green drawing
depending on channel
higher probability is red
Below 26 = wrong count
DOTUSD

DOTUSD Bullish TargetTargeting the 1.272 Fib level which is placed within a parallel channel that can be developed
DOT has been acting very bullish lately
Hence the chart

DOTUSD Seems Promising in long term...Here's the Elliot wave analysis of DOTUSD...
At the moment, we have to wait a little before a buy confirmation...
Trend seems to be BUY, and analysis goes in that direction too, so let's go with it homies!!
Time to fire up your BOSS!!
DOT gonna make the difference lol!!
Regards,
Prab S.

DOTUSDT - Combine 2 candles and 2 appropriate points for entryBYBIT:DOTUSDT
1H trend chart
-
Price left a long tail before, then rallied rapidly.
Here, we can combine them as 1 candle, means support level around $41 still works.
Now, it broke out this short-term downtrend line, so here is a first timing you can open long.
However, there is a resistance zone around $42.84, can confirm price stands at it or not.
In a nutshell, closure of previous candle $42.515 is 1st point
2nd point is $42.84 if stood firm of 1H chart.
I suggest that 2nd point, which is low-risk strategy.
-
Profit Targets:
a) 44.81----Fib(1)
b) 46.21~46.77----Fib(1.272~1.382)
Stop losses:
a) 41.345----Red horizontal ray
b) 39.515----Red horizontal ray
I provide 2 SL, depended on the risk you can take!
-
If you like this analysis, give it a like and leave a comment below to share your perspective
or let me know what crypto you want to see!
Trading is a reflection of yourself. Learn more daily and be ready for every opportunity.
Have a nice trading!

dot chanellDot is in uptrend chanell . Now its in mid line and 41.5 support. It's a matter of time to see when it starts to rise
"DO NOT OPEN A SHORT POSITION"

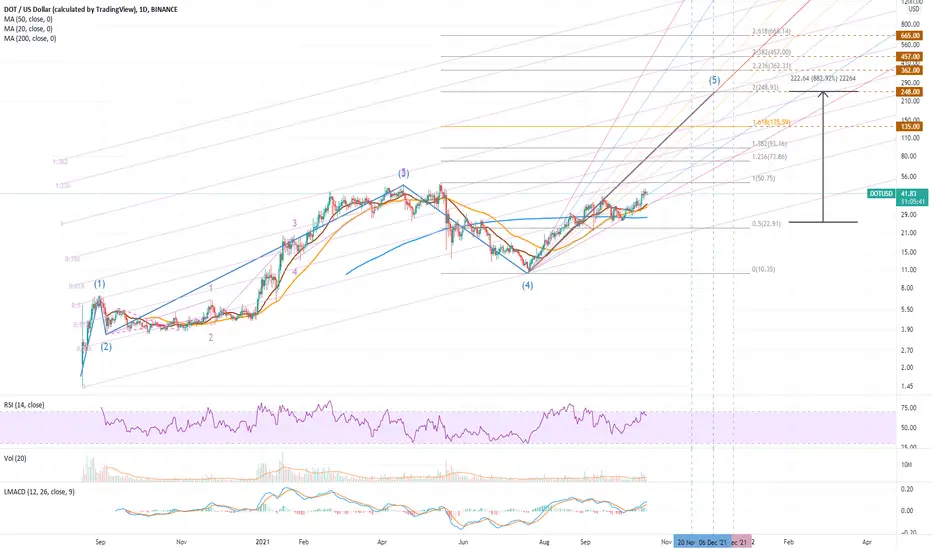
Polkadot (DOT) - Structure and TargetsA study in DOT, identifying a Fibonacci Channel containing the price action, a Pitch Fan providing lines of support and resistance, and an Elliot Wave apparently working its way towards a wave 5 climax.
What are your target levels for DOT and when will they hit?
DotPrice is in downtrend chanell.
Price back from 0.618 fibonacii thats good.
If bitcoin goas up again we will see 47 $

THOT Dot Dot Dot Chart by CryptoKneeThe last chart was wrong about the omlu but pretty dang close to catching the pivot point. It broke a yuge resistance area, now it just has to come down and find some support and flip it. Have a bear and bull count on here, not saying the Wave 3 is done yet, the more PA pumps the better, more proportionate, it would look. Holding 38.50 would be pretty huge because a break below could turn it back into resistance pretty quick, I reckon. Either Bull or Bear could potential play off that level if it continues to show a reaction to the area. MO.

DOTUSDT - another short-term try of breaking out!BYBIT:DOTUSDT
1H trend chart
-
$42.38 is the closure of previous candle and broke out the short-term downtrend line
It's a nice timing for entry.
Trading strategy as below
-
Profit Targets:
a) 44.81----Fib(1)
b) 46.21~46.77----Fib(1.272~1.382)
Stop losses:
a) 41.2----Red horizontal ray
-
If you like this analysis, give it a like and leave a comment below to share your perspective
or let me know what crypto you want to see!
Trading is a reflection of yourself. Learn more daily and be ready for every opportunity.
Have a nice trading!


Polkadot (DOT) - October 17Hello?
Welcome, traders.
By "following", you can always get new information quickly.
Please also click "Like".
Have a nice day.
-------------------------------------
(DOTUSD 1W Chart) - Mid-Long-Term Perspective
Above the 10.16 point: expect the uptrend to continue
16.15-20.27 or more: Expected to create a new wave.
(1D chart)
A volume profile section is formed over the section 10.16-23.03.
Accordingly, if the price is maintained above this range, it is expected to create a new wave.
Also, if the price is maintained above the support and resistance zone formed over the 29.85-38.69 zone, the uptrend is expected to accelerate and record a new high.
If it falls from the 29.85 point, a short-term Stop Loss is required.
------------------------------------------
We recommend that you trade with your average unit price.
This is because, if the price is below your average unit price, whether it is in an uptrend or in a downtrend, there is a high possibility that you will not be able to get a big profit due to the psychological burden.
The center of all trading starts with the average unit price at which you start trading.
If you ignore this, you may be trading in the wrong direction.
Therefore, it is important to find a way to lower the average unit price and adjust the proportion of the investment, ultimately allowing the funds corresponding to the profits to regenerate themselves.
------------------------------------------------------------ -----------------------------------------------------
** All indicators are lagging indicators.
Therefore, it is important to be aware that the indicator moves accordingly as price and volume move.
However, for the sake of convenience, we are talking in reverse for the interpretation of the indicator.
** The MRHAB-O and MRHAB-B indicators used in the chart are indicators of our channel that have not been released yet.
(Since it is not publicly available, you can use this chart without any restrictions by sharing this chart and copying and pasting the indicators.)
** The wRSI_SR indicator is an indicator created by adding settings and options to the existing Stochastic RSI indicator.
Therefore, the interpretation is the same as the traditional Stochastic RSI indicator. (K, D line -> R, S line)
** The OBV indicator was re-created by applying a formula to the DepthHouse Trading indicator, an indicator disclosed by oh92. (Thanks for this.)
** Support or resistance is based on the closing price of the 1D chart.
** All descriptions are for reference only and do not guarantee a profit or loss in investment.
(Short-term Stop Loss can be said to be a point where profit and loss can be preserved or additional entry can be made through split trading. It is a short-term investment perspective.)

DOT Ready for new ATHThe announcement of the Polkadat parachain date has created the conditions for this cryptocurrency to experience a new ATH
breaking the 46$ resistance and then 50$ and reach a new ATH in less than a week.
I think this can happen in less than couple days

Polkadot!As you can see, the price is on strong support and is coming back from this area. If we cross the resistance and the half-channel line and the price stabilizes, we will see more price growth. Marked areas are good places to buy.

Dot inverse head and shoulder weeklyWeekly time frame is a clear inverse head and shoulder, as you can see we currently breaking the neckline of the resistance.
We should find support around the 45$
And if is it play out, the target will be around 69$

DOT. Parachain ready.DOT"s ready to take on ethereum and the rest of the L1s. We should see DOT's valuation double over the coming weeks and months to challenge ADA and BNB's marketcap and as whales flip their BTC gains into altcoins. An easy 2x is a bare minimum for DOT.

DOTUSDT - Good timing for entry!BYBIT:DOTUSDT
1H trend chart
-
$41.995 is a nice timing because confirmation of breaking out the downtrend line
Also, potential double bottom is forming, so I regard it as a great time for entry.
Trading strategy as below
-
Profit Targets:
a) 43.240----Fib(1)
b) 46.275~47.505----Fib(1.272~1.382)
c) 50.135----Fib(2)
Stop losses:
a) 39.500----Red horizontal ray
-
If you like this analysis, give it a like and leave a comment below to share your perspective
or let me know what crypto you want to see!
Trading is a reflection of yourself. Learn more daily and be ready for every opportunity.
Have a nice trading!
