DOTUSDT 1H - TRIANGLE Resolution UP or DOWN ???If you like my AT, and you agree with the approaches, please FOLLOW ME and press BOOST so we can share it with more people. We are working on an automated Trading tool so that everyone can apply their strategies professionally. Thank you!
______________________________________________________________________________
DOTUSDT 1H - TRIANGLE Resolution
One thing is the analysis in long time frames and another very different thing in shorter time frames.
In fact, it is necessary to have the perception of both at the same time for our decision making.
Although DOT is at a very attractive price to BUY, we have to study what would be the best time to enter the value.
In the 1H analysis, we can see the triangulation zone where it is located. It is better to wait to see how it is resolved even if you end up paying a little more for the token.
LEVELS:
SL: 3.90
TP1: 4.90
TP2: 6.55
_______________________________________________________________________________
All these strategic alternatives can be configured with TradeX BoT, as it will allow you to position in both directions without having to block any amount per position. It will only be necessary for the conditions to be met, either downwards or upwards, for the orders to be executed in one direction or the other, taking the necessary deposits from your portfolio.
TradeX BoT (in development): Tool to automate trading strategies designed in TradingView. It works with both indicators and technical drawing tools: parallel channels, trend lines, supports, resistances... It allows you to easily establish SL (%), TP (%), SL Trailing... multiple strategies in different values, simultaneous BUY-SELL orders, conditional orders.
This tool is in the process of development and the BETA will soon be ready for testing.
FOLLOW ME and I will keep you informed of the progress we make.
I share with you my technical analysis assessments on certain stocks that I follow as part of the strategies I design for my portfolio, but I do not recommend anyone to operate based on these indicators. Get informed, train yourself and build your own strategies when it comes to investing. I only hope that my comments help you on your own path :)
DOTUSD

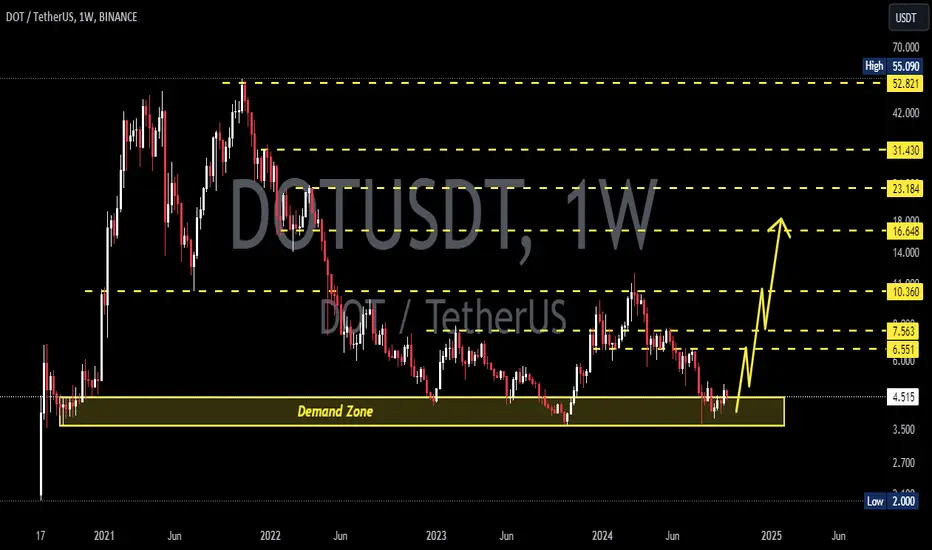
DOTUSDTDOT ~ 1W
#DOT Price reaches the demand zone again., Make purchases gradually with a target of at least 20%+ from here.

DOTUSDT 1D - At Lows, Time to BUY?DOTUSDT 1D - At Lows, Time to BUY?
POLKADOT is one of the great projects of the last bull run that reached its highs at $55 but is currently at lows around $4.
It seems impossible for it to fly so high again, but we can set more realistic expectations.
LEVELS:
SL: 3.5
TP1: 6.6
TP2: 9.6
TP·: 16
All these strategic alternatives can be configured with TradeX BoT, since it will allow you to position in both directions without having to block any amount per position. It will only be necessary for the conditions to be met, either downwards or upwards, for the orders to be executed in one direction or the other, taking the necessary deposits from your wallet.
TradeX BoT (in development): Tool to automate trading strategies designed in TradingView. It works with both indicators and graphic design tools: parallel channels, trend lines, supports, resistances... It allows you to easily establish SL (%), TP (%), SL Trailing... multiple strategies in different values, simultaneous BUY-SELL orders, conditional orders.
This tool is in the development process and the BETA will soon be ready for testing.
FOLLOW ME and I will keep you informed of the progress we make.
I share with you my technical analysis assessments on certain stocks that I follow as part of the strategies I design for my portfolio, but I do not recommend anyone to operate based on these indicators. Get informed, train yourself and build your own strategies when it comes to investing. I only hope that my comments help you on your own path :)

DOTUSD Is it really copying ETC's past Cycle?Polkadot (DOTUSD) appears to be following since its 2021 High (All Time High), ETC's previous Cycle of 2018 - 2021. As you can see on this 1W chart, the RSI sequences in particular between the two fractals are almost identical.
Lower Highs Double Tops leading to the Bear Cycle, then an RSI bottom leading to a price break-out above the 1W MA50 (blue trend-line) and on the 0.5 Fibonacci retracement level (on overbought RSI), finally followed by a new decline (RSI at 40.00), which in ETC's case when broken, led to the Bull Cycle's Parabolic Rally.
Right now it appears that DOT is on the 40.00 RSI Low, so naturally if it is indeed replicating Ethereum Classic's previous Cycle, we should see the price starting to rise aggressively towards the 1.5 Fibonacci extension. If that's the case, we can expect a High around $200 by the end of 2025.
-------------------------------------------------------------------------------
** Please LIKE 👍, FOLLOW ✅, SHARE 🙌 and COMMENT ✍ if you enjoy this idea! Also share your ideas and charts in the comments section below! This is best way to keep it relevant, support us, keep the content here free and allow the idea to reach as many people as possible. **
-------------------------------------------------------------------------------
💸💸💸💸💸💸
👇 👇 👇 👇 👇 👇

DOTUSDTDOT ~ 1W
#DOT Price reaches the demand zone again., Make purchases gradually with a target of at least 20%+ from here.
DOTUSDT Mid term Road MapBINANCE:DOTUSDT
DOT is forming a falling wedge on Daily timeframe , Up we go if we do breakout.
✨Traders, if you liked this idea or have your opinion on it, write in the comments, We will be glad.
_ _ _ _ __ _ _ _ _ _ _ _ _ _ _ _ _ _ _ _ _ _ _ _ _ _ _ _ _ _ _ _
✅Thank you, and for more ideas, hit ❤️Like❤️ and 🌟Follow🌟!
⚠️Things can change...
The markets are always changing and even with all these signals, the market changes tend to be strong and fast!!

Will DOTUSDT Explode Soon? Critical Levels You Need to Watch!Yello, Paradisers! Is #DOTUSDT setting up for a powerful bullish move? Let’s dive into this analysis.
💎#DOTUSDT is currently testing a key resistance level at $5.127. If the price manages to break above this resistance and flip it into support, we could see a strong bullish continuation from this newly established zone. Over time, we’ve noticed #Polkadot consistently respecting the descending resistance, and recently, it broke upward and is now assessing that critical resistance.
💎However, it’s important to stay vigilant. The bullish scenario will only be confirmed if the price decisively breaks above $5.127 with strong engulfing candles and sustained momentum. Until then, we remain cautious.
💎But what happens if the price fails to break above $5.127 and loses steam? In that case, it’s clear that sellers are taking control. The key area to watch is the lower strong support at $3.895, which has been tested and respected twice. If the price rebounds here, the bullish case remains intact. However, a break below $3.895 would invalidate the bullish setup and likely lead to a significant price drop.
💎Stay focused, patient, and disciplined, Paradisers. The next move is crucial, and we must be prepared for both scenarios. Remember, consistent profitability comes from strategic trading and effective risk management.
Strive for consistency, not quick profits. Treat the market as a businessman, not as a gambler.
MyCryptoParadise
iFeel the success🌴

[DOTUSDT] - FINALLY BREAKOUT!BINANCE:DOTUSDT one of the most important coins in market with 7.3b in marketcap (15 in rank)
there is nicely breakout in weekly chart ...important to retest
12$ is primary and sure target
best regards Ceciliones🎯

#DOT/USDT#DOT
The price is moving within a descending channel pattern on the 12-hour frame and is expected to break upwards
We have a downtrend on the RSI indicator that has been broken upwards and we have a tendency to stabilize above it
We have a major support level in green at a price of 4.20
We have a tendency to stabilize above the moving average 100 which supports the rise
Entry price 4.67
First target 5.40
Second target 6.02
Third target 6.70

DOT - Price hit accumulation zone #DOT/USDT #Analysis
Description
---------------------------------------------------------------
+ DOT price has hit accumulation zone and currently trading inside the accumulation zone.
+ Price is expect to trade in this range for upcoming weeks.
+ A clear breakout from this accumulation zone is essential for the trend reversal.
+ A breakout from the accumulation zone will push the price higher eventually result in a bullish trend.
+ Let's wait for the breakout before entering the trade.
---------------------------------------------------------------
Enhance, Trade, Grow
---------------------------------------------------------------
Feel free to share your thoughts and insights.
Don't forget to like and follow us for more trading ideas and discussions.
Best Regards,
VectorAlgo

Polkadot 2.0- So i predicted many times that 4.30$ was the bottom.
- And i was wrong, Polkadot is still young.
- Trading Altcoins is like that, it's really hard to predict a perfect bottom with a new project.
- it's much more easy with BTC because TheKing volumes are high and it stays around from many years already.
- Remember that Trading is trying to predict the future by looking at the past, more you have data from past, more the job is easier.
-------------------------------------------------------------------------------------------------------------
- A bit FA here :
-------------------------------------------------------------------------------------------------------------
- Polkadot did the same as Cardano's first bullrun, it went back to the start.
( i will post a Cardano Charts in comments )
- Actually it's not a sign of weakness, but an opportunity.
- Polkadot didn't make noise just because they want to build steady following some SEC rules.
- Now if you follow the news, you can find that Cardano, Polygon and Near Protocol are building on Polkadot's SDK, DYOR it more to get some more informations.
- With time Polkadot could be the mother of all blockchains connections and interoperability.
- Remember what they had to do with ETH when problems came around, they forked it for ETC ( Ethereum Classic ).
- Polkadot doesn't need any FORKs, everything can be changed by votes in the governance.
- The difference between DOT and ETH is very simple.
- Polkadot is scalable, Ethereum is not.
-------------------------------------------------------------------------------------------------------------
- Trading Parts :
-------------------------------------------------------------------------------------------------------------
- So Right now look at the graphic.
- DOT made a bottom around 3.60$. The exact same bottom it did in 2020.
- DOT is actually staying near a demand zone (6$).
- i do not recommend to buy now but wait for a retracement or a breakout from this area.
- To get peace of mind i would buy DOT after 8$, after that zone, it's a free fly!
-------------------------------------------------------------------------------------------------------------
My predictions on DOT for the next bullrun are unchanged :
-------------------------------------------------------------------------------------------------------------
- Security TP : 85$ ish
- Middle TP : 140$ ish
- Max ATH : 220$ ish
-------------------------------------------------------------------------------------------------------------
- if you missed to become a Whale with ETH in 2016.
- Here yours second chance with Polkadot.
- Stay S4fe
Happy Tr4Ding !

Will PolkaDot DOT reach the sky this bullrun?Hello, Skyrexians!
Despite the Bitcoin price fast recovery after correction, altcoins remain dead and we understand that it's really annoying for most of market participants. Most of traders now in huge loss after -60% dump for entire crypto market since March 2024. But crypto trading is very risky to experience it without proficiency in different crypto trading strategies. This time even top crypto bot trading strategies and the best crypto traders failed. Nobody has been waiting for such a big crash. Analyzing ideas of top crypto traders on TradingView we can see that most of them are still bullish. For sure it does not mean that market will definitely do down, but if when it start bouncing they remain bullish mood it's gonna be dangerous signal and different trading tools such as automated trading bots, grid trading bot and other algorithmic trading bots can face with a huge loss again. In our opinion only ai crypto trading bot can overcome this problem because of using non linear approach.
In today's article we are going to share with you our analysis on BINANCE:DOTUSDT to help you setup your crypto trading bot algorithm or trade manually. Hope it will help to avoid mistakes and decrease potential losses. Let's get started!
DOT macro overview
History of this crypto asset has enough bars to make a complex analysis. This fundamentally strong L0 project has been listed in 2020 just before the massive bull run. The previous bull run wave the largest degree wave 1. After that we saw the first sell off. Some traders may tell that it's wave 4, but we counted it as wave A inside the larger wave 2. Wave B set up the bull trap and printed the irregular correction and after that the wave C has started.
In our opinion this wave C inside 2 has been finished in October 2023 with the massive reversal bar at the bottom. This is the strongest signal of trend end. Now the new impulsive wave 3 has been started. We want you to pay attention to the fact that DOT is the uptrend asset, price has not hit the previous bull run start and it's the great sign that in this cycle it has a great chances to set new ATH.
Talking about potential targets we can use our favorite Fibonacci extension. The most conservative target is $51 (almost at the ATH), the likely one is $79 and unbelievable is $119. We expect the reaching at least the first target in $2024-$2025.

DOT - A Risky Opportunity for HoldingBINANCE:DOTUSDT (1W CHART) Technical Analysis Update
DOT is currently trading at $5.9 and the price is in a consolidation state. As we expect a bull market in crypto, it's likely that the price will bounce back from this consolidation zone. This is a good opportunity to buy some and hold in the spot market.
Entry level: $ 5.9
Stop Loss Level: $ 4.7
TakeProfit 1: $ 8.811
TakeProfit 2: $ 10.667
TakeProfit 3: $ 16.852
TakeProfit 4: $ 23.526
Max Leverage: 2x / Sport
Position Size: 0.5% of capital
Remember to set your stop loss.
Follow our TradingView account for more technical analysis updates. | Like, share, and comment your thoughts.
Cheers
GreenCrypto

#DOT/USDT#DOT
The price is moving within a bearish channel pattern on the 4-hour frame, which is a strong retracement pattern
We have a bounce from a major support area in green at 5.50
We have a tendency to stabilize above the Moving Average 100
We have a downtrend on the RSI indicator that supports the rise and gives greater momentum, upon which the price is based higher at the discount
Entry price is 5.80
First target 6.64
Second goal 7.42
Third goal 8.32

DOTUSDT 1DDOT ~ 1D
#DOT In 1D Time Frame, BITSTAMP:DOTUSD Successfully penetrated the resistance line of this pattern. this seems to be very good for bull domination. short term target of at least 10%+ from here.

DOTUSD Is Approaching An Important Resistance!!!Hey Traders, in today's trading session we are monitoring DOTUSD for a selling opportunity around 6.40 zone, DOT is trading in a downtrend and currently is in a correction phase in which it is approaching the trend at 6.40 support and resistance area.
Trade safe, Joe.

DOTUSD Bullish Money heist PlanMy Dear Robbers / Traders,
This is our master plan to Heist DOTUSD Market based on Thief Trading style Technical Analysis.. kindly please follow the plan I have mentioned in the chart focus on Long entry. Our target is Red Zone that is High risk Dangerous level, market is overbought / Consolidation / Trend Reversal at the level Bearish Robbers / Traders gain the strength. Be safe and be careful and Be rich.
Note: If you've got a lot of money you can get out right away otherwise you can join with a swing trade robbers and continue the heist plan, Use Trailing SL to protect our money.
Stop Loss : Recent Swing Low using 4h timeframe
Warning : Fundamental Analysis comes against our robbery plan. our plan will be ruined smash the Stop Loss. Don't Enter the market at the news update.
Loot and escape on the target 🎯 Swing Traders Plz Book the partial sum of money and wait for next breakout of dynamic level / Order block, Once it is cleared we can continue our heist plan to next new target.
support our robbery plan we can easily make money & take money 💰💵 Join your hands with US. Loot Everything in this market everyday make money easily with Thief Trading Style.

DOT USDTDOT/USDT Setup. After a confirmed breakout from the marked zone in green, we could take an entry at 6.535
Remember stop loss is your friend. Everything is on the chart.
Entry 6.535
S.L 6.293
T.P 1 6.736
T.P 2 6.993
T.P 3 7.409

DOT providing a clean Long SetupDOT with a nice bullish market structure break provides a long setup into the buyside liquidity above.
Low hanging fruit target provides the bread.
Good luck :)


DOT's next move.CRYPTOCAP:DOT
I see a bullish divergence on the daily chart at an important support level, and people are freaking out about how they spend money :)
Sorry, but I trust what I see on the charts.
The only invalidation point is $4.50.
If you are still here, here are more of my thoughts...
So what if #DOT paid big influencers to promote their project? Every project does that; it's their marketing strategy. It's good that they are investing in marketing because, in the crypto world, the cycle moves really fast, and to keep up, you need to spend on marketing.
Many projects, including some of your favorites right now, have paid influencers. It's like the death toll shown on your screen daily during the COVID-19 pandemic, which made you worry every day. But in reality, the death toll was almost the same before COVID-19; it was just shown to you daily.
You never know how much #ADA paid influencers. Disliking the idea of paying for and buying inorganic distribution is misguided.

POLKADOT ... ready for next movehello dear traders and investors
this price action for polkadot with usdt pair … this is very strong supourt zone on the 5.28 $ … after price rejected from 6$
In order for the price to rise further, it needed liquidity, and when it reached the $5.3 area, it took that liquidity and now it is ready to rise...
this is lower time frame The price forming a bullish patern :
In my opinion, the next price station is (13.58 ) the prz area of the harmonic pattern that you can see in the chart...
good luck

Polkadot (DOT): Setting Up for a Bullish ReversalBINANCE:DOTUSD has recently breached the $6 level, forming a bullish divergence, as indicated by the vertical lines on the chart. The exit from the 3.618 Fibonacci time zone should ideally mark the end of Wave 2, though the exact completion of Wave 2 may lie slightly outside this range. It appears that Polkadot has completed its accumulation phase and is now entering the manipulation phase, with potential for expansion to follow.
Given the current situation, we are planning to place an entry at $4.85, with a stop-loss set just below the 100% Fibonacci retracement to protect against a Wave 2 invalidation. Our initial target is $9.30, aligning with the Daily Fair-Value Gap. This strategy aims to capture the potential upward movement as Polkadot transitions from accumulation to expansion.
Yearly VWAP Analysis:
Polkadot is currently holding the 2021 VWAP level perfectly. However, if this level is lost, the price could move down towards the 2021 VAL (Volume Area Low) at $4.55, which might provide significant support. To resume a bullish trend, Polkadot needs to reclaim the 2021 VAH (Volume Area High) at $6.80. Overcoming this level is essential for a sustained bullish move. If these levels are breached, a drop to the 2021 VAL at $4.55 is possible, where we might find strong support. Overcoming the yearly VWAP resistance is crucial for a bullish continuation.
Monthly VWAP Analysis:
Polkadot has lost the April VAL (Volume Area Low) and recently touched the November 2023 VWAP. Holding the November 2023 VWAP is crucial to maintaining a bullish stance, although there is potential for further downside. We anticipate a possible drop to retest the November 2023 VWAP and VAL levels to gather momentum for a bullish reversal. To turn bullish again, Polkadot needs to reclaim the current month's April VAL and VWAP levels, suggesting a stronger bullish outlook.
Conclusion:
If Polkadot fails to hold the November 2023 VWAP, we expect a move towards $4.82. For a bullish reversal, reclaiming the April VAL and current monthly VWAP levels is essential. Until these levels are reclaimed, we remain cautious and anticipate further downside. Our trading strategy involves entering at $4.85, with a stop-loss at $3.55. The take-profit targets are set at $7.76, $9.50, and open for further potential gains.
