$DOT - Polkadot imminent bullish momentumHey traders!
Hope you are doing GREAT!
On this occasion I've decided to spot on CRYPTOCAP:DOT as its showing a clear bullish momentum ( as other alts). The chart is clear about the movement. There is no need to use fancy indicators neither a complex analysis.
Just price action.
As a brief comment, $Polkadot broke a clear bearish trend with confirmation on the daily timeframe. That's why I'm looking for a speculative trade (just in and out).
What I'm targeting? Prices between 6.00 USD and 7.00 USD in short term could be a nice zone to take profits.
Stay tuned!
DOTUSDT

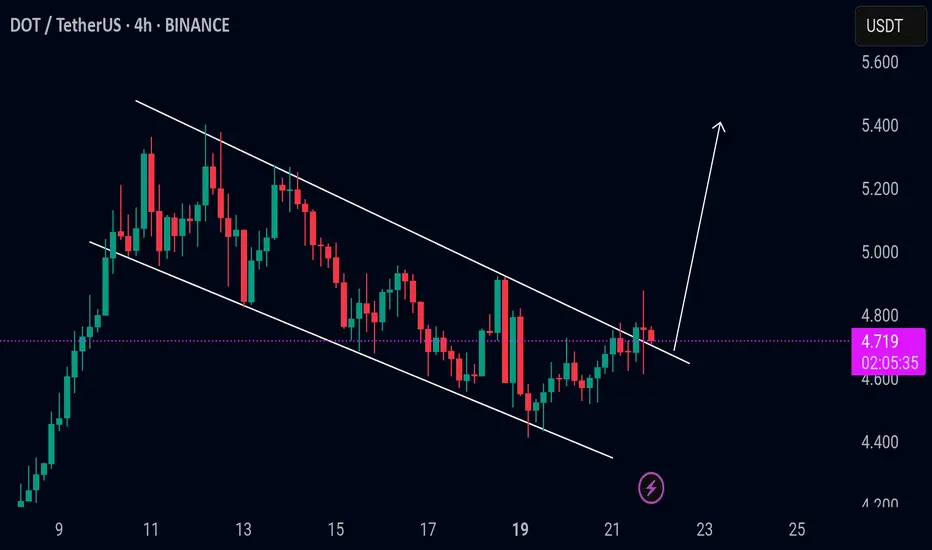
Polkadot —Higher Low & Bullish ContinuationThis one is time sensitive. Polkadot (DOTUSDT) is about to produce a bullish continuation. The higher low is in and the action just turned green.
The first advance ended 12-May, it's been 16 days. There is almost no retrace, very small but it lasted more than two weeks. This is all normal price action.
The retrace ends in a higher low and the higher low evolves into a new advance or higher high. The next rise will last much longer than the previous one, say, 30 days straight up. This can be the minimum as it can go for longer.
After this advance, which will be a big one, there can be a correction followed by the bull run phase. It is hard to know the specifics because we will have six months of growth with a correction in-between. The correction can last 1 month just as it can last 3 months but no more. Most likely around 2 months, the big one.
This correction will end in a higher low followed by additional growth until we get the cycle top.
Prices are still low. It is still early.
But after the current move that is developing now, it won't be early anymore. Everybody entering the market after the start of this continuation will be late. There will be plenty of room available for growth, but bottom prices will be forever gone.
Namaste.

DOTUSD📊 30m Analysis – DOTUSD
Strategy: 🐊 Alligator Strategy
Trend: 📈 Strong Uptrend
📝 Trade Plan
🎯 Entry Point (EP): 4.603
🛡️ Stop Loss (SL): 4.530
💰 Take Profit 1 (TP1): 4.680
💰 Take Profit 1 (TP1):4.75
Risk Reward 1:1 TP1
Risk Reward 1:2 TP2

DOT has HUGE UPSIDE Potential | PolkadotPolkadot could be a late bloomer this season, but there's still much room for growth on this altcoin.
Taking a look at DOT from a macro timeframe, we clearly see the bearish cycle after the ATH, and then a bottom out when we start to see the price making higher lows.
This undoubtedly shows us that Polkadot IS CURRENTLY bullish - even though we're not seeing the big increases just yet. After a retest here in the pointed out area, it's likely DOT can run. DOT and other alts will likely retrace as ETH gears up and starts increasing, before they get their turn to run:
It should be noted that DOT is trading over 1000% away from its previous ATH. And even though that may be a stretch, I'd be happy with a 100%!
Don't miss the SOLANA update with a trade setup 🎁 :
____________________
BINANCE:DOTUSDT

Polkadot Eyes $5.38 – Is a 17% Rally on the Horizon?As of May 26, 2025, DOT/USDT is showing signs of a potential bullish reversal on the 4-hour chart, forming a strong setup for upward movement. Key technical levels and chart structures support this bullish outlook.
1. Strong Support Zone
• Zone: $4.30 – $4.37
• This area has acted as a major support, where buyers previously stepped in, leading to strong upward moves. Currently, the price has rebounded from this support zone, suggesting renewed bullish pressure.
• A bounce from this zone with increasing volume confirms the strength of this level and validates it as a demand zone.
2. Bullish Entry Setup
• The entry appears to be positioned slightly above the support zone, near $4.60.
• The risk-to-reward ratio is favorable (~2.7), indicating a well-placed setup for swing traders.
• A small stop-loss (~6.36%) below the support at $4.30 protects against a false breakdown.
3. Key Resistance and Target Levels
• TP1 / Recent Resistance: $4.93
This level marks a recent swing high and minor resistance. A breakout above this would confirm short-term bullish continuation.
• TP2 / Major Resistance: $5.38
This is the major resistance level and final take-profit zone. It aligns with a previous market top, and its breach could lead to further bullish continuation into a higher timeframe breakout.
4. Projected Path and Price Action
• The chart outlines a bullish projection path, anticipating higher lows and higher highs forming a stair-step rally.
• This dotted path suggests a bullish trend structure with gradual momentum buildup.
• Buyers may continue pushing the price upward through TP1 toward TP2 in the coming sessions, especially if macro conditions or Bitcoin price action remain favorable.
5. Market Structure & Candlestick Behavior
• The market recently transitioned from a short-term downtrend into a consolidation phase.
• Bullish candlestick formations around the support zone imply accumulation.
• The recent bullish engulfing near the support further confirms buyer dominance and a potential trend reversal.
6. Risk Management and Outlook
• Stop-Loss: Below $4.30 to manage downside risk.
• Target Zones: $4.93 (TP1), $5.38 (TP2).
• A break below $4.30 would invalidate the bullish thesis and suggest caution.
• As long as DOT remains above the $4.37 zone, the bullish scenario remains intact.
Conclusion
DOT/USDT is currently in a bullish setup on the 4-hour chart with a high-probability reversal from the support zone. Traders may look for confirmation candles and volume support to enter long positions with TP1 at $4.93 and TP2 at $5.38. Risk remains contained below the $4.30 level.

DOTUSDT , 1HrPattern is looking Good , If BTC is Sustaining Above 1,06,834 this level then , This DOT pattern will Give a Good Breakout ,
Enter only When Upper Trendline is Breakout
Take Your Own Risk According to your Capital .
Follow for More Ideas Like This

DOT/USDT breakout alertDOT/USDT breakout alert
DOT has broken out of the bull flag pattern and is currently showing bullish momentum. The bull flag is a continuation pattern, and this breakout suggests the potential for further upward movement if the breakout holds with strong volume.
However, if the price falls back into the flag channel, it could be a fakeout, so it's important to monitor closely.
Key levels to watch:
* Breakout confirmation zone
* Flag support area
* Volume strength for confirmation
Keep an eye on DOT — a confirmed move above the flag could trigger the next leg up.
DOTUSDT Potential UpsidesHey Traders, in today's trading session we are monitoring DOTUSDT for a buying opportunity around 4.20 zone, DOTUSDT is trading in an uptrend and currently is in a correction phase in which it is approaching the trend at 4.20 support and resistance area.
Trade safe, Joe.

Polkadot (DOT/USDT) Ready to Explode? Full Technical Breakdown Hello everyone!
In today’s idea, I’ll be breaking down the technical analysis of BINANCE:DOTUSDT . I hope you find this analysis valuable and insightful for your trading decisions.
On weekly TF
- There was a huge liquidity sweep on the bottom of 4 AUG 2024 on APRIL 2025
- As shown in the chart above, the MACD has started to cross bullishly on 1W timeframe. The last time this occurred, DOT rallied by approximately 200%.
- Two weekly candles have closed above the previous high that led to the last bottom (around $4.772), signaling a market structure shift from bearish to bullish.
On 4D TF
- On the OBV , a downtrend line was broken, and a retest is currently in progress.
- There is a very important Fair Value Gap (FVG) being retested right now.
- Note: The 4D candle closes today. Monitor closely to see if it closes above the FVG — respect the FVG.
- A good potential entry zone is between $4.44 – $4.241.
In conclusion, DOT/USDT is showing promising bullish signals across higher timeframes, with a potential entry zone between $4.44 – $4.241. As always, manage your risk and wait for confirmation before entering. I’ll be watching the 4D close closely — stay sharp!

DOT: Possible support and targetsHi,
As always, this is just for fun. To hit play on the future and see how correct or wrong I was :)
My strategy is to buy low (and keep buying if it gets lower) and sell high (in fractions) on the way up when hitting important areas. There is no more magic or secrets.

PolkaDot DOT Let's Wait Agains The CrowdHello, Skyrexians!
As I mentioned in the recent BINANCE:DOTUSDT analysis the bounce to approximately $6 was predictable and very likely. Now it's happening. Green candles caused a lot of greed again, yesterday I checked the sentiment sharing some bearish minds in Tradingview and got a lot of negative. What's a pity, but the market again is not ready for altseason.
In this case we have now the following scenario. Recent divergence on Awesome Oscillator was just the wave 5 in 3 finish, now we have wave 4 which can be finished inside the $5.2-6.4 area. Then I expect wave 5 which has the target inside $2-3 in the best case. About the worst scenario I don't want even to talk now. Bear market is not over for alts, don't be greedy.
Best regards,
Skyrexio Team
___________________________________________________________
Please, boost this article and subscribe our page if you like analysis!

Polkadot Next Target Confirmed ($16.8 —PP: 285%)My sources within the Cryptocurrency market have confirmed the next target for Polkadot (DOTUSDT) in the short- to mid-term, that is a target of $16.8 for total profits potential of 285% from current price.
There is a full bottom reversal complete based on an inverted head and shoulders pattern (iH&S). The pattern is complete and a recovery is happening above the neck line.
Today's candle/session is full green and hitting the highest price on a rise since mid-March.
The above target confirmed by my sources is a very easy target. There is also a target at $8.42 yielding some 100% and is very, very easy.
After these targets are hit, Polkadot will continue to grow long-term and even extend to reach a new All-Time High in late 2025.
Bullish momentum is starting now and will grow daily, more and more, over and over until maximum momentum is present. Expect everything Crypto bullish next.
Thank you for reading and for your continued support.
Namaste.

DOTUSDT: $10 Targeting, Price is at critical level! Hey there everyone
The pair is at a pivotal point where we might see a surge in bullish activity. Remember how price has acted in the past? Well, we can expect something similar, leading to a sudden jump to $10. It’s a fantastic opportunity, but it also comes with a fair bit of risk.
Wishing you all the best and happy trading! 😊
We really value your unwavering support! ❤️🚀
If you’d like to lend a hand, here are a few ways you can contribute:
- Give our ideas a like
- Share your thoughts in the comments
- Spread the word about our ideas
Cheers,
Team Setupsfx_

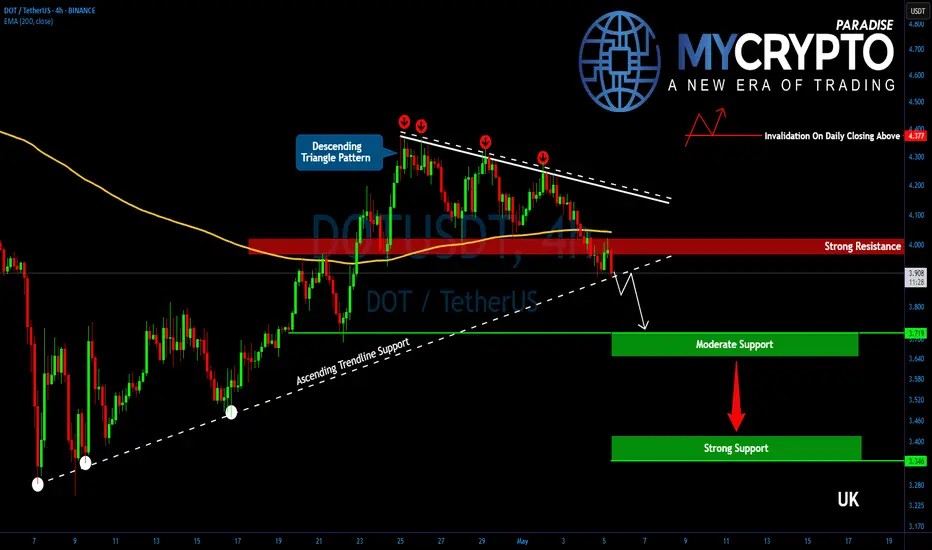
DOTUSDT Is Hanging by a Thread! Breakdown Ahead?Yello, Paradisers! Is #DOT about to hit new yearly lows? The structure is getting ugly again—don’t get caught off guard as this setup is starting to turn dangerous fast.
💎After a brief and weak corrective bounce, DOTUSDT is once again losing steam. The price has already broken down from a descending triangle—a bearish continuation pattern—and is now threatening to breach its key ascending support level. Momentum is shifting aggressively back in favor of the bears.
💎#DOTUSDT is now hanging to the critical $3.90 support level. A decisive breakdown below this zone would likely trigger another wave of selling pressure, opening the door for a drop toward the next moderate support range at $3.72 to $3.65. While this area could attract some short-term profit-taking, the broader trend remains clearly vulnerable, with bearish momentum continuing to dominate.
💎Should bearish pressure continue, and it’s highly likely at this stage that DOT could fall all the way toward the stronger support zone between $3.40 and $3.35. This region marks the 52-week low, and it's where bulls might step in to defend and attempt a meaningful rebound.
💎Additionally, the 2-hour EMA-200 has shown itself to be a strong trend guide. Every time DOT traded above it, bulls had a slight edge. But now that price has once again broken below this moving average, momentum is back with the bears.
Paradisers, strive for consistency, not quick profits. Treat the market as a businessman, not as a gambler.
MyCryptoParadise
iFeel the success🌴
DOT : Long PositionEverything is clear..
We can get a long position because price break the trend line and is up of It.
Polkadot Setup Unfolding - Wait for the Breakout!🔍 Polkadot (DOT/USDT) Technical Breakdown
Currently analyzing DOT/USDT, and when we zoom out to the higher timeframes (📆 weekly and daily), it’s clear that price remains in a macro bearish trend 📉. We’ve recently seen a deep retracement into the upper end of the range — a region I would classify as premium pricing 💰.
Despite the recent bullish momentum 🔼, I'm exercising caution when it comes to long positions. From a value perspective, this isn’t where I want to be buying. Instead, my bias leans bearish — but only if specific criteria are met. ✅
I'm watching closely for a clear break of the current range, ideally with:
1️⃣ A market structure break
2️⃣ Strong price displacement (to confirm intent)
3️⃣ A shift in order flow and momentum to support a downside move 🚨
These concepts are influenced by a blend of Wyckoff theory and ICT (Inner Circle Trader) principles 🧠, which I walk through in detail in the video.
📚 As always, this is for educational purposes only — not financial advice. 💼❌

DOT/USDT 1H Chart UpdateDOTUSDT broke its Long-Term Resistance last week!
After consolidating in a Redistribution phase (similar to mid-April), Polkadot is now testing the $4.00 support zone.
▸ Bullish Target: If $4.00 holds, we could see a climb to $4.50 or higher!
▸ Bearish Risk: A breakdown below $4.00 might push the price to $3.90 or lower.
Eyes on $4.00 — will the bulls defend this level? Let’s talk!

DOTUSDT 1D AnalysisDOT ~ 1D Analysis
#DOT Buy when re -testing this support with a short -term target of at least 10%+ from here.

DOTUSDT LONG/BUYBy utilizing Fibonacci retracement levels, historical patterns, , we can formulate a hypothesis that the market might follow a similar trajectory if bullish sentiment prevails.

DOTUSDT - U should have some DOT in ur portfolio3D chart shows breakout a falling wedge pattern after a drop of 70% ... this is a strong buy signal
so keep ur eye on it! ... target is 12$
Best regards Ceciliones🎯

DOT the most important historical support!DOT / USDT
The price just toke the liquidity and come back above the most important suppprt level in dot chart with long green wick (strong buy action)
As long as the price continues to close above the current level we think for strong bounce in the coming weeks
However, if and only if the price lose this level on HTF DOT will make new lows
Conclusion: this support acts as DO or DIE for future price action … bullish as long as it stay above it but if it lost on HTF it will into strong bearish
Note: many coins have same chart
Best of wishes

DOTUSDTIt should be at $6 and then a correction and a rally to $12 and then a stronger correction and finally a major rally to $24.210
Market geometry is doing its job

#DOT/USDT#DOT
The price is moving within a descending channel on the 1-hour frame, adhering well to it, and is heading towards a strong breakout and retest.
We are seeing a bounce from the lower boundary of the descending channel, which is support at 4.05.
We have a downtrend on the RSI indicator that is about to be broken and retested, which supports the upward trend.
We are looking for stability above the 100 moving average.
Entry price: 4.08
First target: 4.10
Second target: 4.15
Third target: 4.20
