Baby Doge coin Hello friends
.Based on the chart: Important levels are marked
.This analysis is personal opinion
.Follow me to see more analysis
.Analyzer: Joseph
.Date of analysis:23jul
DOTUSDT

DotDot finally broke above daily EMA12 and 25. It is now retesting the breakout zone and EMAs. Dot/Btc also has bullish divergence. Looks like it will be heading toward 8.5 now. Buy at current price with stoploss below EMA12 (closing basis-If it closes a daily candle below EMA12, then close it.).

DOTUSDT:D1Hello friends
.Based on the chart: Important levels are marked
.As each trend line is broken, the target will be the next trend line
.A Falling wedge pattern is also observed
.This analysis is personal opinion
.Follow me to see more analysis
.Analyzer: Joseph
.Date of analysis:22jul

DOTUSDT - SELLHello traders, I'm about to sell DOTUSDT from one of these zones, let the price create a signal and come and make money! We don't have a confirmed bull trend yet, so I'm looking for opportunities to sell, they help me accumulate more coins.
I personally prefer setting up multiple TPs , here's an explanation:
1) 1:1 allows you to take a 50% position and thus secure a balance against loss in case the market turns
2) 2-5 :1 means profit (25% trade volume ), after reaching this TP I move SL to BE
3) 5-10 :1 means bonus money with rest of trade volume 25%
In this way, I ensure that my equity curve grows consistently without significant dips.
Money is lying on the ground, just bend down for it! Be patient and wait for the price to reach a strong zone and open a position!

Polkadot | Buy The Dip 8X lev. (1000%+ Potential)Polkadot was rejected at EMA50 and retraced to test EMA21/10 as support.
This opens up an opportunity to buy the dip.
The targets are mapped on the chart.
Namaste.

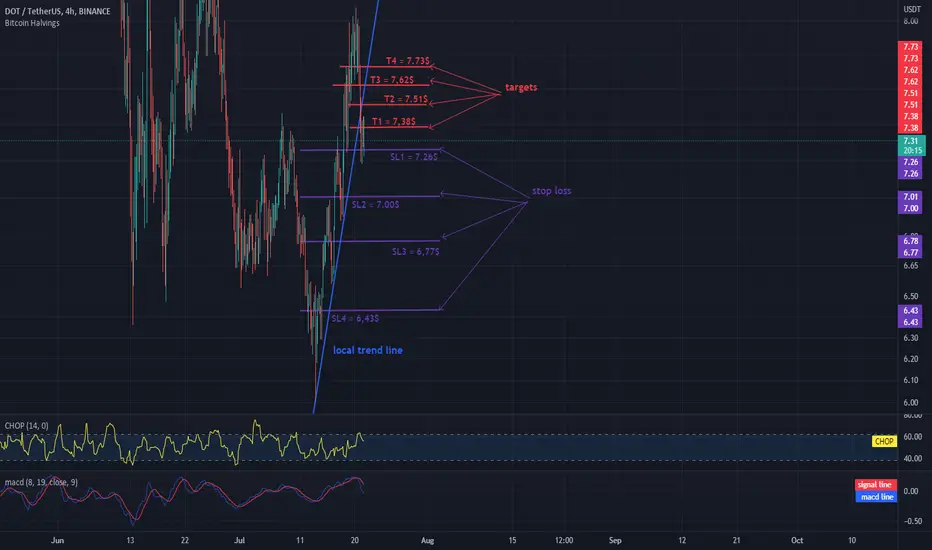
DOT SHORT 4H INTERVALHello everyone, let's take a look at the 4H DOT vs. USDT chart. As you can see, the price has dropped below the local uptrend line.
Let's start by setting goals for the near future that we can consider:
T1 = $ 7.38
T2 = $ 7.51
T3 = $ 7.62
and
T4 = $ 7.73
Now let's move on to the stop loss in case of further market declines:
SL1 = $ 7.26
SL2 = $ 7.00
SL3 = $ 6.77
and
SL4 = $ 6.43
Looking at the CHOP indicator, we can see that in the 4H range we still have a lot of energy, while the MACD indicator shows a local downward trend.
DOTUSDT 12h Possible scenario movement for Polkadot priceToday we will analyze the local situation on the DOTUSDT price schedule.
But to begin with, we recommend that you familiarize yourself with our global idea of DOTUSD on a 3-day timeframe.
At the final price squeeze, sellers managed to spill the price below $6.36 to $6.02. However, buyers sharply bought the decline and closed the trading day at $6.46, after which the growth continued.
If we compare the price rebound of DOT with other altcoins, we can say that it is average in terms of values, maybe even weaker than the average statistical rebound.
However, if you believe in the prospects of the Polkadot project and ecosystem, but did not have time to buy it at the bottom, then fate may give you a second chance.
Buying in the area $6.65-7.00
And further growth is possible according to the following route: $7.00 - $9.00 - $7.50 - $10.00
_______________________________
Since 2016 , we have been analyzing and trading the cryptocurrency market.
We transform our knowledge, trading moods and experience into ideas. Each "like under the idea" boosts the level of our happiness by 0.05%. If we help you to be calmer and richer — help us to be happier :)


Short DOTUSDTPERPShort DOTUSDTPERP
The way the price has moved in recent time, I feel that the price will go down further from here. I see a shorting opportunity here.
Entry: around 7.684
SL: 7.935

Polkadot Closes Full Green (100% Or More Still Available)Yesterday Polkadot (DOTUSDT) produced a full green candle and managed to close above EMA50 for the first time since March.
The doors are open for massive bullish action.
We have multiple targets to the upside but MA200 or the 1.618 Fib. extension level is the main one.
From the current price, that's a 100%+ potential.
(1,000%+ on 10X lev.)
Are you certain that prices will go there?
We have the same bottom pattern we looked many times in the past.
Each altcoin trading pair that had this pattern, low on 12-May followed by lower low 13-June, etc. have gone all the way up to MA200 and EMA300.
Polkadot is no exception, this altcoin pair will also grow.
Namaste.

DOT / USDT 4H CHART - fight the resistance!Hello everyone, let's take a look at the 4H DOT to USDT chart as you can see the price broke above the local downtrend channel and started a local uptrend.
Let's start by setting goals for the near future that we can consider:
T1 = $ 7.96
T2 = $ 8.49
T3 = $ 9.10
and
T4 = $ 9.94
Now let's move on to the stop loss in case of further market declines:
SL1 = $ 7.55
SL2 = $ 7.26
SL3 = $ 7.00
SL4 = $ 6.77
and
SL5 = $ 6.43
Looking at the CHOP indicator, we can see that in the 4H range we still have energy to continue the movement and the MACD indicator confirms the local upward trend.

DOTUSDT | Break of the wedge opens a profitable short positionHello everyone
I have prepared a new signal for you, I write every day 10 profitable trades for the Russian and English audience, I think it will not be difficult to like and comment on the idea, your feedback is very important to me Go to the channel there is a lot of useful information.
Let's break down the #DOT chart
On the chart, the formation of a falling wedge, the price broke through the wedge with a strong removal of one candle.
I expect further growth to the local ($8.38) resistance, after which we can consider a short position.

Week 05 | DOTUSDT | Short Position | H1 | 19-07-2022Dot is currently at its resistance level. It's showing bearish candles and we can take a small trade at this stage.

long DOT$DOT broke through the descending trendline. Rise to resistance level at 8,92$ is likely to happen.

Polkadot DOT at important trendlinePolkadot DOT at important trendline
Exciting to watch what DOT will do within the next days - a confirmed break to the upside and bottom might be in
But a danger of fakeout always has to be considered dear Crypto Nation
Who is a DOT HODLER? Tell me...
*not financial advice
do your own research before investing

DOTUSDTHello Crypto Lovers,
Mars Signals team wishes you high profits.
This is a 4-hour-time frame analysis for DOTUSDT
As we predicted on July 12, we expected a rising trend and obviously you see this has happened and one of our targets is hit. In this chart, we have R1 as our resistance line and also we have S1 and S2 and S3 the support lines that include the support of the price at several points since the past. Now we have the price fluctuating below R1 and we believe it will rise to this line and then it will start its falling trend to S1 and lower than that. By the time the price falls to S1, it may have another rise to R1 and even above that.
Warning: This is just a suggestion and we do not guarantee profits. We advise you to analyze the chart before opening any positions.
Wish you luck


DOTDOT Looks good at this point for a great ROI risk to reward! All timeframes are lining up together for maybe a test of $12.00

DOT/USDT BREAKOUT READY TO PUMP 100%!!Hi guys, This is CryptoMojo, One of the most active trading view authors and fastest-growing communities.
Do consider following me for the latest updates and Long /Short calls on almost every exchange.
I post short mid and long-term trade setups too.
Let’s get to the chart!
I have tried my best to bring the best possible outcome in this chart, Do not consider it as financial advice.
BUY DOT/USDT ON THE SPOT
DOT is making this falling wedge pattern
Entry range:-$6.86 to $7.10
Target:- 100%
SL:- $6.30
This chart is likely to help you in making better trade decisions if it did consider upvoting this chart.
Would also love to know your charts and views in the comment section.
Thank you

DOTUSDbetter look non phone chart as previously posted
retested breakout high from 2020 and bouced
might see a pullback across the board, soon or aug for muh mt gox btc unlock
eitherway fundamentally psycologically we appear to have seen max fud
next is cuck breakout longers?
thensend eet?
or macro recession also but unemployement would suggest otherwise and inflation is still fairly uncontrolable despite the feds warpath best efforts
time will tell

Dotusd67% ish to the .382 of the downmove
This thing still only has 2 useable chains built into it as far as im aware...
Any fundamental catalyst from here should see some serious relief, havent heard of anything yet but the chart looks nice and its not moved yet compared to other highly rated L1s

DOT (falling wedge)DOT / USDT
falling wedge breakout done
As long as price is holding we are looking for next resistances located in my charts
Best of wishes

Falling wedge patern with decreasing volume Polkadot to 16$Hello traders, after having made a long research i think that dot could make a very strong move to the upside due to the falling wedge pattern that printed on daily time frame.
In my opinion it looks really bullish, but not only for the falling wedge on daily, it has also descending volume witch is a confirmation sign and means that to see an increase on volume it's a matter of time.
It has already performed a success full breakout and a retest and now it is trading above of the upper trend line of the falling wedge.
It is likely for it to go to 16$, but anything is sure in the market so i will keep moving the stop behind the key levels. It will be more likely to reach higher prices if it manages to surpass the exponential moving average of 55 on daily around 8.6$ witch is too a resistance.
If will be glad to see what do you think in the comments and if you agree with me push the like button.
