DOTUSDT 1WDOT Update ~ 1W
#DOT Still maintaining its bullish structure. This is wave 2. buy in stages from here. With a minimum target of 20%++. Wave 3 is the longest wave in the Eliot Wave pattern.
Dotusdtanalysis
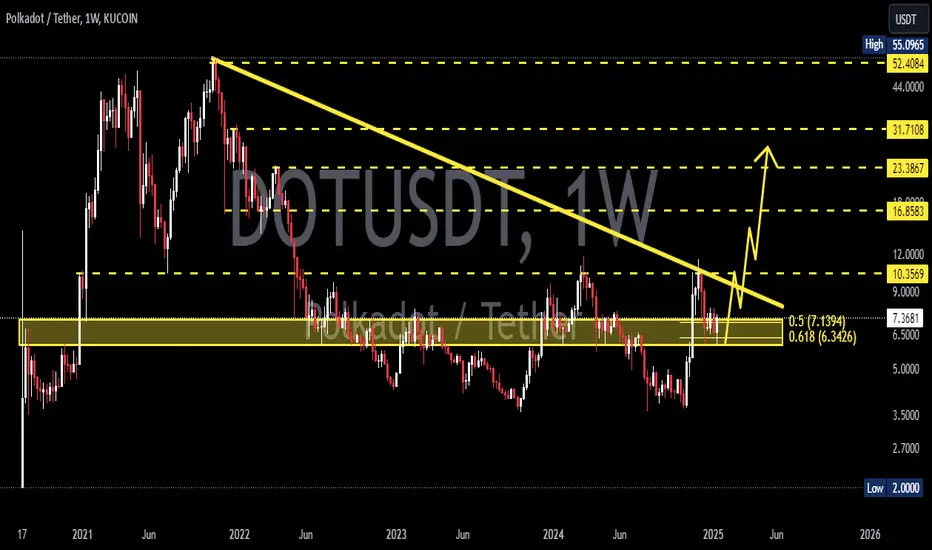
DOT/USDT at Key Support: A Surge on the Horizon?DOT/USDT is currently trading at a crucial level, aligning with the golden Fibonacci 0.618 and a key support zone.
If USDT.D drops from its current levels, we could see a potential surge in DOT, supported by its strong fundamentals.

DOT/USD "Polkadot vs USD" Crypto Market Bullish Heist Plan🌟Hi! Hola! Ola! Bonjour! Hallo!🌟
Dear Money Makers & Robbers, 🤑 💰
Based on 🔥Thief Trading style technical and fundamental analysis🔥, here is our master plan to heist the DOT/USD "Polkadot vs USD" Crypto market. Please adhere to the strategy I've outlined in the chart, which emphasizes long entry. Our aim is the high-risk Red Zone. Risky level, overbought market, consolidation, trend reversal, trap at the level where traders and bearish robbers are stronger. Be wealthy and safe trade.💪🏆🎉
Entry 📈 : You can enter a Bull trade at anypoint,
however I advise placing Buy limit orders within a 15 or 30 minute timeframe. Entry from the most recent or closest low or high level should be in retest.
Stop Loss 🛑: Using the 4H period, the recent / nearest low or high level.
Goal 🎯: 10.500
Scalpers, take note 👀 : only scalp on the Long side. If you have a lot of money, you can go straight away; if not, you can join swing traders and carry out the robbery plan. Use trailing SL to safeguard your money 💰.
Warning⚠️ : Our heist strategy is incompatible with Fundamental Analysis news 📰 🗞️. We'll wreck our plan by smashing the Stop Loss 🚫🚏. Avoid entering the market right after the news release.
Fundamental Outlook 📰🗞️
Considering these factors, the DOT/USD pair may experience a Bullish trend in the short-term, driven by:
Increasing adoption and usage of DOT, driven by its interoperability features and growing ecosystem.
Improving blockchain development and scalability.
Growing developer interest and user adoption.
Bullish Factors:
Increasing adoption and usage of DOT, driven by its interoperability features and growing ecosystem.
Improving blockchain development and scalability.
Growing developer interest and user adoption.
Potential for increased institutional investment and mainstream recognition.
Competitive advantages over other cryptocurrencies, such as faster transaction times and lower fees.
Please note that this is a general analysis and not personalized investment advice. It's essential to consider your own risk tolerance and market analysis before making any investment decisions.
Take advantage of the target and get away 🎯 Swing Traders Please reserve the half amount of money and watch for the next dynamic level or order block breakout. Once it is resolved, we can go on to the next new target in our heist plan.
Keep in mind that these factors can change rapidly, and it's essential to stay up-to-date with market developments and adjust your analysis accordingly.
💖Supporting our robbery plan will enable us to effortlessly make and steal money 💰💵 Tell your friends, Colleagues and family to follow, like, and share. Boost the strength of our robbery team. Every day in this market make money with ease by using the Thief Trading Style.🏆💪🤝❤️🎉🚀
I'll see you soon with another heist plan, so stay tuned 🫂

Is DOTUSDT Preparing for a Reversal?Yello, Paradisers! DOTUSDT has been moving within a descending channel, presenting a textbook retracement pattern. Now, all eyes are on the crucial support zone, which could be the key turning point for the next move.
💎If DOTUSDT reaches this support zone and forms bullish patterns like a bullish I-CHoCH (Internal Change of Character), a W-pattern, or even an inverse head and shoulders, the probabilities for a bounce significantly increase. This could signal a potential bullish reversal from this critical area.
💎However, in the case of panic selling or deeper retracement, we may see a bounce from the strong support zone below. But remember, confirmation is key—bullish patterns in these zones will strengthen the case for a reversal.
💎If DOTUSDT breaks below the strong support zone and closes a candle there, this would invalidate the bullish setup. In such a scenario, waiting for new price action to develop is the smarter, safer move.
Staying patient and disciplined is essential here. Trade strategically, avoid impulsive moves, and let the market show its hand before jumping in. Remember, the best trades come to those who wait for the highest probability setups.
MyCryptoParadise
iFeel the success🌴

DOTUSDT 1WDOT Update ~ 1W
#DOT Still maintaining its bullish structure. This is wave 2. buy in stages from here. With a minimum target of 20%++. Wave 3 is the longest wave in the Eliot Wave pattern.

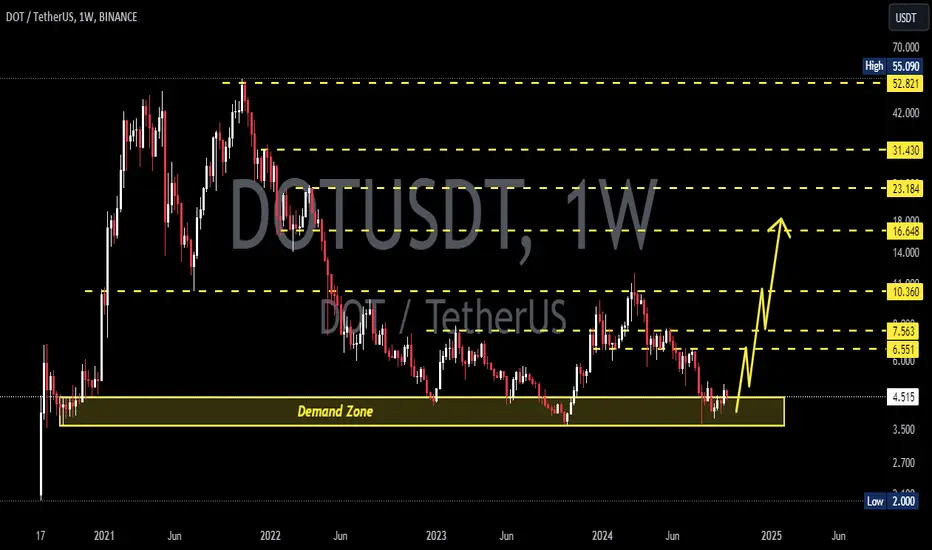
DOTUSDT | FIRST LINE OF DEFENSEDOTUSDT: Potential Support at the Green Box
In this analysis, the green box emerges as a promising support area worth keeping on our radar.
This zone holds significance for two reasons:
It represents a key demand area, where buying interest could outweigh selling pressure.
It serves as the first line of defense, a crucial level that could prevent further downside.
Trading Strategy
Lower Time Frame Reactions: The focus is on monitoring price action within the green box and the adjacent blue box zone.
Long Trade Opportunities: If the price shows favorable reactions (e.g., bullish patterns or increased volume) in these areas, it can set the stage for well-structured long trades.
This approach emphasizes precision and patience, allowing for entries that align with market dynamics.
Summary
The green box in DOTUSDT is a zone to watch closely as a potential pivot for the next upward move. Stay alert to lower time frame signals to fine-tune trade setups and capitalize on this opportunity.
I keep my charts clean and simple because I believe clarity leads to better decisions.
My approach is built on years of experience and a solid track record. I don’t claim to know it all, but I’m confident in my ability to spot high-probability setups.
My Previous Analysis
🐶 DOGEUSDT.P: Next Move
🎨 RENDERUSDT.P: Opportunity of the Month
💎 ETHUSDT.P: Where to Retrace
🟢 BNBUSDT.P: Potential Surge
📊 BTC Dominance: Reaction Zone
🌊 WAVESUSDT.P: Demand Zone Potential
🟣 UNIUSDT.P: Long-Term Trade
🔵 XRPUSDT.P: Entry Zones
🔗 LINKUSDT.P: Follow The River
📈 BTCUSDT.P: Two Key Demand Zones
🟩 POLUSDT: Bullish Momentum
🌟 PENDLEUSDT.P: Where Opportunity Meets Precision
🔥 BTCUSDT.P: Liquidation of Highly Leveraged Longs
🌊 SOLUSDT.P: SOL's Dip - Your Opportunity
🐸 1000PEPEUSDT.P: Prime Bounce Zone Unlocked
🚀 ETHUSDT.P: Set to Explode - Don't Miss This Game Changer
🤖 IQUSDT: Smart Plan
⚡️ PONDUSDT: A Trade Not Taken Is Better Than a Losing One
💼 STMXUSDT: 2 Buying Areas
🐢 TURBOUSDT: Buy Zones and Buyer Presence
🌍 ICPUSDT.P: Massive Upside Potential | Check the Trade Update For Seeing Results
🟠 IDEXUSDT: Spot Buy Area | %26 Profit if You Trade with MSB
📌 USUALUSDT: Buyers Are Active + %70 Profit in Total

Polkadot DOT’s $8.442 Standoff: Bounce or Breakdown?DOT is hovering around a key support zone, at $8.442.
1. A quick dip and bounce back from $8.442 might hint that the bulls aren’t ready to give up just yet (Dashed Green Projection).
2. If DOT confidently pushes through $9.659, the bulls might have a party, with the next pit stop likely around $11.009. A clean move here could set the stage for some exciting action to the upside (Solid Green Projection).
3. However, if the $8.442 level crumbles, things could get dicey fast. Bears might take over, dragging the price toward $7.000, a critical support level where DOT could try to catch its breath (Red Projection).
Right now, DOT is at a tipping point—will it rise to the occasion or falter? Keep your focus on $9.659 and $8.442; they’re calling the shots for what comes next.

DOT/USDT Analysis: Below the Blue Line StrategyObjective:
I am positioning myself to participate in every opportunity below the blue line, as this marks a critical price threshold for potential buying interest.
Key Details
The Blue Line:
Represents a significant level derived from technical analysis, acting as a pivot for high-probability setups.
This level may correspond to strong historical support or a psychological price barrier.
Strategy Focus:
Below the blue line, I expect price to offer discounted entries, whether through sharp reversals, consolidations, or breakout retests.
My aim is to accumulate positions progressively within this zone.
Market Behavior Below the Line:
Reversals: Price sweeps below the line and rebounds strongly.
Consolidation: Price stabilizes near the blue line, forming a base for a potential upward move.
Breakouts: If price drops further, I will look for deeper value zones before re-evaluating.
Action Plan
Entries:
Initiate long positions incrementally below the blue line based on price reactions (bullish market structure breaks in lower time frames).
Stop Loss:
Place below the next significant support zone to minimize risk. 8.9$, If I stop out I will have another entry at 8.3$
Take Profit:
Target levels at key Fibonacci extensions, resistance areas, or psychological round numbers. 15$ for example.
Note: Risk management and patience are critical. This strategy relies on disciplined execution and monitoring price action closely for confirmation signals.
I keep my charts clean and simple because I believe clarity leads to better decisions.
My approach is built on years of experience and a solid track record. I don’t claim to know it all, but I’m confident in my ability to spot high-probability setups.
My Previous Analysis
🐶 DOGEUSDT.P: Next Move
🎨 RENDERUSDT.P: Opportunity of the Month
💎 ETHUSDT.P: Where to Retrace
🟢 BNBUSDT.P: Potential Surge
📊 BTC Dominance: Reaction Zone
🌊 WAVESUSDT.P: Demand Zone Potential
🟣 UNIUSDT.P: Long-Term Trade
🔵 XRPUSDT.P: Entry Zones
🔗 LINKUSDT.P: Follow The River
📈 BTCUSDT.P: Two Key Demand Zones
🟩 POLUSDT: Bullish Momentum
🌟 PENDLEUSDT: Where Opportunity Meets Precision
🔥 BTCUSDT.P: Liquidation of Highly Leveraged Longs
🌊 SOLUSDT.P: SOL's Dip - Your Opportunity
🐸 1000PEPEUSDT.P: Prime Bounce Zone Unlocked
🚀 ETHUSDT.P: Set to Explode - Don't Miss This Game Changer
🤖 IQUSDT: Smart Plan
⚡️ PONDUSDT: A Trade Not Taken Is Better Than a Losing One
💼 STMXUSDT: 2 Buying Areas

Polkadot- I understand it may feel like a challenging time, but remember, fortune favors the bold.
- Using extreme leverage, whether 30X or 100X, won't lead to wealth.
- it often leads to losses.
- Instead, consider buying on the spot market; it's a more stable strategy. When the market dips, that's the perfect time to dollar-cost average (DCA) more.
- Hold your positions, stake wisely, and most importantly :
- exercise patience.
- it's the ultimate key to success.
- Keep an eye on the charts, watch for triple bottoms, track trends, and be mindful of bubbles and Fibonacci levels.
Happy Tr4Ding!

DOTUSDTDOT ~ 1W
#DOT Price reaches the demand zone again., Make purchases gradually with a target of at least 20%+ from here.

Polkadot (DOT) Set for Potential Rebound? Key Price Action Signa👀👉 Despite recent downward pressure, Polkadot (DOT) is showing a bullish break of market structure on the 30-minute timeframe. I’m closely monitoring for a possible buying opportunity, guided by the key criteria discussed in the video. In this analysis, we’ll highlight the critical price action signals to follow and how to strategically position yourself for the next potential move. Disclaimer: This analysis is for informational purposes only and does not constitute financial advice. 📊✅

DOTUSDTDOT ~ 1W
#DOT Price reaches the demand zone again., Make purchases gradually with a target of at least 20%+ from here.

DOTUSDT 1H - TRIANGLE Resolution UP or DOWN ???If you like my AT, and you agree with the approaches, please FOLLOW ME and press BOOST so we can share it with more people. We are working on an automated Trading tool so that everyone can apply their strategies professionally. Thank you!
______________________________________________________________________________
DOTUSDT 1H - TRIANGLE Resolution
One thing is the analysis in long time frames and another very different thing in shorter time frames.
In fact, it is necessary to have the perception of both at the same time for our decision making.
Although DOT is at a very attractive price to BUY, we have to study what would be the best time to enter the value.
In the 1H analysis, we can see the triangulation zone where it is located. It is better to wait to see how it is resolved even if you end up paying a little more for the token.
LEVELS:
SL: 3.90
TP1: 4.90
TP2: 6.55
_______________________________________________________________________________
All these strategic alternatives can be configured with TradeX BoT, as it will allow you to position in both directions without having to block any amount per position. It will only be necessary for the conditions to be met, either downwards or upwards, for the orders to be executed in one direction or the other, taking the necessary deposits from your portfolio.
TradeX BoT (in development): Tool to automate trading strategies designed in TradingView. It works with both indicators and technical drawing tools: parallel channels, trend lines, supports, resistances... It allows you to easily establish SL (%), TP (%), SL Trailing... multiple strategies in different values, simultaneous BUY-SELL orders, conditional orders.
This tool is in the process of development and the BETA will soon be ready for testing.
FOLLOW ME and I will keep you informed of the progress we make.
I share with you my technical analysis assessments on certain stocks that I follow as part of the strategies I design for my portfolio, but I do not recommend anyone to operate based on these indicators. Get informed, train yourself and build your own strategies when it comes to investing. I only hope that my comments help you on your own path :)

DOTUSDTDOT ~ 1W
#DOT Price reaches the demand zone again., Make purchases gradually with a target of at least 20%+ from here.

DOTUSDTDOT ~ 1W
#DOT Price reaches the demand zone again., Make purchases gradually with a target of at least 20%+ from here.
Is Polkadot going to make lower low?Yellow Line - BOS zone
White Line - Resistance of Bearflag pattern.
This is my idea on BINANCE:DOTUSDT and how it will go. We all know Dot is one of the top altcoins with huge potential. As you can see BINANCE:DOTUSDT is much likely to form a bearflag pattern before it goes up. If DOT ever reaches the 2.5-3 zone I would re-enter Long position again. You may think why 2.5-3 zone? isn't it going to make lower low? For me seeing a lower low is a confirmation that we are in a bearflag pattern and checking the bottom support line 3rd time is a huge confirmation to consider a Long Position. So time will tell!

DOTUSDT 1DDOT ~ 1D
#DOT In 1D Time Frame, BITSTAMP:DOTUSD Successfully penetrated the resistance line of this pattern. this seems to be very good for bull domination. short term target of at least 10%+ from here.

DOT/USDT Price Update in Daily TimeframeHello everyone, I’m Cryptorphic.
For the past seven years, I’ve been sharing insightful charts and analysis.
Follow me for:
~ Unbiased analyses on trending altcoins.
~ Identifying altcoins with 10x-50x potential.
~ Futures trade setups.
~ Daily updates on Bitcoin and Ethereum.
~ High time frame (HTF) market bottom and top calls.
~ Short-term market movements.
~ Charts supported by critical fundamentals.
Now, let’s dive into this chart analysis:
#DOTUSDT is currently trading within a well-defined descending triangle pattern with strong support around the $5.5-$6 range.
~ Support Zone: A strong support zone exists between $5.5 and $6, highlighted in green. This area has historically acted as a significant support level, preventing further downward movement.
~ Resistance Levels: The primary resistance levels to watch are $7.6 and the major resistance at $11.58, which aligns with the peak levels from early 2024.
~ Relative Strength Index (RSI): The RSI indicator at the bottom of the chart shows a bullish divergence, with the RSI making higher lows while the price makes lower lows. This divergence often precedes a potential bullish reversal.
If DOT/USDT breaks above the descending triangle, the 100EMA, and the primary resistance levels, the measured move target from the breakout point suggests a potential rally up to approximately $12.
The invalidation point will be a breakdown and close below the $5.5 support level.
DYOR. NFA.
Please hit the like button to support my content and share your thoughts in the comment section. Feel free to request any chart analysis you’d like to see!
Thank you!
#PEACE

Polcadot DOT price chooses the path to the end of the yearWe don't know what's going on in the #Polkadot project fundamentally, but we've heard almost nothing about their sensational parachains.
So let's just write what we see on the #DOTUSDT chart
1️⃣ The #DOT price seems to have drawn an H&S figure and is hovering over an abyss.
If it consolidates below $6, the fall may continue to $4.5, and in the worst case scenario, to $3
2️⃣ But as long as the #DOTUSD price is above $6-6.50, CRYPTOCAP:DOT holders can believe in a miracle and literally pray for a blue scenario.
Its working out to the region of $17-17.50 will allow at least some to exit positions that have been held for 2-3 years.
_____________________
Did you like our analysis? Leave a comment, like, and follow to get more

POLKADOT Are you ready to move 30% ?Polkadot: Coiling for a Breakout?
Polkadot, the interoperable blockchain platform, has been exhibiting a relatively slow and steady price movement in recent weeks. This methodical approach, however, could be laying the groundwork for a significant breakout.
Price Action and Support Levels
After forming a well-defined box pattern, Polkadot has established an ascending trendline that is currently acting as support. This consolidation phase has allowed the bulls to gather strength and prepare for a potential surge.
The key resistance level to watch is $7.6. A decisive break above this level could trigger a rapid upward movement, potentially pushing Polkadot towards its first target of $8.7.
Bullish Momentum and Potential Targets
The recent break of the downtrend line and positive technical indicators indicate that Polkadot is ready to break. The bullish momentum could further accelerate if the price manages to hold above the $7.6 support level.
With the downward trendline out of the way, a $10 target is not out of the realm of possibility. This ambitious target could be achieved if Polkadot continues to demonstrate strong buying pressure and positive market sentiment.
Potential Pullback and Overall Outlook
While the bullish outlook is promising, it's important to acknowledge the possibility of a pullback to the $7.6 support area before the continuation of the upward trend. Such a pullback would be a healthy retracement and could provide an opportunity for new buyers to enter the market.
Overall, the technical analysis suggests that Polkadot is in a favorable position for a breakout. The price action, support levels, and technical indicators all align with a bullish scenario. However, as with any investment, it's crucial to exercise caution and conduct thorough research before making any trading decisions.

DOTUSD 1WDOT ~ 1W
#DOT We hope that this Support Block will be retested again. And we wouldn't hesitate to place a sizable purchase here. with a long-term target of at least 25%+

DOT Intraday Buzz: Dive into Profit Potential Now!The chart highlights breakout/rejection points, criteria, and targets to execute on the trade opportunity.
Find more in the signature!

DOT is likely to head towards monthly resistance around 20The price has been consolidating on the weekly and monthly support WS1+MS1 area for quite some time and looks like ready to take off from here. I think the path is clear to travel from here up to monthly resistance around 20.
