DOT/USDT Weekly Accumulation or Annihilation?📌 Overview & Market Context
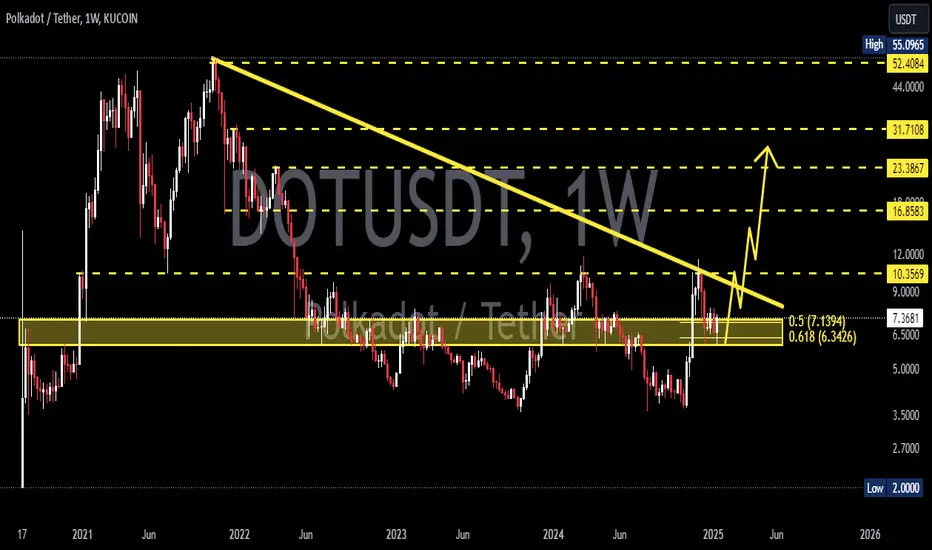
Polkadot (DOT) is currently testing one of the most critical technical zones in its price history. Price action is revisiting a multi-year demand zone between $2.70 and $3.60, which has previously served as the springboard for explosive upward moves — including the 2021 rally to all-time highs near $55.
This weekly chart reveals that DOT may be transitioning from a prolonged downtrend into an accumulation phase, often seen before major bullish expansions.
🧱 Historical Support Zone & Technical Validation
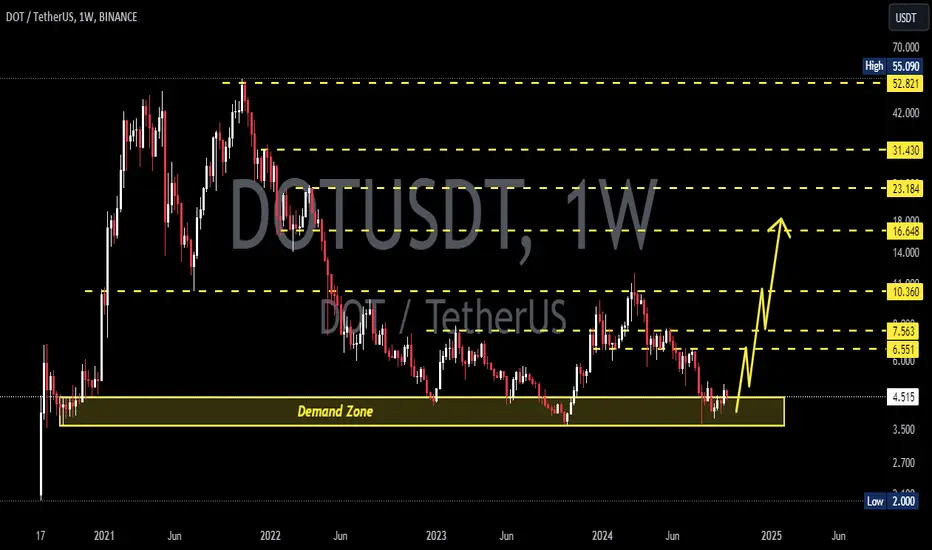
🔹 The yellow demand zone ($2.70–$3.60) has acted as a strong support multiple times since 2020.
🔹 Price has once again bounced from this area, forming a potential triple bottom or accumulation base pattern, consistent with Wyckoff Accumulation Theory.
🔹 A confirmed bullish candlestick (e.g., bullish engulfing, hammer, or long-tail doji) on the weekly timeframe could signal early institutional accumulation and a potential macro trend reversal.
🟢 📈 Bullish Scenario: Strong Reversal Potential
If DOT successfully holds this support and forms a higher low, we could see a multi-leg bullish breakout, targeting the following resistance levels:
🎯 Target Price Level Significance
TP1 $4.75 First structural breakout
TP2 $5.88 Minor historical resistance
TP3 $7.63 Previous consolidation zone
TP4 $10.37 Major weekly resistance
TP5 $12.49–14.00 Extension zone during strong rallies
🧠 Note: A move from the current level to $14 represents a potential 250%+ upside — a major opportunity if confirmed by momentum and market sentiment.
🔴 📉 Bearish Scenario: Breakdown from Historic Support
A clean break below $2.70 with high volume would invalidate the bullish setup and signal:
Breakdown from a multi-year base structure.
Possible entry into a new bearish price discovery phase.
Next psychological support at around $2.00 or lower.
This scenario could materialize if:
Bitcoin or broader crypto markets turn bearish.
Macro factors worsen.
No strong demand appears from long-term holders.
⚖️ Strategy & Investor Insights
Swing Traders: Consider aggressive entries near current levels with tight stops below $2.70.
Mid-Term Investors: This is an ideal zone for DCA (dollar-cost averaging), with attractive long-term risk-reward.
Confirmation Needed: Watch for structure breakouts above $4.75 and momentum from RSI/volume indicators.
🧠 Market Psychology: Fear Breeds Opportunity
DOT is currently in what can be described as the “boredom phase” — the stage in market cycles when most traders have given up, and smart money quietly accumulates.
As Warren Buffet famously said:
> “Be fearful when others are greedy, and greedy when others are fearful.”
#DOTUSDT #Polkadot #CryptoReversal #AltcoinSetup #TechnicalAnalysis #SmartMoneyMoves #AccumulationPhase #SupportZone #BullishCrypto #BearishBreakdown
Dotusdtbuy

DOTUSDT: $10 Targeting, Price is at critical level! Hey there everyone
The pair is at a pivotal point where we might see a surge in bullish activity. Remember how price has acted in the past? Well, we can expect something similar, leading to a sudden jump to $10. It’s a fantastic opportunity, but it also comes with a fair bit of risk.
Wishing you all the best and happy trading! 😊
We really value your unwavering support! ❤️🚀
If you’d like to lend a hand, here are a few ways you can contribute:
- Give our ideas a like
- Share your thoughts in the comments
- Spread the word about our ideas
Cheers,
Team Setupsfx_

DOTUSDT LONG/BUYBy utilizing Fibonacci retracement levels, historical patterns, , we can formulate a hypothesis that the market might follow a similar trajectory if bullish sentiment prevails.

DOTUSDT: On The Way To $12 By End Of Year ? BINANCE:DOTUSDT The price of BINANCE:DOTUSDT has taken a turn, and it looks like it’s gonna follow the same pattern. Right now, the market is bullish, and we can see the price heading towards our target in the coming weeks.
Good luck with your trades
Thanks for your support! 😊
If you want to help us out, here are a few things you can do:
- Like our ideas
- Comment on our ideas
- Share our ideas
Team Setupsfx_
❤️

DOTUSDT 1WDOT ~ 1W Analysis
#DOT The lowest support that needs to be maintained, or this coin will experience further decline.

DOT Nearing Key Support: Potential for Bullish Breakout..!At the moment, DOT is nearing its critical support level of $6, a price point that has historically acted as a significant resistance level in the past. It's essential to be patient and observe for a strong bullish signal or a bullish technical pattern, such as a breakout or a reversal formation, before making any decisions about entering a long position.
For those investors with a long-term perspective, this price level could present an opportune moment to start accumulating DOT. Given the overall market trends and potential for recovery, a reasonable price target for DOT could be around $11. This target reflects the possibility of upward momentum as the market dynamics shift, providing a favorable outlook for long-term investment strategies.

DOTUSDT 1WDOT Update ~ 1W
#DOT Still maintaining its bullish structure. This is wave 2. buy in stages from here. With a minimum target of 20%++. Wave 3 is the longest wave in the Eliot Wave pattern.
DOTUSDT 1WDOT Update ~ 1W
#DOT Still maintaining its bullish structure. This is wave 2. buy in stages from here. With a minimum target of 20%++. Wave 3 is the longest wave in the Eliot Wave pattern.

DOTUSDTDOT ~ 1W
#DOT Price reaches the demand zone again., Make purchases gradually with a target of at least 20%+ from here.

DOTUSDTDOT ~ 1W
#DOT Price reaches the demand zone again., Make purchases gradually with a target of at least 20%+ from here.

DOTUSDTDOT ~ 1W
#DOT Price reaches the demand zone again., Make purchases gradually with a target of at least 20%+ from here.

DOTUSDTDOT ~ 1W
#DOT Price reaches the demand zone again., Make purchases gradually with a target of at least 20%+ from here.
#DOT/USDT#DOT
The price is moving within a descending channel pattern on the 12-hour frame and is expected to break upwards
We have a downtrend on the RSI indicator that has been broken upwards and we have a tendency to stabilize above it
We have a major support level in green at a price of 4.20
We have a tendency to stabilize above the moving average 100 which supports the rise
Entry price 4.67
First target 5.40
Second target 6.02
Third target 6.70

DOTUSD Bullish Money heist PlanMy Dear Robbers / Traders,
This is our master plan to Heist DOTUSD Market based on Thief Trading style Technical Analysis.. kindly please follow the plan I have mentioned in the chart focus on Long entry. Our target is Red Zone that is High risk Dangerous level, market is overbought / Consolidation / Trend Reversal at the level Bearish Robbers / Traders gain the strength. Be safe and be careful and Be rich.
Note: If you've got a lot of money you can get out right away otherwise you can join with a swing trade robbers and continue the heist plan, Use Trailing SL to protect our money.
Stop Loss : Recent Swing Low using 4h timeframe
Warning : Fundamental Analysis comes against our robbery plan. our plan will be ruined smash the Stop Loss. Don't Enter the market at the news update.
Loot and escape on the target 🎯 Swing Traders Plz Book the partial sum of money and wait for next breakout of dynamic level / Order block, Once it is cleared we can continue our heist plan to next new target.
support our robbery plan we can easily make money & take money 💰💵 Join your hands with US. Loot Everything in this market everyday make money easily with Thief Trading Style.

#DOT A rebound from pricey supportConsidering the failure in the weekly time and reaching the resistance, the expectation to reach the support is high
You can make purchases in two steps
Don't forget that the price goes up with your likes

POLKADOT BULLISH SCENARIOSpolkadot last bottom zone for me is 5 dollars and I think I will buy from there if it falls. I think these two scenarios will develop, stay tuned. fibonacci levels are very important.

DOT/USDTTRADE ALERT!DOT
Ticker: DOT/USDT
Entry: 7.35-7.70
Take Profit:8.50-9.50-11
Stop Loss: 6.8
Risk to reward: 1:2
Technical Thesis: We have 4hr 50 EMA support at 7.60$
Price is also a strong area which has given multiple bounce in past.

DOTDot is currently facing resistance at weekly resistance.
There is a buying opportunity to buy if it manages to sustain above the weekly resistance.

DOT target 712h time frame
-
DOT broke the downtrend line and creating a small bullish flag(lower time frame). Also, DOT might start following the Dow's theory to go above previous high at 6, then this breakout will be validated. With Fibonacci analysis, we can have target at 7 and 8
TP: 6.8~7.3 / 8.2
SL: 4.77

DOTUSDT at weekly and monthly support confluenceThe price is trading at the confluence of weekly and monthly support. The upper side of this support range has already held the price twice in past and provided bounces. The first one was stronger than the second one. The second bounce slowly retraced and has come back into the support zone. I think this is the last line of a significant support at least for the pair on this chart. And I expect this support to hold and make the price reverse for significant move to the upside. The price still has the possibility to go a bit below and probably breach this support on intra weekly basis but it should not close below it. Overall, this one is looking good for the long side on high time frame but some smaller downside potential is still there and therefore slowly building a long position is desired and recommended.

DOTUSDT on daily support, likely to head towards 6.4The price has hit the daily support. A long shall be favorable here. The target for the long should be the daily resistance around 6.4. If the price loses daily support, the price is very likely to bounce from weekly support marked on the chart. That support is very likely to hold and makes the long very favorable.

🟢 DOTUSDT - 1D (08.10.2022)🟢 DOTUSDT
TF: 1D
Side: Long
SL: $5.4930
TP 1: $6.8478
TP 2: $7.3891
TP 3: $7.8265
Expecting big things from DOT. Which ever path it takes should lead to a break out.

DOT/USDT BREAKOUT READY TO PUMP 100%!!Hi guys, This is CryptoMojo, One of the most active trading view authors and fastest-growing communities.
Do consider following me for the latest updates and Long /Short calls on almost every exchange.
I post short mid and long-term trade setups too.
Let’s get to the chart!
I have tried my best to bring the best possible outcome in this chart, Do not consider it as financial advice.
BUY DOT/USDT ON THE SPOT
DOT is making this falling wedge pattern
Entry range:-$6.86 to $7.10
Target:- 100%
SL:- $6.30
This chart is likely to help you in making better trade decisions if it did consider upvoting this chart.
Would also love to know your charts and views in the comment section.
Thank you
